

Exercise-induced electrocardiographic changes after treadmill exercise testing in healthy children: A comprehensive study
- PMID: 35527774
- PMCID: PMC9075564
- DOI: 10.4103/apc.apc_254_20
Exercise-induced electrocardiographic changes after treadmill exercise testing in healthy children: A comprehensive study
Abstract
Background: Treadmill exercise testing is a crucial diagnostic tool for evaluating congenital and acquired heart disease in the pediatric population. This study aimed to perform a comprehensive evaluation of exercise-induced electrocardiographic (ECG) changes in children. Although there are numerous studies on exercise testing in various cardiac pathologies, studies on exercise-induced ECG changes in normal children with coverage of all ECG parameters of atrial and ventricular depolarization and repolarization are very scant, if any.
Aims and objectives: This study aimed to investigate the exercise-induced ECG changes in healthy children and evaluate the effects of gender and four different formulas of heart rate correction of Bazett, Fridericia, Framingham and Hodges on ventricular repolarization parameters pre-and post-exercise.
Materials and methods: Between April 2019 and April 2020, all children with normal electrocardiogram, echocardiogram and exercise test, high-quality ECG tracings and consent for participation were enrolled in this prospective study. Twenty electrocardiographic parameters were measured and 25 indices were calculated. P-value < 0.05 was considered significant.
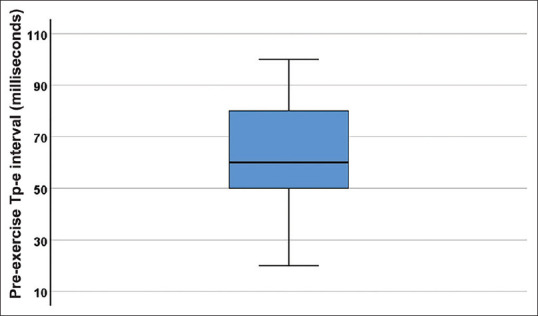
Results: Seventy-four healthy children were studied. Amplitudes of P, S, and T waves increased significantly after the exercise. All durations, except P wave time to peak and T peak -T end /QT (Tp-e/QT) interval decreased significantly with exercise. Generally, the parameters of ventricular repolarization were not statistically significant between males and females. There were significant differences among the heart-rate corrected values of intervals of QTc, QoTc, JTc, J point to peak T and Tp-e/QTc by various formulas. There was no U wave either at pre-exercise or post-exercise. QT interval was shortened by 24.6 % ± 12.1 % with exercise. The ECG-derived estimated duration of mechanical systole and diastole decreased with exercise. The percentage of decrease in diastole was more than systole (43.79 %± 13.31% versus 33.74% ±15.79 %, respectively, P-value < 0.001).
Conclusion: Diastolic time decreased more than systolic time with exercise and systolic time to diastolic time increased with exercise. Hodges' and Fridericia's formulas resulted in the longest and shortest QT and QoT, JT, and JTP, respectively. Thus, using a single value as the cut-off for long QT syndrome can lead to under or over-diagnosis. Nomograms incorporating data on age, heart rate, and heart rate correction formula are indispensable for accurate long QT diagnosis. Furthermore, gender differences in ventricular repolarization parameters are not generally present in 5 to 14-year-old healthy children. The lack of U wave in this study may implicate the need for more careful investigation in the presence of U wave in the treadmill exercise testing of healthy children.
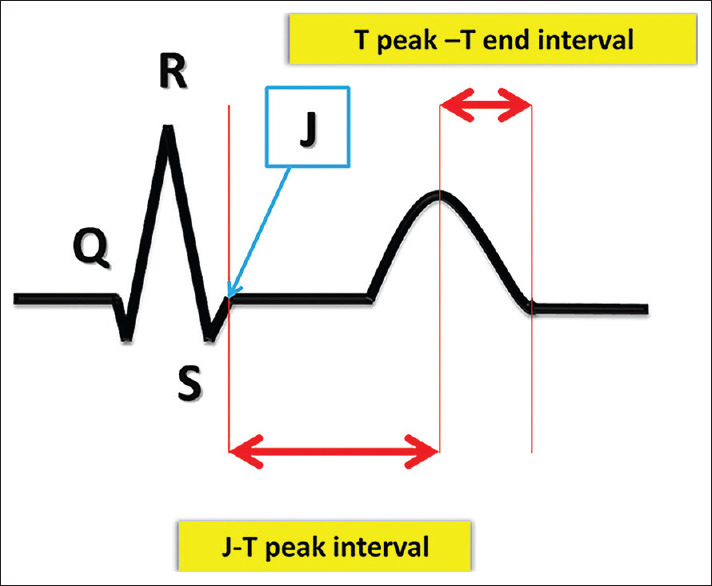
Keywords: Electrocardiogram; J point to end of T wave interval; J to peak T interval; Onset of Q wave to the end of T wave interval; T peak to T end interval; exercise test.
Copyright: © 2022 Annals of Pediatric Cardiology.
Conflict of interest statement
There are no conflict of interest.
Figures
Similar articles
-
Comparison of formulae for heart rate correction of QT interval in exercise ECGs from healthy children.Heart. 2001 Aug;86(2):199-202. doi: 10.1136/heart.86.2.199. Heart. 2001. PMID: 11454842 Free PMC article.
-
Effects of Prediabetes on Ventricular Repolarization Markers in Electrocardiography.Rev Cardiovasc Med. 2025 Feb 19;26(2):26266. doi: 10.31083/RCM26266. eCollection 2025 Feb. Rev Cardiovasc Med. 2025. PMID: 40026516 Free PMC article.
-
The best QT correction formula in a non-hospitalized population: the Fasa PERSIAN cohort study.BMC Cardiovasc Disord. 2022 Feb 16;22(1):52. doi: 10.1186/s12872-022-02502-2. BMC Cardiovasc Disord. 2022. PMID: 35172723 Free PMC article.
-
Does obesity have an effect on the ECG in children?J Pediatr Endocrinol Metab. 2020 May 26;33(5):585-589. doi: 10.1515/jpem-2019-0539. J Pediatr Endocrinol Metab. 2020. PMID: 32229672 Review.
-
The negative U wave: a pathogenetic enigma but a useful, often overlooked bedside diagnostic and prognostic clue in ischemic heart disease.Clin Cardiol. 2004 Dec;27(12):674-7. doi: 10.1002/clc.4960271203. Clin Cardiol. 2004. PMID: 15628108 Free PMC article. Review.
Cited by
-
Brazilian Guideline for Exercise Testing in Children and Adolescents - 2024.Arq Bras Cardiol. 2024 Sep 16;121(8):e20240525. doi: 10.36660/abc.20240525. Arq Bras Cardiol. 2024. PMID: 39292116 Free PMC article. English, Portuguese.
-
Uncovering possible silent acquired long QT syndrome using exercise stress testing in long-term pediatric acute lymphoblastic leukemia survivors.Int J Cancer. 2025 Jan 15;156(2):403-416. doi: 10.1002/ijc.35168. Epub 2024 Sep 8. Int J Cancer. 2025. PMID: 39244732 Free PMC article.
References
-
- El Assaad I, Gauvreau K, Rizwan R, Margossian R, Colan S, Chen MH. Value of exercise stress echocardiography in children with hypertrophic cardiomyopathy. J Am Soc Echocardiogr. 2020;33:888–94.e2. - PubMed
-
- Marcadet DM, Pavy B, Bosser G, Claudot F, Corone S, Douard H, et al. French Society of Cardiology Guidelines on Exercise Tests (part 2): Indications for exercise tests in cardiac diseases. Arch Cardiovasc Dis. 2019;112:56–66. - PubMed
-
- Massin MM. The role of exercise testing in pediatric cardiology. Arch Cardiovasc Dis. 2014;107:319–27. - PubMed
-
- Ogedengbe JO, Adelaiye AB, Kolawole OV. Effects of exercise on PR intervals, QRS durations and QTC intervals in male and female students of University of Abuja. J Pak Med Assoc. 2012;62:273–5. - PubMed
-
- Faul F, Erdfelder E, Lang AG, Buchner A. G*Power 3: A flexible statistical power analysis program for the social, behavioral, and biomedical sciences. Behav Res Methods. 2007;39:175–91. - PubMed
LinkOut - more resources
Full Text Sources
Miscellaneous