. 2022 Apr 18:16:850193.
doi: 10.3389/fnins.2022.850193. eCollection 2022.

Control of Behavioral Arousal and Defense by a Glutamatergic Midbrain-Amygdala Pathway in Mice

Affiliations

Control of Behavioral Arousal and Defense by a Glutamatergic Midbrain-Amygdala Pathway in Mice

Shang-Yi Chen et al. Front Neurosci. .

Abstract

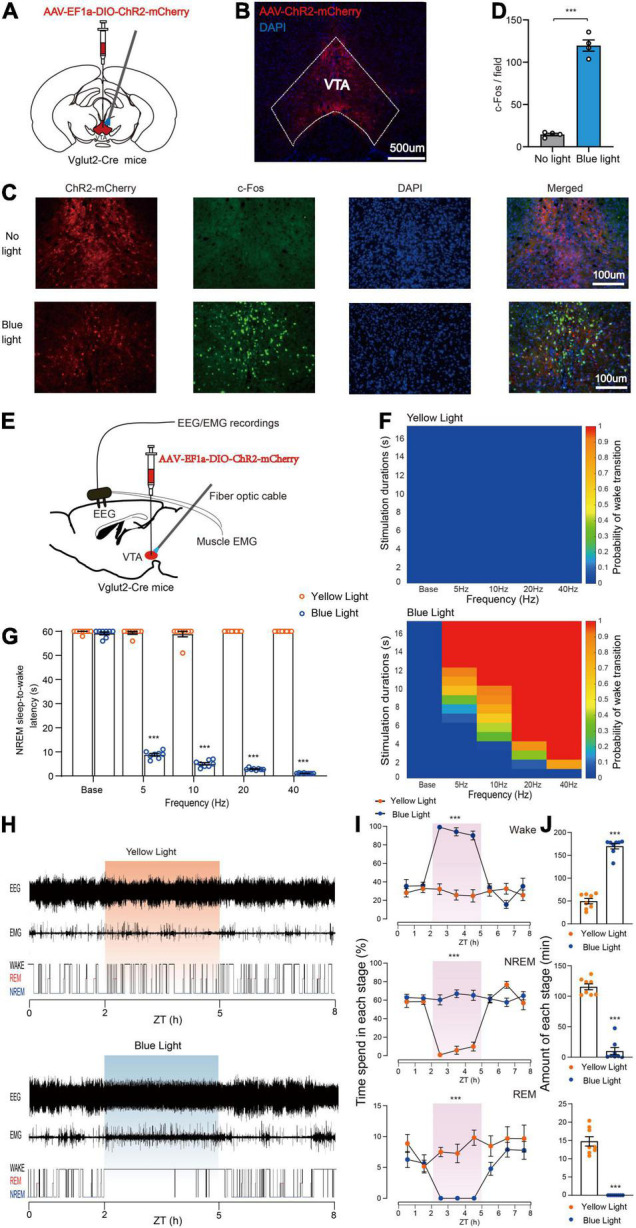
In response to external threatening signals, animals evolve a series of defensive behaviors that depend on heightened arousal. It is believed that arousal and defensive behaviors are coordinately regulated by specific neurocircuits in the central nervous system. The ventral tegmental area (VTA) is a key structure located in the ventral midbrain of mice. The activity of VTA glutamatergic neurons has recently been shown to be closely related to sleep-wake behavior. However, the specific role of VTA glutamatergic neurons in sleep-wake regulation, associated physiological functions, and underlying neural circuits remain unclear. In the current study, using an optogenetic approach and synchronous polysomnographic recording, we demonstrated that selective activation of VTA glutamatergic neurons induced immediate transition from sleep to wakefulness and obviously increased the amount of wakefulness in mice. Furthermore, optogenetic activation of VTA glutamatergic neurons induced multiple defensive behaviors, including burrowing, fleeing, avoidance and hiding. Finally, viral-mediated anterograde activation revealed that projections from the VTA to the central nucleus of the amygdala (CeA) mediated the wake- and defense-promoting effects of VTA glutamatergic neurons. Collectively, our results illustrate that the glutamatergic VTA is a key neural substrate regulating wakefulness and defensive behaviors that controls these behaviors through its projection into the CeA. We further discuss the possibility that the glutamatergic VTA-CeA pathway may be involved in psychiatric diseases featuring with excessive defense.

Keywords: autism spectrum disorders; central nucleus of the amygdala; defensive behavior; sleep-wake behavior; ventral tegmental area.


Conflict of interest statement

The authors declare that the research was conducted in the absence of any commercial or financial relationships that could be construed as a potential conflict of interest.

Figures

FIGURE 1
FIGURE 1
Photoactivation of VTA glutamatergic neurons initiates and maintains wakefulness. (A) Schematic of AAV-EF1a-DIO-ChR2-mCherry expression in the VTA. (B) Representative fluorescent image showing restrictive expression of ChR2-mCherry in the VTA area. (C) Fluorescent images showing c-Fos expression in the VTA without (top) or with blue light stimulation. (D) Quantitative analyses of c-Fos expression (n = 4, 8 sections for each group. Two-tailed unpaired t-test; t6 = 15.50, P < 0.001). (E) Diagram of photostimulation of VTA glutamatergic neurons. (F) Heat maps showing the probability of NREM-Wake transition. (G) Latencies of NREM-Wake transition upon stimulation with different frequencies of light (n = 8 per group, paired t-test; Base, t7 = 1.187, P = 0.2741; 5 Hz, t7 = 90.60, P < 0.001; 10 Hz, t7 = 44.12, P < 0.001; 20 Hz, t7 = 397.1, P < 0.001; 40 Hz, t7 = 1200, P < 0.001). (H) Example of EEG/EMG traces showing the effects of light stimulation of VTA glutamatergic neurons on sleep–wake behaviors. (I) Time course change in sleep–wake behaviors during long-term photostimulation of VTA glutamatergic neurons during ZT 02:00–05:00 [n = 8, two-way repeated-measures ANOVA; wake F(1,14) = 51.74, P < 0.001; NREM F(1,14) = 50.06, P < 0.001; REM F(1,14) = 23.66, P < 0.001]. (J) Sleep and wake amount during 3-h long-term light stimulation (n = 8, paired t-test; wake t7 = 17.93, P < 0.001; NREM t7 = 15.98, P < 0.001; REM t7 = 11.47, P < 0.001). Data are expressed as the mean ± SEM. ***P < 0.001.
FIGURE 2
FIGURE 2
Photoactivation of VTA glutamatergic neurons promotes burrowing and fleeing behaviors. (A) Schematic of the home-cage test. (B) The total burrowing time upon stimulating VTA glutamatergic neurons in the home-cage test [n = 8 ChR2 vs. n = 8 mCherry; two-way repeated-measures ANOVA, virus × stimulation, F(1,14) = 76.38, P < 0.001, Bonferroni post hoc comparison]. (C) Examples of tracking traces of mice in open field tests. (D) Photostimulation of VTA glutamatergic neurons influenced total distance, mean speed and resting time in open field experiments [n = 8 ChR2 vs. n = 8 mCherry; two-way repeated-measures ANOVA, virus × stimulation, F(2,28) = 10.35, P = 0.004, F(2,28) = 9.747, P = 0.0006, F(2,28) = 13.70, P < 0.001, Bonferroni post hoc comparison]. Data are expressed as mean ± SEM. **P < 0.01, ***P < 0.001, n.s., not significant.
FIGURE 3
FIGURE 3
Photoactivation of VTA glutamatergic neurons promotes avoidance and hiding behavior. (A) Example trajectories of mice in RTPP tests. (B) Photostimulation of VTA glutamatergic neurons affected the time spent in the stimulation chamber and safe chamber entries of mice in the RTPP experiment [n = 8 ChR2 vs. n = 8 mCherry; two-way repeated-measures ANOVA, virus × stimulation, F(1,14) = 196.1, P < 0.001; F(1,14) = 27.82, P = 0.0001, Bonferroni post hoc comparison]. (C) Schematic of hiding box experiment. (D) Real-time probability of hiding upon stimulating glutamatergic VTA (n = 8 ChR2, n = 8 mCherry; Kaplan–Meier5 survival analysis with Bonferroni’s multiple comparison; Log rank = 80.77, P < 0.001, mCherry: 20 Hz-sham, P = 0.32; ChR2: 5 Hz-sham, P < 0.001; 10 Hz-sham, P < 0.001; 20 Hz-sham, P < 0.001). Data are represented as the mean ± SEM. **P < 0.01, ***P < 0.001, n.s., not significant.
FIGURE 4
FIGURE 4
Photoactivation of glutamatergic VTA-CeA pathway promotes defensive behaviors. (A) Schematic of AAV-EF1a-DIO-ChR2-mCherry expression in the VTA and fiber implantation in the CeA for photostimulation. (B) Fluorescent images showing glutamatergic ChR2-mCherry SOMA in the VTA (left) and terminals projecting to the CeA (right). Scale bar represents 200 and 100 μm. (C,D) c-Fos expression in the CeA without (top) or with (bottom) light stimulation. (n = 4, 8 sections for each group. two-tailed unpaired t-test; t6 = 8.817, P < 0.001). Scale bars represent 100 μm. (E) Burrowing duration upon stimulation of the glutamatergic VTA-CeA pathway in the home cage [n = 8 ChR2 vs. n = 8 mCherry; two-way repeated-measures ANOVA, virus × stimulation, F(1,14) = 31.26, P < 0.001, Bonferroni post hoc comparison]. (F) Examples of tracking traces of mice in open field tests. (G) Photostimulation of the glutamatergic VTA-CeA pathway influenced total distance, mean speed and resting time in open field experiments [n = 8 ChR2 vs. n = 8 mCherry; two-way repeated-measures ANOVA, virus × stimulation, F(2,28) = 6.727, P = 0.0041, F(2,28) = 6.716, P = 0.0041, F(2,28) = 4.442, P = 0.0211, Bonferroni post hoc comparison]. (H) Example trajectories of mice in RTPP tests. (I,J) Photostimulation of glutamatergic VTA-CeA pathway influenced the stimulation chamber staying time and safe chamber entries of mice in the RTPP experiment. [n = 8 ChR2 vs. n = 8 mCherry; two-way repeated-measures ANOVA, virus × stimulation, F(1,14) = 82.24, P < 0.001, F(1,14) = 5.211, P < 0.05, Bonferroni post hoc comparison]. (K) Real-time probability of hiding upon stimulating the glutamatergic VTA-CeA pathway (n = 8 ChR2, n = 8 mCherry; Kaplan–Meier survival analysis with Bonferroni’s multiple comparison; Log rank = 99.124, P < 0.001, mCherry: 20 Hz-sham, P = 0.96; ChR2: 5 Hz-sham, P < 0.001; 10 Hz-sham, P < 0.001; 20 Hz-sham, P < 0.001). Data are expressed as mean ± SEM. **P < 0.01, ***P < 0.001, n.s., not significant.
FIGURE 5
FIGURE 5
Photoactivation of the glutamatergic VTA-CeA pathway initiates and maintains wakefulness. (A) Diagram of in vivo photostimulation and EEG and EMG recording. (B) Heat maps showing the probability of wake transition upon yellow (top) or blue (bottom) light photostimulation during NREM sleep. (C) Latencies of NREM-Wake transitions under photostimulation at different frequencies (n = 8 per group, paired t-test; base, t7 = 1.517, P = 0.1730; 5 Hz, t7 = 32.96, P < 0.001; 10 Hz, t7 = 24.58, P < 0.001; 20 Hz, t7 = 53.77, P < 0.001; 40 Hz, t7 = 60.33, P < 0.001). (D) Example of EEG/EMG traces showing the effect of light stimulation of the glutamatergic VTA-CeA pathway on sleep–wake behaviors. (E) Time course change of sleep–wake behaviors during long-term photostimulation of the glutamatergic VTA-CeA pathway during ZT 02:00–03:00 [n = 8, two-way repeated-measures ANOVA; wake F(1,14) = 103.0, P < 0.001; NREM F(1,14) = 78.63, P < 0.001; REM F(1,14) = 8.604, P = 0.0109]. (F) Sleep and wake amount during ZT 02:00–03:00 light stimulation (n = 8, paired t-test; Wake t7 = 22.77, P < 0.001; NREM t7 = 27.37, P < 0.001; REM t7 = 6.615, P = 0.0003). Data are expressed as mean ± SEM. *P < 0.05, ***P < 0.001.

Similar articles

Cited by

References

    1. Barbano M. F., Wang H. L., Zhang S., Miranda-Barrientos J., Estrin D. J., Figueroa-Gonzalez A., et al. (2020). VTA glutamatergic neurons mediate innate defensive behaviors. Neuron 107 368–382.e8. 10.1016/j.neuron.2020.04.024 - DOI - PMC - PubMed
    1. Bariselli S., Hornberg H., Prevost-Solie C., Musardo S., Hatstatt-Burkle L., Scheiffele P., et al. (2018). Role of VTA dopamine neurons and neuroligin 3 in sociability traits related to nonfamiliar conspecific interaction. Nat. Commun. 9:3173. 10.1038/s41467-018-05382-3 - DOI - PMC - PubMed
    1. Beier K. T., Steinberg E. E., DeLoach K. E., Xie S., Miyamichi K., Schwarz L., et al. (2015). Circuit architecture of VTA dopamine neurons revealed by systematic input-output mapping. Cell 162 622–634. 10.1016/j.cell.2015.07.015 - DOI - PMC - PubMed
    1. Blanchard R. J., Blanchard D. C. (1989). Antipredator defensive behaviors in a visible burrow system. J. Comp. Psychol. 103 70–82. 10.1037/0735-7036.103.1.70 - DOI - PubMed
    1. Cai P., Chen H. Y., Tang W. T., Hu Y. D., Chen S. Y., Lu J. S., et al. (2022). A glutamatergic basal forebrain to midbrain circuit mediates wakefulness and defensive behavior. Neuropharmacology 208:108979. 10.1016/j.neuropharm.2022.108979 - DOI - PubMed

LinkOut - more resources