

A novel n-type CdS nanorods/p-type LaFeO3 heterojunction nanocomposite with enhanced visible-light photocatalytic performance
- PMID: 35527888
- PMCID: PMC9069809
- DOI: 10.1039/c9ra04265b
A novel n-type CdS nanorods/p-type LaFeO3 heterojunction nanocomposite with enhanced visible-light photocatalytic performance
Abstract
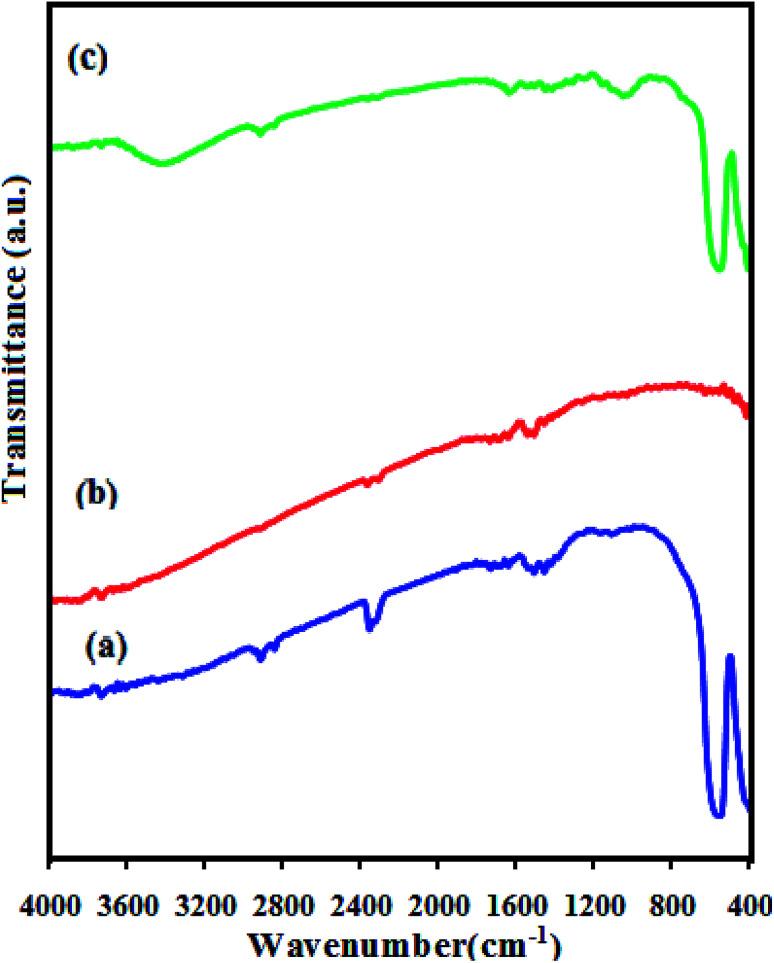
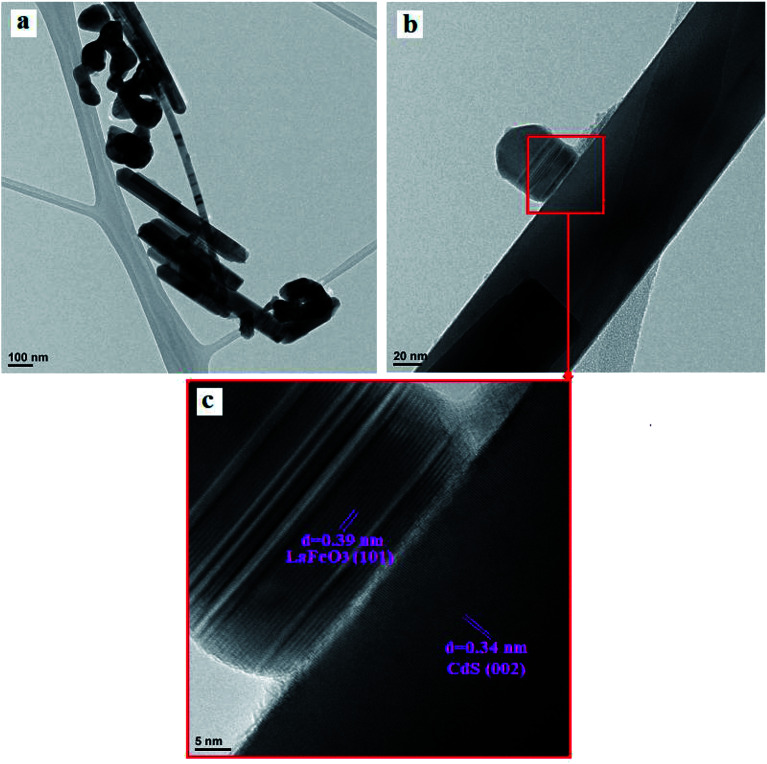
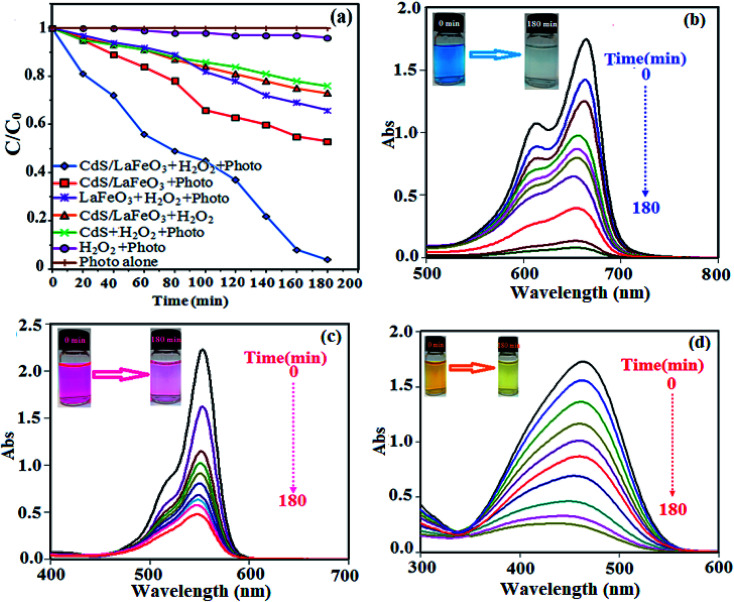
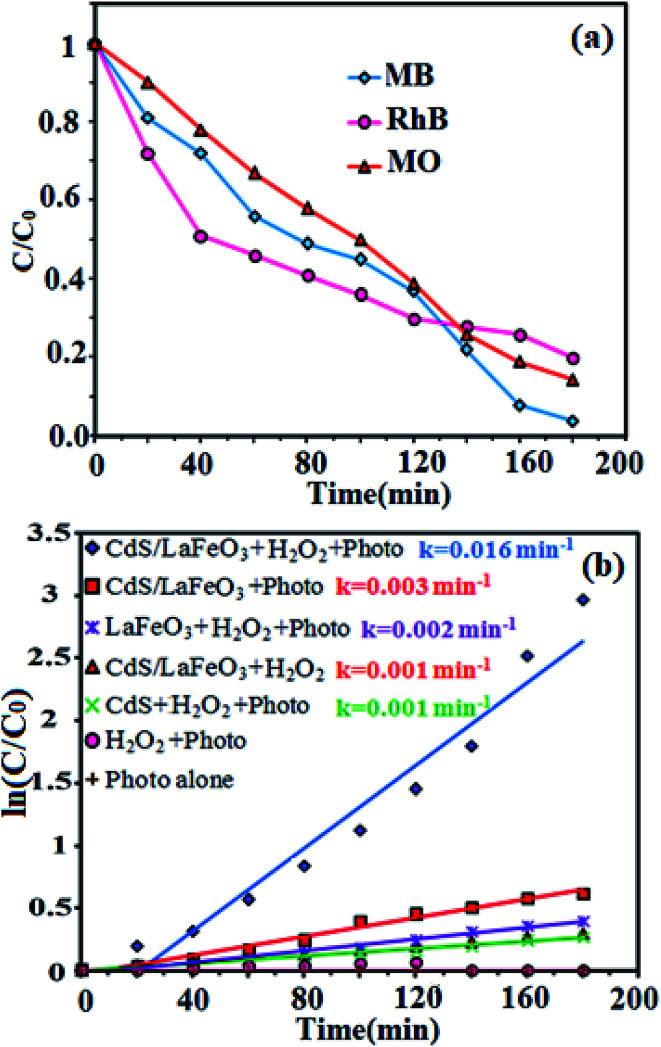
In this work, a novel n-type CdS nanorods/p-type LaFeO3 (CdS NRs/LFO) nanocomposite was prepared, for the first time, via a facile solvothermal method. The as-prepared n-CdS NRs/p-LFO nanocomposite was characterized by using powder X-ray diffraction (XRD), Fourier transform infrared spectroscopy (FT-IR), X-ray photoelectron spectroscopy (XPS), scanning electron microscopy (SEM), high-resolution transmission electron microscopy (HR-TEM), energy-dispersive X-ray spectroscopy (EDX), UV-visible diffuse reflection spectroscopy (DRS), vibrating sample magnetometry (VSM), photoluminescence (PL) spectroscopy, and Brunauer-Emmett-Teller (BET) surface area analysis. All data revealed the attachment of the LFO nanoparticle on the surface of CdS NRs. This novel nanocomposite was applied as a novel visible light photocatalyst for the degradation of methylene blue (MB), rhodamine B (RhB) and methyl orange (MO) dyes under visible-light irradiation. Under optimized conditions, the degradation efficiency was 97.5% for MB, 80% for RhB and 85% for MO in the presence of H2O2 and over CdS NRs/LFO nanocomposite. The photocatalytic activity of CdS NRs/LFO was almost 16 and 8 times as high as those of the pristine CdS NRs and pure LFO, respectively. The photocatalytic activity was enhanced mainly due to the high efficiency in separation of electron-hole pairs induced by the remarkable synergistic effects of CdS and LFO semiconductors. After the photocatalytic reaction, the nanocomposite can be easily separated from the reaction solution and reused several times without loss of its photocatalytic activity. Trapping experiments indicated that ·OH radicals were the main reactive species for dye degradation in the present photocatalytic system. On the basis of the experimental results and estimated energy band positions, the mechanism for the enhanced photocatalytic activity was proposed.
This journal is © The Royal Society of Chemistry.
Conflict of interest statement
There are no conflicts of interest to declare.
Figures


Similar articles
-
A magnetically separable plate-like cadmium titanate-copper ferrite nanocomposite with enhanced visible-light photocatalytic degradation performance for organic contaminants.RSC Adv. 2019 May 17;9(27):15615-15628. doi: 10.1039/c9ra01968e. eCollection 2019 May 14. RSC Adv. 2019. PMID: 35514850 Free PMC article.
-
Facile synthesis of CuO/CdS heterostructure photocatalyst for the effective degradation of dye under visible light.Environ Res. 2020 Sep;188:109803. doi: 10.1016/j.envres.2020.109803. Epub 2020 Jun 16. Environ Res. 2020. PMID: 32590149
-
Fabrication of SrTiO3 anchored rGO/g-C3N4 photocatalyst for the removal of mixed dye from wastewater: dual photocatalytic mechanism.Sci Rep. 2024 Jul 15;14(1):16259. doi: 10.1038/s41598-024-66844-x. Sci Rep. 2024. PMID: 39009639 Free PMC article.
-
Solar driven highly efficient photocatalyst based on Dy2O3 nanorods deposited on reduced graphene oxide nanocomposite for methylene blue dye degradation.Environ Sci Pollut Res Int. 2024 Oct;31(50):60260-60278. doi: 10.1007/s11356-024-35226-1. Epub 2024 Oct 8. Environ Sci Pollut Res Int. 2024. PMID: 39377909
-
A facile synthesis process of GCN/ZnO-Cu nanocomposite and the evaluation of the performance for the photocatalytic degradation of organic pollutants and the disinfection of wastewater under visible light.Chemosphere. 2023 Dec;344:140287. doi: 10.1016/j.chemosphere.2023.140287. Epub 2023 Oct 10. Chemosphere. 2023. PMID: 37820879 Review.
Cited by
-
Construction of magnetic MgFe2O4/CdS/MoS2 ternary nanocomposite supported on NaY zeolite and highly efficient sonocatalytic degradation of organic pollutants.RSC Adv. 2020 Dec 11;10(72):44034-44049. doi: 10.1039/d0ra08831e. eCollection 2020 Dec 9. RSC Adv. 2020. PMID: 35517154 Free PMC article.
-
Charge Steering in Heterojunction Photocatalysis: General Principles, Design, Construction, and Challenges.Small Sci. 2023 Jan 4;3(3):2200041. doi: 10.1002/smsc.202200041. eCollection 2023 Mar. Small Sci. 2023. PMID: 40212059 Free PMC article.
-
Solar-light-driven LaFe x Ni1- x O3 perovskite oxides for photocatalytic Fenton-like reaction to degrade organic pollutants.Beilstein J Nanotechnol. 2022 Sep 5;13:882-895. doi: 10.3762/bjnano.13.79. eCollection 2022. Beilstein J Nanotechnol. 2022. PMID: 36127897 Free PMC article.
-
A novel CoFe2O4@Cr-MIL-101/Y zeolite ternary nanocomposite as a magnetically separable sonocatalyst for efficient sonodegradation of organic dye contaminants from water.RSC Adv. 2020 Mar 9;10(17):10082-10096. doi: 10.1039/d0ra00877j. eCollection 2020 Mar 6. RSC Adv. 2020. PMID: 35498565 Free PMC article.
-
An organic-inorganic hybrid nanomaterial composed of a Dowson-type (NH4)6P2Mo18O62 heteropolyanion and a metal-organic framework: synthesis, characterization, and application as an effective adsorbent for the removal of organic dyes.RSC Adv. 2020 Nov 2;10(66):40005-40018. doi: 10.1039/d0ra07042d. eCollection 2020 Nov 2. RSC Adv. 2020. PMID: 35520823 Free PMC article.
References
LinkOut - more resources
Full Text Sources
Miscellaneous