

A comparative study of different electrodeposited NiCo2O4 microspheres anchored on a reduced graphene oxide platform: electrochemical sensor for anti-depressant drug venlafaxine
- PMID: 35527939
- PMCID: PMC9072688
- DOI: 10.1039/c9ra04999a
A comparative study of different electrodeposited NiCo2O4 microspheres anchored on a reduced graphene oxide platform: electrochemical sensor for anti-depressant drug venlafaxine
Abstract
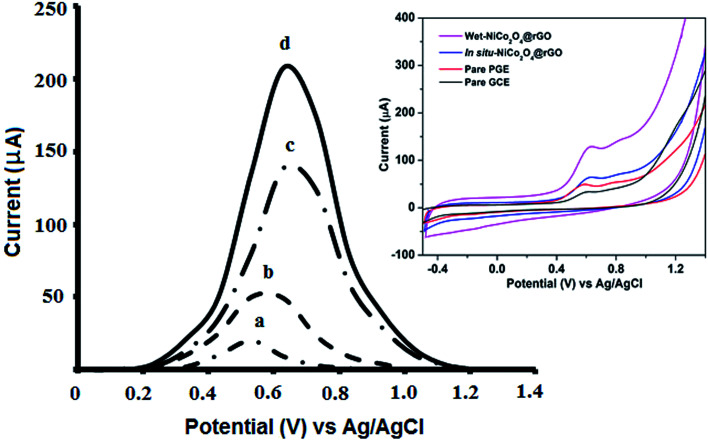
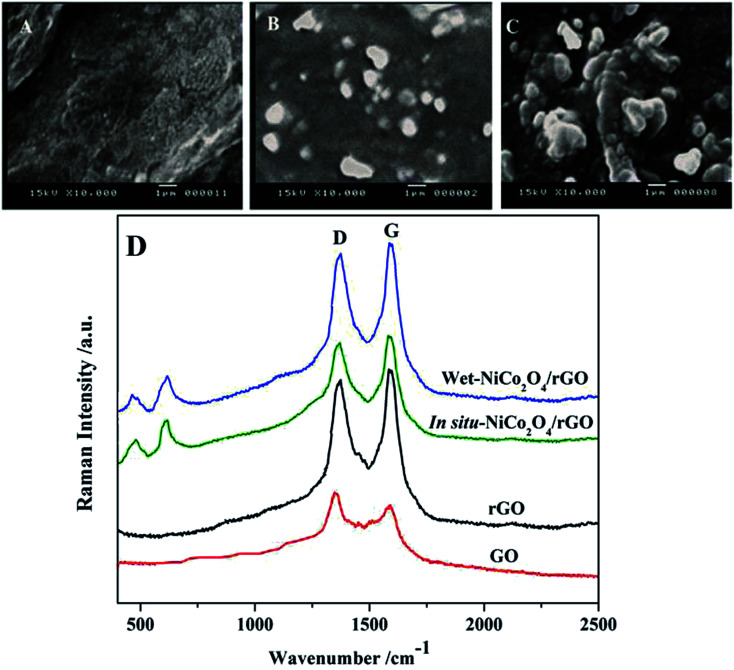
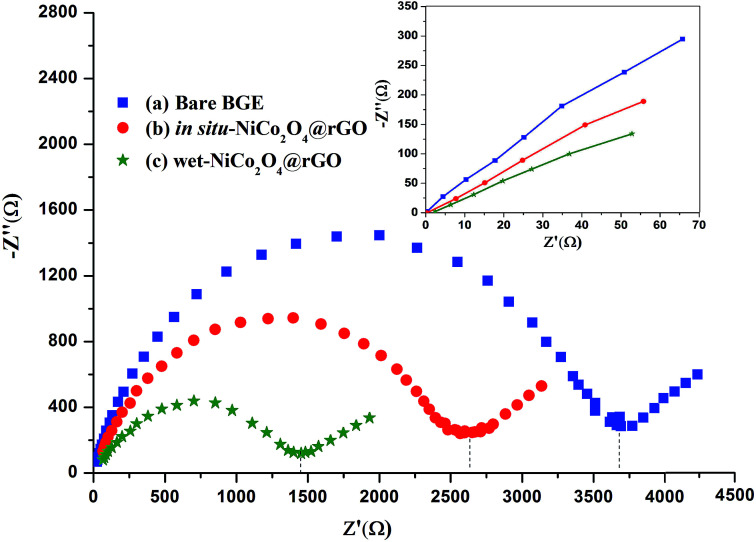
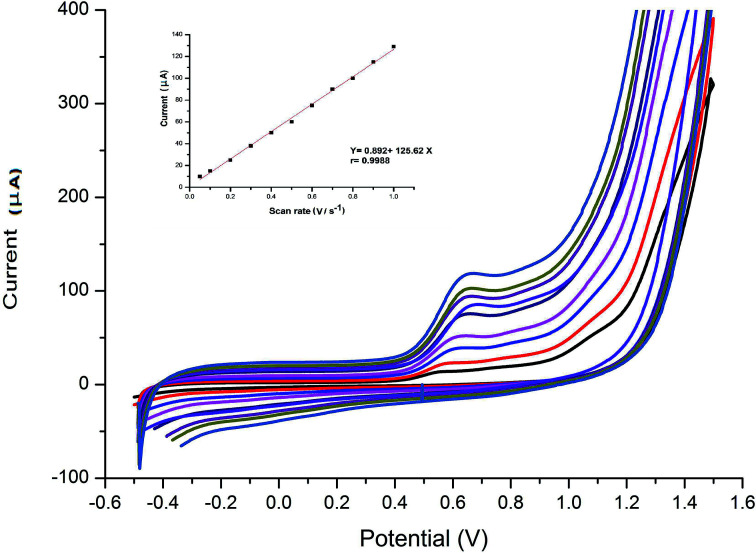
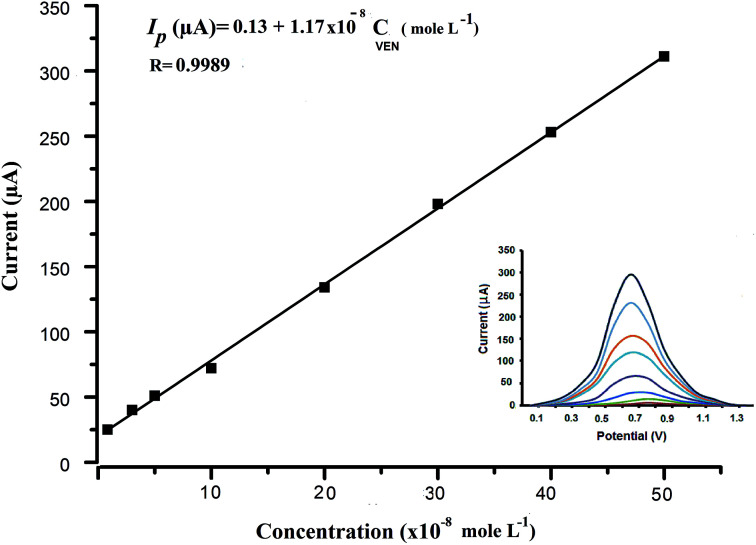
Two different fabrication methods were performed and compared for preparation of binary metallic oxide microstructures supported on a reduced graphene oxide (rGO) modified graphite electrode. Nickel-Cobalt oxide microspheres (NiCo2O4 MSs) were prepared by two different deposition methods: wet chemical and in situ-electrical deposited methods. Different characterization methods were conducted, including cyclic voltammetry (CV), scanning emission microscopy (SEM), electrochemical impedance spectroscopy (EIS) and Raman spectroscopy. The deposition methods of NiCo2O4 MSs were found to affect the electrochemical behavior of the modified electrodes towards the oxidation of venlafaxine (VEN), an anti-depressant drug. The fabricated electrode showed linearity over the range 5-500 nmol L-1 and an excellent sensitivity with a limit of detection (LOD) and limit of quantitation (LOQ) of 3.4 and 10.3 nmol L-1, respectively. It was revealed that the wet-NiCo2O4@rGO modified electrode prepared by the wet chemical method showed an improved electrochemical behavior for determination of VEN in pharmaceuticals and human plasma with high recovery results in the range of 96.7-98.6% and 96.0-100.7%, respectively without any interference from the co-existing components.
This journal is © The Royal Society of Chemistry.
Conflict of interest statement
The authors declare that there is no conflict of interest.
Figures
Similar articles
-
Mesoporous NiCo2O4-decorated reduced graphene oxide as a novel platform for electrochemical determination of rutin.Talanta. 2017 Mar 1;164:291-299. doi: 10.1016/j.talanta.2016.10.109. Epub 2016 Nov 16. Talanta. 2017. PMID: 28107932
-
RGO decorated N-doped NiCo2O4 hollow microspheres onto activated carbon cloth for high-performance non-enzymatic electrochemical glucose detection.Heliyon. 2023 Jun 12;9(6):e17200. doi: 10.1016/j.heliyon.2023.e17200. eCollection 2023 Jun. Heliyon. 2023. PMID: 37360103 Free PMC article.
-
Fabrication of RGO-NiCo2O4 nanorods composite from deep eutectic solvents for nonenzymatic amperometric sensing of glucose.Talanta. 2018 Aug 1;185:335-343. doi: 10.1016/j.talanta.2018.03.097. Epub 2018 Mar 30. Talanta. 2018. PMID: 29759209
-
N-Doped Reduced Graphene Oxide/Gold Nanoparticles Composite as an Improved Sensing Platform for Simultaneous Detection of Dopamine, Ascorbic Acid, and Uric Acid.Sensors (Basel). 2020 Aug 7;20(16):4427. doi: 10.3390/s20164427. Sensors (Basel). 2020. PMID: 32784787 Free PMC article.
-
Electrochemical sensor for Isoniazid based on the glassy carbon electrode modified with reduced graphene oxide-Au nanomaterials.Mater Sci Eng C Mater Biol Appl. 2015 Dec 1;57:197-204. doi: 10.1016/j.msec.2015.07.045. Epub 2015 Jul 27. Mater Sci Eng C Mater Biol Appl. 2015. PMID: 26354255
Cited by
-
A rational study of transduction mechanisms of different materials for all solid contact-ISEs.Sci Rep. 2024 Mar 5;14(1):5405. doi: 10.1038/s41598-024-55729-8. Sci Rep. 2024. PMID: 38443429 Free PMC article.
-
An Innovative Polymer-Based Electrochemical Sensor Encrusted with Tb Nanoparticles for the Detection of Favipiravir: A Potential Antiviral Drug for the Treatment of COVID-19.Biosensors (Basel). 2023 Feb 8;13(2):243. doi: 10.3390/bios13020243. Biosensors (Basel). 2023. PMID: 36832009 Free PMC article.
-
Electrochemical Chemically Based Sensors and Emerging Enzymatic Biosensors for Antidepressant Drug Detection: A Review.Int J Mol Sci. 2023 May 9;24(10):8480. doi: 10.3390/ijms24108480. Int J Mol Sci. 2023. PMID: 37239826 Free PMC article. Review.
-
NiFe-based Prussian blue analogue nanopolygons hybridized with functionalized glyoxal polymer as a voltammetric platform for the determination of amisulpride in biological samples.Anal Bioanal Chem. 2023 Mar;415(8):1559-1570. doi: 10.1007/s00216-023-04559-0. Epub 2023 Feb 21. Anal Bioanal Chem. 2023. PMID: 36807994 Free PMC article.
-
Recent Advances in the Electrochemical Sensing of Venlafaxine: An Antidepressant Drug and Environmental Contaminant.Sensors (Basel). 2020 Jun 30;20(13):3675. doi: 10.3390/s20133675. Sensors (Basel). 2020. PMID: 32630056 Free PMC article. Review.
References
-
- Peikova L. Pencheva I. Maslarska V. Pharmacia. 2013;60:12.
LinkOut - more resources
Full Text Sources