. 2022 Apr 21:13:859817.
doi: 10.3389/fendo.2022.859817. eCollection 2022.

Neuroendocrine Regulation of Plasma Cortisol Levels During Smoltification and Seawater Acclimation of Atlantic Salmon

Affiliations

Neuroendocrine Regulation of Plasma Cortisol Levels During Smoltification and Seawater Acclimation of Atlantic Salmon

Brett M Culbert et al. Front Endocrinol (Lausanne). .

Abstract

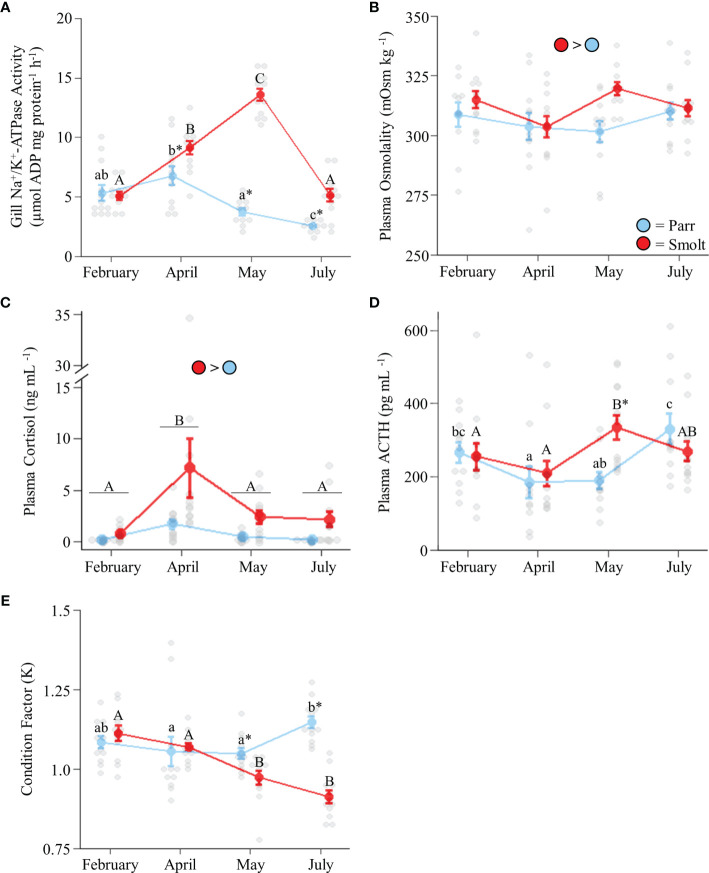
Diadromous fishes undergo dramatic changes in osmoregulatory capacity in preparation for migration between freshwater and seawater. One of the primary hormones involved in coordinating these changes is the glucocorticoid hormone, cortisol. In Atlantic salmon (Salmo salar), cortisol levels increase during the spring smoltification period prior to seawater migration; however, the neuroendocrine factors responsible for regulating the hypothalamic-pituitary-interrenal (HPI) axis and plasma cortisol levels during smoltification remain unclear. Therefore, we evaluated seasonal changes in circulating levels of cortisol and its primary secretagogue-adrenocorticotropic hormone (ACTH)-as well as transcript abundance of the major regulators of HPI axis activity in the preoptic area, hypothalamus, and pituitary between migratory smolts and pre-migratory parr. Smolts exhibited higher plasma cortisol levels compared to parr across all timepoints but circulating ACTH levels were only elevated in May. Transcript abundance of preoptic area corticotropin-releasing factor b1 and arginine vasotocin were ~2-fold higher in smolts compared to parr in February through May. Smolts also had ~7-fold greater hypothalamic transcript abundance of urotensin 1 (uts-1a) compared to parr in May through July. When transferred to seawater during peak smolting in May smolts rapidly upregulated hypothalamic uts-1a transcript levels within 24 h, while parr only transiently upregulated uts-1a 96 h post-transfer. In situ hybridization revealed that uts-1a is highly abundant in the lateral tuberal nucleus (NLT) of the hypothalamus, consistent with a role in regulating the HPI axis. Overall, our results highlight the complex, multifactorial regulation of cortisol and provide novel insight into the neuroendocrine mechanisms controlling osmoregulation in teleosts.

Keywords: Salmo salar; adrenocorticotropic hormone; arginine vasotocin; corticotropin-releasing factor; cortisol; urotensin 1.


Conflict of interest statement

The authors declare that the research was conducted in the absence of any commercial or financial relationships that could be construed as a potential conflict of interest.

Figures

Figure 1
Figure 1
Seasonal changes in gill Na+/K+-ATPase activity (A); plasma osmolality (B), cortisol levels (C), and adrenocorticotropic hormone levels (ACTH; D); and condition factor (E) in Atlantic salmon (Salmo salar). Parr are depicted in blue and smolts in red. Significant differences (p < 0.05) are depicted using either letters (across time; uppercase = within smolts, lowercase = within parr, underlined uppercase = overall time effect), filled oversized circles (between groups across all timepoints) or asterisks (between groups within a timepoint). Values are represented as means ± SEM and individual data points are shown. Parr and smolts were sampled on the same day for each timepoint, but data are offset for presentation purposes.
Figure 2
Figure 2
Seasonal changes in transcript abundance of corticotropin-releasing factor b1 (crf-b1; A) and b2 (crf-b2; B); urotensin 1a (uts-1a; C) and 1b (uts-1b; D); corticotropin-releasing factor a1 (crf-a1; E) and a2 (crf-a2; F); and arginine vasotocin (avt; G) in the preoptic area (POA) of Atlantic salmon (Salmo salar). Parr are depicted in blue and smolts in red. Significant differences (p < 0.05) are depicted using either letters (across time; uppercase = within smolts, underlined uppercase = overall time effect), filled oversized circles (between groups across all timepoints) or asterisks (between groups within a timepoint). Data are expressed relative to parr in February. Values are represented as means ± SEM and individual data points are shown. Parr and smolts were sampled on the same day for each timepoint, but data are offset for presentation purposes. n.s., no significant differences detected.
Figure 3
Figure 3
Seasonal changes in transcript abundance of corticotropin-releasing factor b1 (crf-b1; A) and b2 (crf-b2; B); urotensin 1a (uts-1a; C) and 1b (uts-1b; D); and corticotropin-releasing factor a1 (crf-a1; E) and a2 (crf-a2; F) in the hypothalamus (HYP) of Atlantic salmon (Salmo salar). Parr are depicted in blue and smolts in red. Significant differences (p < 0.05) are depicted using either letters (across time; uppercase = within smolts, lowercase = within parr) or asterisks (between groups within a timepoint). Data are expressed relative to parr in February. Values are represented as means ± SEM and individual data points are shown. Parr and smolts were sampled on the same day for each timepoint, but data are offset for presentation purposes.
Figure 4
Figure 4
Seasonal changes in transcript abundance of corticotropin-releasing factor receptor 1a (crf-r1a; A) and 1b (crf-r1b; B); arginine vasotocin receptor v1a2 (avtr-v1a2; C); proopiomelanocortin a1 (pomc-a1; D), a2 (pomc-a2; E), and b (pomc-b; F); and prohormone convertase 1 (pc1; G) and 2 (pc2; H) in the pituitary (PIT) of Atlantic salmon (Salmo salar). Parr are depicted in blue and smolts in red. Significant differences (p < 0.05) are depicted using either letters (across time; uppercase = within smolts, underlined uppercase = overall time effect) or asterisks (between groups within a timepoint). Data are expressed relative to parr in February. Values are represented as means ± SEM and individual data points are shown. Parr and smolts were sampled on the same day for each timepoint, but data are offset for presentation purposes. n.s, no significant differences detected.
Figure 5
Figure 5
Effects of seawater exposure on gill Na+/K+-ATPase activity (A); and plasma osmolality (B), cortisol levels (C), and adrenocorticotropic hormone levels (ACTH; D) in Atlantic salmon (Salmo salar). Parr are depicted in blue and smolts in red. Significant differences (p < 0.05) are depicted using either letters (across time; uppercase = within smolts, lowercase = within parr) or asterisks (between groups within a timepoint). Time 0h values are in freshwater, all others after exposure to 28 ppt seawater. Values are represented as means ± SEM and individual data points are shown. Parr and smolts were sampled on the same day for each timepoint, but data are offset for presentation purposes.
Figure 6
Figure 6
Effects of seawater exposure on transcript abundance of corticotropin-releasing factor b1 (crf-b1; A) and b2 (crf-b2; B); urotensin 1a (uts-1a; C) and 1b (uts-1b; D); corticotropin-releasing factor a1 (crf-a1; E) and a2 (crf-a2; F); and arginine vasotocin (avt; G) in the preoptic area (POA) of Atlantic salmon (Salmo salar). Parr are depicted in blue and smolts in red. Significant differences (p < 0.05) are depicted using either letters (across time; underlined uppercase = overall time effect), filled oversized circles (between groups across all timepoints). Time 0h values are in freshwater, all others after exposure to 28 ppt seawater. Data are expressed relative to parr at 0h. Values are represented as means ± SEM and individual data points are shown. Parr and smolts were sampled on the same day for each timepoint, but data are offset for presentation purposes. n.s., no significant differences detected.
Figure 7
Figure 7
Effects of seawater exposure on transcript abundance of corticotropin-releasing factor b1 (crf-b1; A) and b2 (crf-b2; B); urotensin 1a (uts-1a; C) and 1b (uts-1b; D); and corticotropin-releasing factor a1 (crf-a1; E) and a2 (crf-a2; F) in the hypothalamus (HYP) of Atlantic salmon (Salmo salar). Parr are depicted in blue and smolts in red. Significant differences (p < 0.05) are depicted using either letters (across time; uppercase = within smolts, lowercase = within parr, underlined uppercase = overall time effect), filled oversized circles (between groups overall) or asterisks (between groups within a timepoint). Time 0h values are in freshwater, all others after exposure to 28 ppt seawater. Data are expressed relative to parr at 0h. Values are represented as means ± SEM and individual data points are shown. Parr and smolts were sampled on the same day for each timepoint, but data are offset for presentation purposes. n.s., no significant differences detected.
Figure 8
Figure 8
Effects of seawater exposure on transcript abundance of corticotropin-releasing factor receptor 1a (crf-r1a; A) and 1b (crf-r1b; B); arginine vasotocin receptor v1a2 (avtr-v1a2; C); proopiomelanocortin a1 (pomc-a1; D), a2 (pomc-a2; E), and b (pomc-b; F); and prohormone convertase 1 (pc1; G) and 2 (pc2; H) in the pituitary (PIT) of Atlantic salmon (Salmo salar). Parr are depicted in blue and smolts in red. Significant differences (p < 0.05) are depicted using either letters (across time; uppercase = within smolts, lowercase = within parr, underlined uppercase = overall time effect), filled oversized circles (between groups overall) or asterisks (between groups within a timepoint). Time 0h values are in freshwater, all others after exposure to 28 ppt seawater. Data are expressed relative to parr at 0h. Values are represented as means ± SEM and individual data points are shown. Parr and smolts were sampled on the same day for each timepoint, but data are offset for presentation purposes. n.s., no significant differences detected.
Figure 9
Figure 9
Urotensin 1a (uts-1a) mRNA localization in the diencephalon of Atlantic salmon (Salmo salar) as determined by in situ hybridization. (A) Symmetrical staining was observed in the lateral tuberal nucleus (NLT) on both sides of the infundibulum above the pituitary (PIT). (B) Positive staining was also observed above the infundibulum in the posterior tuberal nucleus (NPT). Scattered cells expressing uts-1a were observed along the third ventricle at the margin between the dorsolateral thalamic nuclei (NDL) and the magnocellular region of the preoptic nucleus (Pm; C), beside the infundibulum in the anterior tuberal nucleus (NAT; D), and in the nuclei beside the lateral recess (NRL; E). Adjacent sections that were Nissl stained with cresyl violet are included beside each in situ image (indicated with a ′) and a diagram of the brain showing the sagittal sectioning level for each image is included at the bottom of the figure. Scale bars = 100 µm.
Figure 10
Figure 10
Proposed hypophysiotropic regulation of the HPI axis during smoltification of Atlantic salmon (Salmo salar). The HPI axis appears to be consistently stimulated (solid line) by AVT and CRF-b1 neurons in the preoptic area throughout late winter and spring, whereas UTS-1a neurons in the hypothalamus are progressively activated (dashed line) during smoltification. Note that the proposed mechanism is based on transcriptional changes that do not necessarily reflect changes in peptide synthesis and/or release. Additionally, the actions of these neuropeptides are diverse, and the observed changes are therefore unlikely to be limited to regulating cortisol levels. ACTH, adrenocorticotrophic hormone; AVT, arginine vasotocin; CRF-b1, corticotropin-releasing factor b1; HPI, hypothalamic-pituitary-interrenal; UTS-1a, urotensin 1a.

Similar articles

Cited by

References

    1. Zydlewski J, Wilkie MP. “Freshwater to Seawater Transitions in Migratory Fishes”. In: Euryhaline Fishes. Oxford, UK: Academic Press; (2012). p. 253–326. doi: 10.1016/B978-0-12-396951-4.00006-2 - DOI
    1. Shrimpton JM. “Seawater to Freshwater Transitions in Diadromous Fishes,”. In: Euryhaline Fishes. Oxford, UK: Academic Press; (2012). p. 327–93. doi: 10.1016/B978-0-12-396951-4.00007-4 - DOI
    1. Larsen EH, Deaton LE, Onken H, O’Donnell M, Grosell M, Dantzler WH, et al. . Osmoregulation and Excretion. Compr Physiol (2014) 4:405–573. doi: 10.1002/cphy.c130004 - DOI - PubMed
    1. Kültz D. Physiological Mechanisms Used by Fish to Cope With Salinity Stress. J Exp Biol (2015) 218:1907–14. doi: 10.1242/jeb.118695 - DOI - PubMed
    1. Takei Y, Loretz CA. “The Gastrointestinal Tract as an Endocrine/Neuroendocrine/Paracrine Organ: Organization, Chemical Messengers and Physiological Targets”. In: The Multifunctional Gut of Fish. London, UK: Academic Press; (2010). p. 261–317. doi: 10.1016/S1546-5098(10)03007-4 - DOI

LinkOut - more resources