. 2021 Oct;1(1):1-16.
doi: 10.1158/2767-9764.crc-21-0022. Epub 2021 Oct 13.

The Genetic Landscape of Ocular Adnexa MALT Lymphoma Reveals Frequent Aberrations in NFAT and MEF2B Signaling Pathways

Affiliations

The Genetic Landscape of Ocular Adnexa MALT Lymphoma Reveals Frequent Aberrations in NFAT and MEF2B Signaling Pathways

Marco Magistri et al. Cancer Res Commun. 2021 Oct.

Erratum in

Abstract

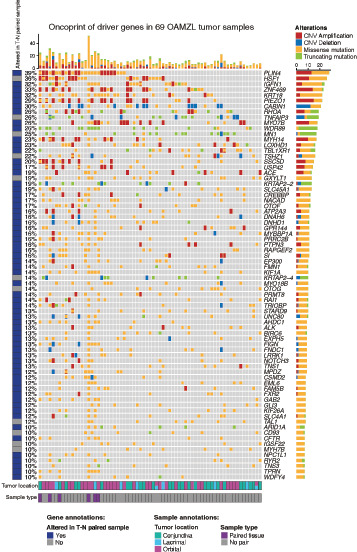
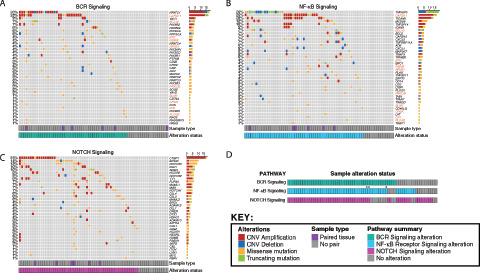
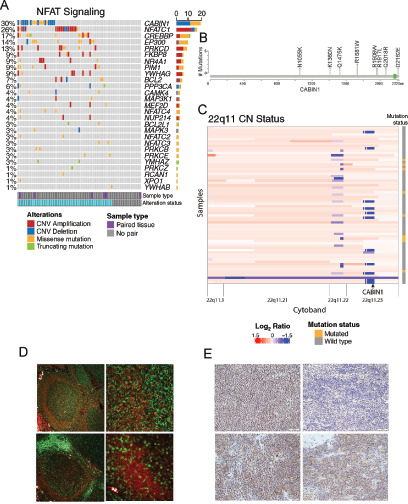
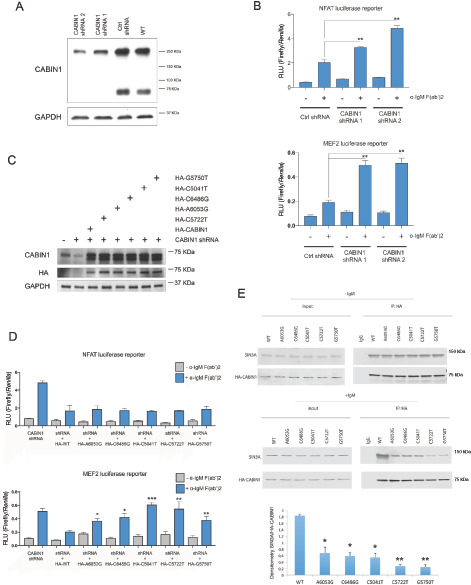
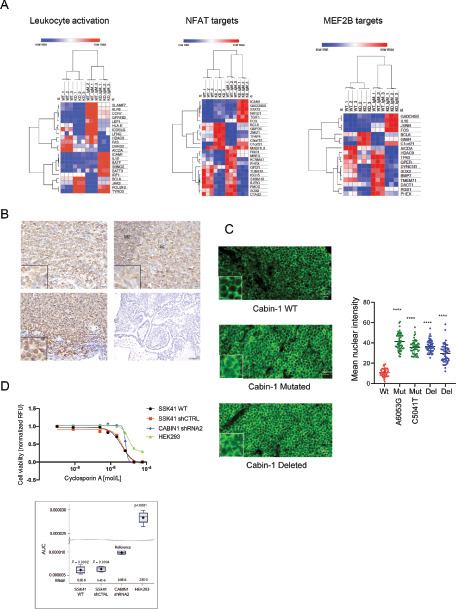
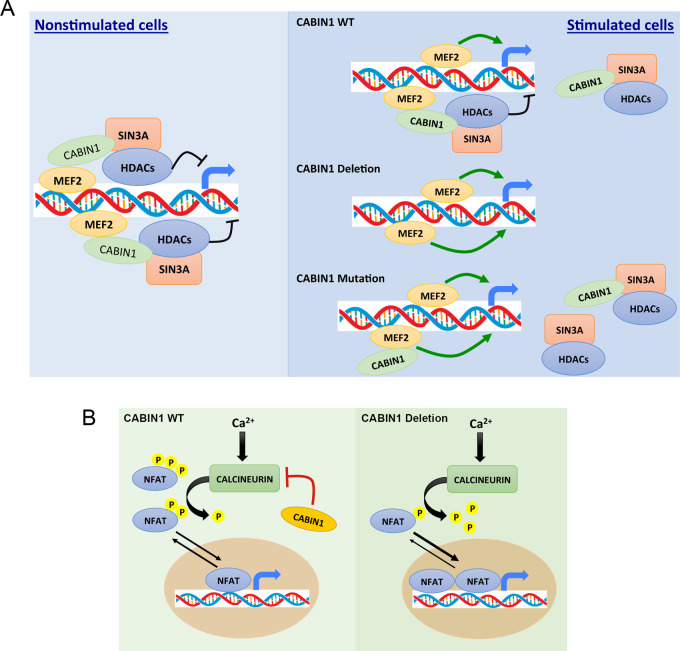
A comprehensive constellation of somatic non-silent mutations and copy number (CN) variations in ocular adnexa marginal zone lymphoma (OAMZL) is unknown. By utilizing whole-exome sequencing in 69 tumors we define the genetic landscape of OAMZL. Mutations and CN changes in CABIN1 (30%), RHOA (26%), TBL1XR1 (22%), and CREBBP (17%) and inactivation of TNFAIP3 (26%) were among the most common aberrations. Candidate cancer driver genes cluster in the B-cell receptor (BCR), NFkB, NOTCH and NFAT signaling pathways. One of the most commonly altered genes is CABIN1, a calcineurin inhibitor acting as a negative regulator of the NFAT and MEF2B transcriptional activity. CABIN1 deletions enhance BCR-stimulated NFAT and MEF2B transcriptional activity, while CABIN1 mutations enhance only MEF2B transcriptional activity by impairing binding of mSin3a to CABIN1. Our data provide an unbiased identification of genetically altered genes that may play a role in the molecular pathogenesis of OAMZL and serve as therapeutic targets.

Keywords: CABIN1; MEF2B; Marginal zone lymphoma; NFAT; Orbital adnexa lymphoma.


Conflict of interest statement

DISCLOSURE OF CONFLICTS OF INTEREST The authors declare no conflicts of interest related to this study

Figures

FIGURE 1
FIGURE 1
Genetic landscape of OAMZL. An oncoprint showing the mutation and CNV status for the 74 most recurrently altered genes in 69 OAMZL tumors with frequency ≥10%. Each alteration type is color coded, as indicated in the figure. Each column corresponds to one sample and includes annotations at the bottom identifying anatomic tumor location as well as those samples with paired normal tissue. Genes are represented in the rows and are annotated on the basis of whether any reported mutations are identified in at least one of the tumor sample with paired normal tissue by Mutect. In addition, we report the frequency of mutations per gene, number and composition of mutation type per gene, and number and composition of mutation type per sample.
FIGURE 2
FIGURE 2
Characterization of mutational processes. A, Heat map showing the contribution of each of the 47 COSMIC mutation signatures to each individual tumor. B, Number (top) and proportion (bottom) of mutations in each tumor that are attributed to the top 12 most prevalent signatures. C, Relative enrichment of the top 12 most prevalent signatures in the 20 most recurrently mutated genes.
FIGURE 3
FIGURE 3
Oncoprints showing alterations occurring at any frequency in OAMZL tumors in genes belonging to MZ development pathways. A, BCR signaling. B, NF-κB signaling. Genes marked in red in A and B are found in both the BCR and NF-κB signaling pathways. C, NOTCH signaling. Columns correspond to individual patients while genes and their alteration frequency are listed in rows. D, Cooccurrence of genetic alterations of BCR, NF-κB, and NOTCH signaling pathways in individual tumors. Samples that are exclusively altered in the same set of genes shared by BCR and NF-κB signaling pathways are marked with asterisks. The color code for each type of alteration is illustrated in the figure key.
FIGURE 4
FIGURE 4
CABIN1 alterations and expression. A, Oncoprint showing alterations occurring across genes in the NFAT signaling pathway. Columns correspond to patients while genes are listed in rows. B, Lollipop plot showing the somatic nonsilent mutations found in CABIN1 gene with annotations of the amino acid changes. C, Heat map of CN status for cytoband 22q11 including the CABIN1 locus (annotated). Across this cytoband, segment colors vary from blue for strong CN losses to red for strong CN gains. Each row represents a sample, and each column represents a reported CN segment. Sample mutation status is noted to the right. D, Immunofluorescence expression analysis of CABIN1 (red), CD20 (green, top), and CD3 (green, bottom) in normal lymph node. Magnification: top and bottom left, 4×; top and bottom right, 40×. E, IHC analysis of CABIN1 expression in different MALT lymphomas (magnification all 20×). Top left, OAMZL with WT CABIN1; top right, OAMZL with CABIN1 CN losses; bottom left, parotid MZL; bottom right, lung MZL. White bars, 50 μm.
FIGURE 5
FIGURE 5
Effects of CABIN1 deletion and mutations on the NFAT and MEF2B transcriptional activities. A, Western blot analysis of CABIN1 expression in WT SSK41 cells or in SSK41 cells transduced with lentiviral vectors expressing either a control shRNA or CABIN1-specific shRNAs. The expression of the housekeeping gene GAPDH was used as a loading control. B, Luciferase reporter assay for NFAT (top) and MEF2 (bottom) transcriptional activity in SSK41 cells transduced with lentiviral vectors expressing either a control shRNA or CABIN1-specific shRNAs. Where indicated, cells were stimulated for 4 hours with α-IgM F(ab’)2. *, P = 0.001; **, P < 0.0002. C, Western blot analysis of CABIN1 expression in WT SSK41 cells or in SSK41 cells in which CABIN1 was initially knocked down using 3′-UTR targeting shRNA followed by expression of HA-tagged CABIN1 WT or mutants. CABIN1 was detected using anti-CABIN1 and anti-HA antibodies, while expression of the housekeeping gene GAPDH was used as a loading control. D, Luciferase reporter assay for NFAT (top) and MEF2 (bottom) transcriptional activity in SSK41 CABIN1 KD cells and cells expressing indicated CABIN1 constructs as shown in C. Where indicated, cells were stimulated for 4 hours with α-IgM F(ab’)2, in comparison to stimulated HA-WT: *, P < 0.005; **, P < 0.0001; ***, P = 0.00006. E, Representative immunoprecipitation (IP) assays with anti-HA antibodies using whole-cell protein extracts from unstimulated and α-IgM F(ab’)2–stimulated SSK141 cells expressing different CABIN1 mutants, as shown in C followed by Western blotting using indicated antibodies. Also shown mean and SD of relative SIN3A densitometry adjusted to immunoprecipitated CABIN1 in each cell type versus WT cells from three independent experiments. Statistical analyses of relative densitometry in mutants versus WT cells. *, P < 0.05; **, P < 0.01.
FIGURE 6
FIGURE 6
Effects of CABIN1 alterations on gene expression and NFAT activation. A, Heat maps showing FPKM values of genes that are differentially expressed in WT versus CABIN1 KD SSK41 cells after α-IgM F(ab’)2 stimulation. These genes are significantly enriched for leukocyte activation signature, NFAT and MAF2B targets. B, IHC analysis of NFAT expression and localization in OAMZL tumors with WT CABIN 1 (top left) and CABIN1 CN losses (bottom left). For control, NFAT antibody staining showed cytosolic expression in germinal center of normal lymph nodes (top right), while no staining detectable in the uterus (bottom right). Magnification: top left and right and bottom left, 40×; bottom right, 10×. Insets, 100×. C, NFATc1 (green) immunofluorescence in OAMZL tissue sections with WT and mutated CABIN1. Image analysis of mean nuclear fluorescence signal intensities were done using ImageJ software. ****, P < 0.0001. D, Cell viability assay of SSK41 WT, shRNA control, and CABIN1 KD cells treated for 72 hours with increasing concentrations of cyclosporin A. HEK293 cells are not sensitive to cyclosporin A and were used as control.
FIGURE 7
FIGURE 7
Schematic summary of effects of CABIN1 mutations and deletion on MEF2B (A) and NFAR (B) induced gene expression.

Similar articles

Cited by

References

    1. Chapuy B, Stewart C, Dunford AJ, Kim J, Kamburov A, Redd RA, et al. . Molecular subtypes of diffuse large B cell lymphoma are associated with distinct pathogenic mechanisms and outcomes. Nat Med 2018;24:679–90. - PMC - PubMed
    1. Spina V, Khiabanian H, Messina M, Monti S, Cascione L, Bruscaggin A, et al. . The genetics of nodal marginal zone lymphoma. Blood 2016;128:1362–73. - PMC - PubMed
    1. Reddy A, Zhang J, Davis NS, Moffitt AB, Love CL, Waldrop A, et al. . Genetic and functional drivers of diffuse large B cell lymphoma. Cell 2017;171:481–94. - PMC - PubMed
    1. Okosun J, Bodor C, Wang J, Araf S, Yang CY, Pan C, et al. . Integrated genomic analysis identifies recurrent mutations and evolution patterns driving the initiation and progression of follicular lymphoma. Nat Genet 2014;46:176–81. - PMC - PubMed
    1. Bea S, Valdes-Mas R, Navarro A, Salaverria I, Martin-Garcia D, Jares P, et al. . Landscape of somatic mutations and clonal evolution in mantle cell lymphoma. Proc Natl Acad Sci USA 2013;110:18250–5. - PMC - PubMed

Publication types

MeSH terms