. 2019 Sep 17;9(50):29368-29383.
doi: 10.1039/c9ra04388h. eCollection 2019 Sep 13.

Modulation of JNK-1/ β-catenin signaling by Lactobacillus casei, inulin and their combination in 1,2-dimethylhydrazine-induced colon cancer in mice

Affiliations

Modulation of JNK-1/ β-catenin signaling by Lactobacillus casei, inulin and their combination in 1,2-dimethylhydrazine-induced colon cancer in mice

Mohammed S Ali et al. RSC Adv. .

Abstract

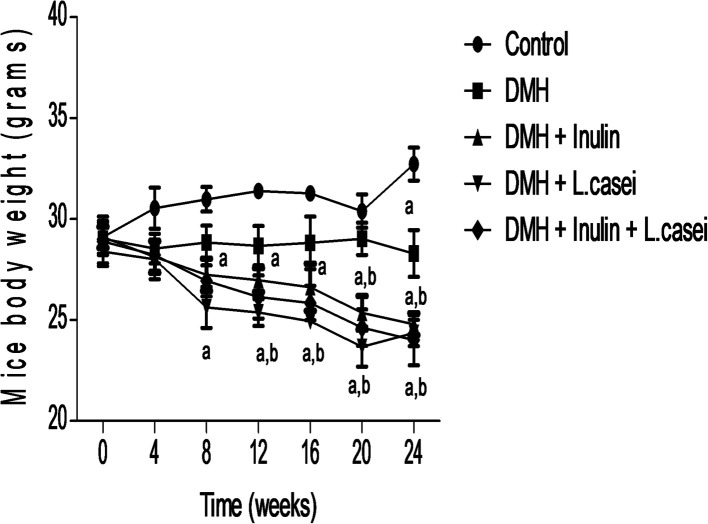
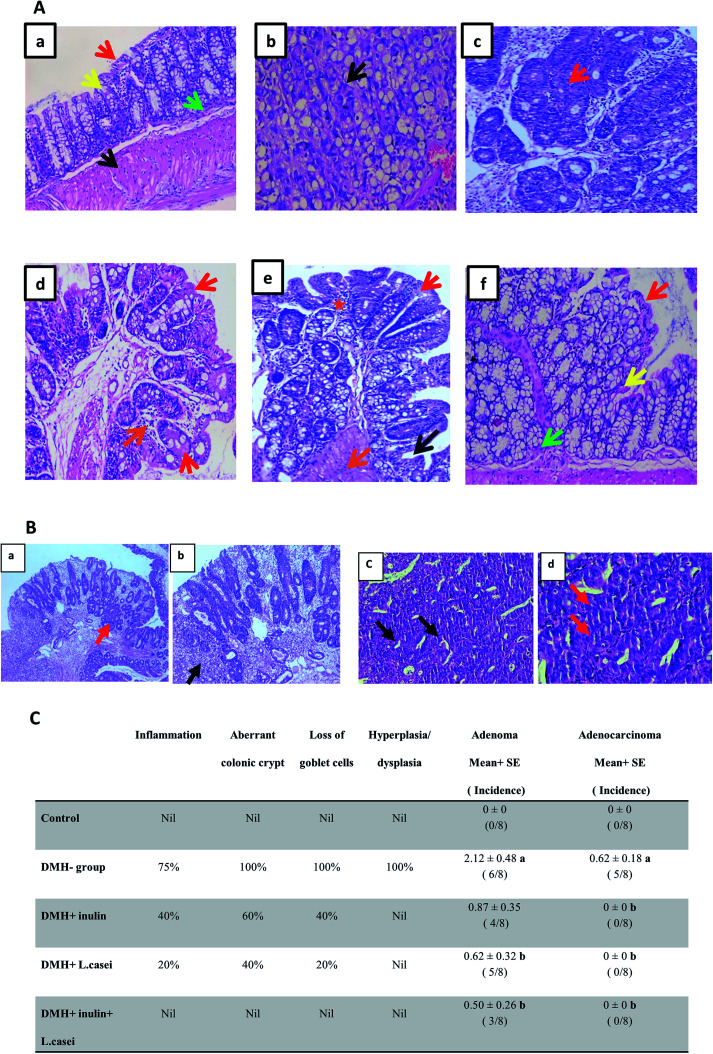
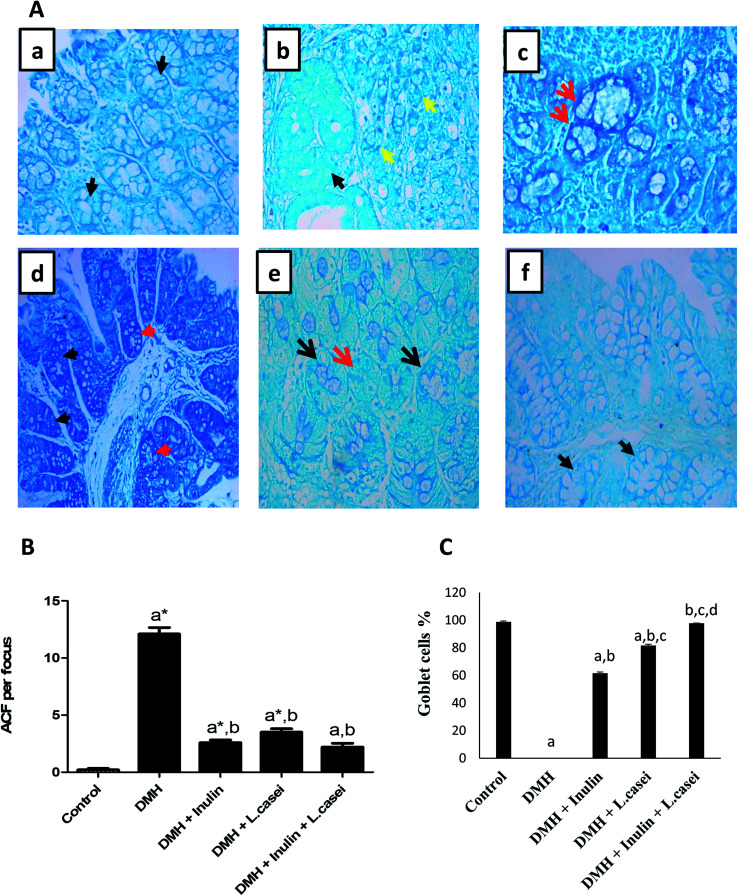
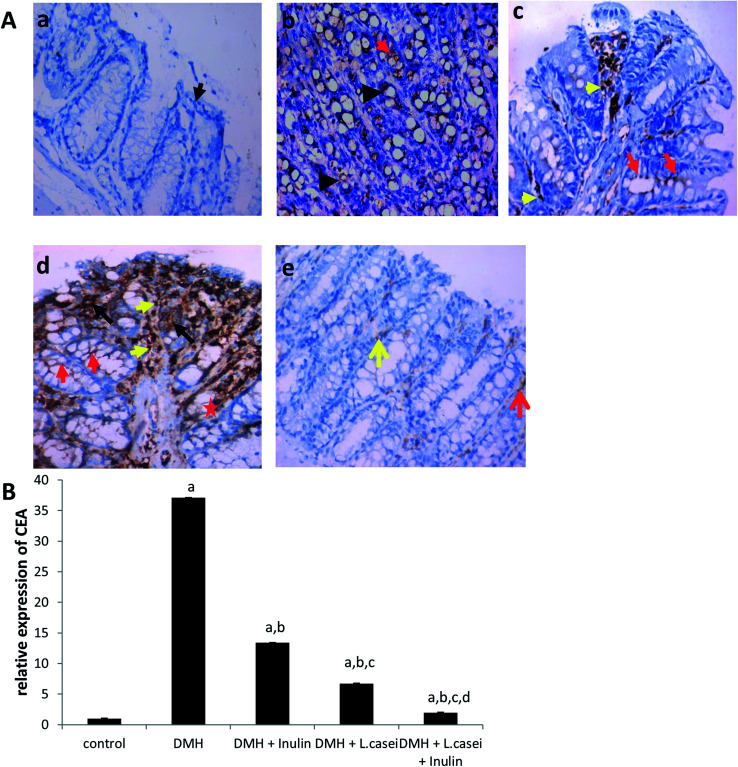
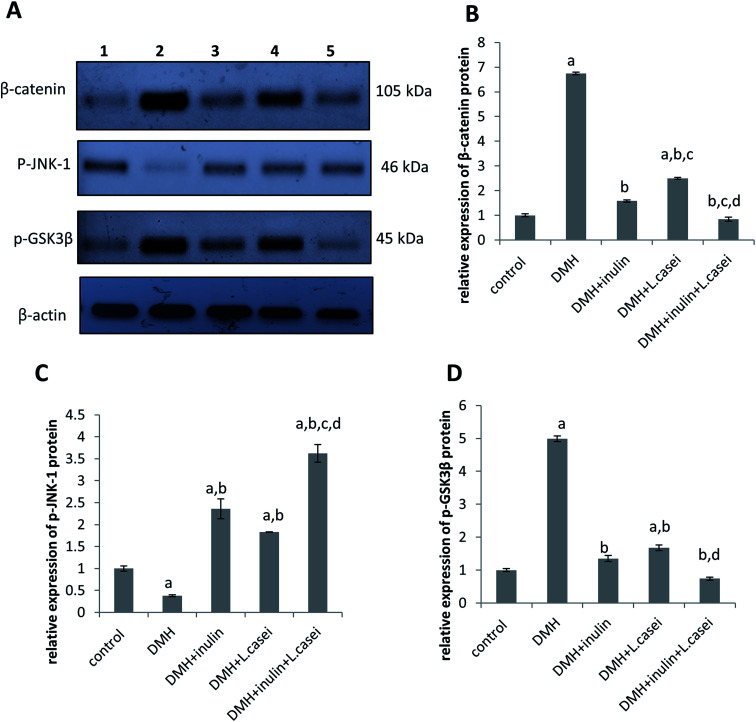
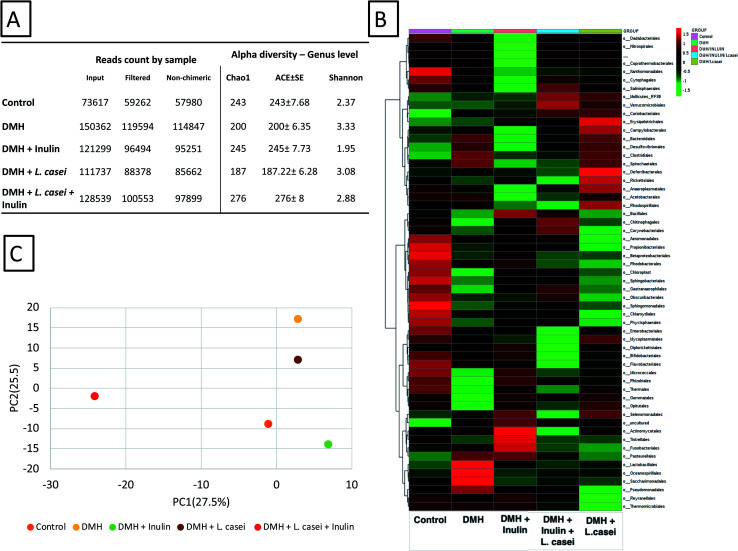
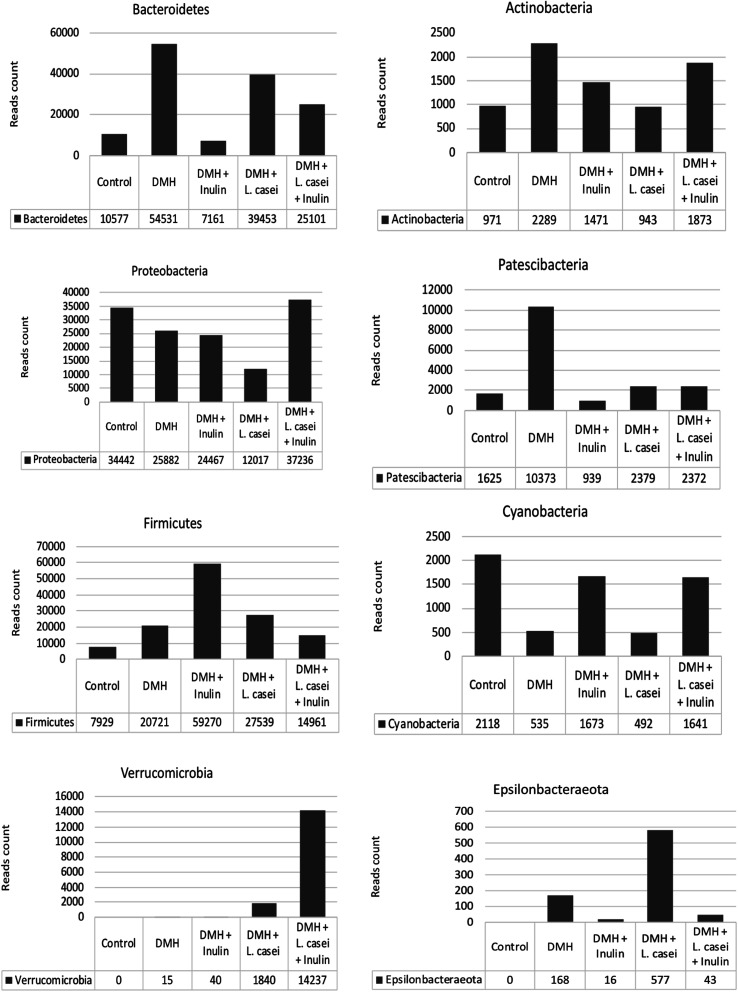
Colon cancer is a complex disease that involves numerous genetic alterations that change the normal colonic mucosa into invasive adenocarcinoma. In the current study, the protective effects of inulin (prebiotic), Lactobacillus casei (L. casei, probiotic) and their combination (synbiotic) on 1,2-dimethylhydrazine (DMH)-induced colon cancer in male Swiss mice were evaluated. Animals were divided into: Control group, DMH-treated group, DMH plus inulin, DMH plus L. casei and DMH plus inulin plus L. casei-treated groups. Fecal microbiome analysis, biochemical measurements, histopathological examination of the colon tissues, immunostaining and Western blotting analysis of β-catenin, GSK3β and JNK-1 were performed. The prebiotic-, probiotic- and synbiotic-treated groups showed decreased levels of carcinoembryonic antigen and a lower number of aberrant crypt foci compared to the DMH-treated group with the synbiotic group exhibiting a superior effect. Furthermore, all treatments showed a body weight-reducing effect. Administration of inulin, L. casei or their combination increased the expression level of phospho-JNK-1 while they decreased the expression level of β-catenin and phospho-GSK3β. Remarkably, L. casei treatment resulted in enrichment of certain beneficial bacterial genera i.e. Akkermansia and Turicibacter. Therefore, administration of L. casei and inulin as a synbiotic combination protects against colon cancer in mice.


Conflict of interest statement

Authors declare no conflict of interests.

Figures

Fig. 1
Fig. 1. Effect of the treatments on mice body weight. Line chart shows the mice body weights of the control, DMH, DMH + inulin, DMH + L. casei and DMH + inulin + L. casei, evaluated at 4 weeks interval till the sacrifice day. aSignificantly different from control group (p < 0.01). bSignificantly different from DMH group (p < 0.01).
Fig. 2
Fig. 2. Macroscopic examination of the colons. (A) A photo-macrograph of the entire colon from normal control group showing no plaque lesions. (B) A photo-macrograph of the entire colon from the DMH-treated group showing multiple plaque lesions. (C) A photo-macrograph from the DMH + inulin treated group showing one plaque lesion. (D) A photo-macrograph from the DMH + L. casei treated group showing two plaque lesions. (E) A photo-macrograph from the DMH + inulin + L. casei treated with no plaque lesions that can be seen.
Fig. 3
Fig. 3. Microscopic examination of the colon tissues. (A) H&E staining of the colon sections. (a) Colon tissue from the control group showing normal mucosa lined with columnar mucin-secreting cells (red arrow) overlying crypts (yellow arrow) with normal muscularis mucosa (green arrow) and normal muscle tissue (black arrow). (b and c) Colon tissues from the DMH-treated group. (b) Colonic mucosa showing malignant colonic acini forming irregular tubular structures, with nuclear stratification, multiple lumens and reduced stroma (“back to back”) invading lamina and muscle layer ((b) black arrow), (c) colonic mucosa showing crowded, back to back colonic glands lined with hyperplastic and dysplastic epithelial cells ((c) red arrow). (d) Colon tissues from the DMH + inulin treated group, showing colonic mucosa lined with columnar mucin-secreting cells with regenerative changes (red arrow) and chronic inflammatory cells (orange arrow). (e) Colon tissues from the DMH + L. casei treated group, showing colonic mucosa lined with columnar mucin-secreting cells (red arrow) with regenerative changes (dark blue arrow), chronic inflammatory cells (orange arrow) and inflammatory cells (orange star). (f) Colon tissues from the DMH + inulin + L. casei treated group, showing almost normal mucosa lined with columnar mucin-secreting cells (red arrow) overlying crypts (yellow arrow) with normal muscularis mucosa (green arrow). 400×. (B) H&E staining of DMH-treated colon tissues showing adenoma and adenocarcinoma. (a and b) Colonic mucosa of DMH group showing both tubular adenoma with high grade dysplasia and malignant changes. (a) Colonic mucosa showing crowded, back to back colonic glands lined with hyperplastic and dysplastic epithelial cells (red arrow), 100×. (b) Colonic mucosa showing malignant colonic acini, malignant irregular sheets of mucin secreting cells with signet cell differentiation, invading lamina and muscle layer (black arrow), 200×. (c) Colonic mucosa of DMH group showing malignant colonic acini, malignant acini forming irregular tubular structures, with nuclear stratification (black arrow), 100×. (d) Multiple lumens and reduced stroma (“back to back”) (red arrow) invading lamina and muscle layer are seen, 400×. (C) Table shows the percentage of incidence of the histopathological changes in groups. aSignificantly different from control group (p < 0.001). bSignificantly different from DMH group (p < 0.001). Number of mice is 8 per group.
Fig. 4
Fig. 4. Methylene blue staining of the aberrant crypt foci among the studied groups. (A) Photomicrograph of colon tissues showing aberrant crypt foci. (a) Colonic section from the control group stained with methylene blue showing normal crypts (black arrow). (b and c) Colonic sections from the DMH-treated group showing tumoral signet ring cells (yellow arrow) and normal crypts can be seen (black arrow). (d) Colonic section from the DMH + inulin treated group showing few aberrant colonic crypt foci (red arrow) and normal crypts (black arrow). (e) Colonic section from the DMH + L. casei treated group showing scattered aberrant colonic crypts (red arrow) and normal crypts (black arrow). (f) Colonic section from the (DMH + inulin + L. casei) treated group showing normal crypts (black arrow), ×400. (B) Quantification of the colonic ACF per focus in the studied groups, (C) Quantification of the goblet cells in the studied groups. Data are represented as mean ± SE. aSignificantly different from control group (p < 0.01). a*Significantly different from control group (p < 0.001). bSignificantly different from DMH group (p < 0.001). cSignificantly different from DMH + inulin group (p < 0.001). dSignificantly different from DMH + L. casei group (p < 0.001).
Fig. 5
Fig. 5. The CEA expression in the colon tissues among the studied group. (A) Photomicrograph of mice colon tissues showing the expression level of CEA. (a) Colon tissue from the control group showing normal mucosa with negative CEA expression (black arrow). (b) Colonic mucosa from the DMH-treated group showing high expression level of CEA was no longer restricted to the apical surface (red arrow points to apical surface staining) and significant intracellular localization of CEA in the malignant cells (black arrows). (c) Colon tissues from the (DMH + inulin) group showing mild expression level of CEA in the apical surface (red arrow points to apical surface staining) and positive staining of inflammatory cells (yellow arrow). (d) Colon tissues from the (DMH + L. casei) treated group showing moderate expression of CEA in the apical surface of crypts (red arrow points to apical surface staining & red star point to basolateral staining) and significant intracellular localization of CEA in aberrant colonic crypts (black arrow) in addition to a positive staining of inflammatory cells (yellow arrow). (e) Colon tissues from the (DMH + inulin + L. casei) treated group showing minimal expression level of CEA restricted to the apical surface (red arrow points to apical surface staining), positive staining of inflammatory cells (yellow arrow), ×400. (B) Quantification of the expression level of CEA. Column figure shows the relative expression level of CEA on (Y-axis) among control, DMH, DMH + inulin, DMH + L. casei and DMH + inulin + L. casei treated groups on (X-axis). Number of mice is 8 per group. Data are represented as mean ± SE. aSignificantly different from control group (p < 0.001). bSignificantly different from DMH group (p < 0.001). cSignificantly different from DMH + inulin group (p < 0.001). dSignificantly different from DMH + L. casei group (p < 0.001).
Fig. 6
Fig. 6. Western blotting of β-catenin, p-JNK-1 and p-GSK3β expression in colonic tissues from the studied group. (A) Western blot analysis of β-catenin, p-JNK-1 and p-GSK3β proteins expression versus housekeeping protein β-actin in the following order: Lane 1: control group, Lane 2: DMH group, Lane 3: DMH + inulin group, Lane 4: DMH + L. casei group and Lane 5: DMH + inulin + L. casei group. (B) The quantitative densitometry of the expression level of β-catenin protein. (C) The quantitative densitometry of the expression level of p-JNK-1, (D) the quantitative densitometry of the expression level of p-GSK3β. Number of mice is 8. Data are represented as mean ± SE. aSignificantly different from control group (p < 0.05). bSignificantly different from DMH group (p < 0.05). cSignificantly different from inulin group (p < 0.05). dSignificantly different from L. casei group (p < 0.05).
Fig. 7
Fig. 7. Overview of the microbiome analysis. (A) The obtained reads count for the different groups used in the study showing the original and the filtered reads count. The alpha diversity factors Chao1, ACE and Shannon indexes are shown. (B) Heatmap representation of the microbiome results shown to the order level. (C) Principal component analysis PcoA determined based on the reads count per genus. The principal component 1 was calculated to 27.5% and PC2 was calculated to 25.5%. ClustVis webserver with a built-in program was used to calculate the principal components.
Fig. 8
Fig. 8. Reads count for major phyla and genera. The reads count for the major phyla recorded among the different groups.

Similar articles

Cited by

References

    1. Roy S. Chakraborty T. Deciphering the molecular mechanism and apoptosis underlying the in vitro and in vivo chemotherapeutic efficacy of vanadium luteolin complex in colon cancer. Cell Biochem. Funct. 2018;36:116–128. doi: 10.1002/cbf.3322. - DOI - PubMed
    1. Sangeetha N. Aranganathan S. Nalini N. Silibinin ameliorates oxidative stress induced aberrant crypt foci and lipid peroxidation in 1,2 dimethylhydrazine induced rat colon cancer. Invest. New Drugs. 2010;28:225–233. doi: 10.1007/s10637-009-9237-5. - DOI - PubMed
    1. Mendes M. C. S. et al., Microbiota modification by probiotic supplementation reduces colitis associated colon cancer in mice. World J. Gastroenterol. 2018;24:1995. doi: 10.3748/wjg.v24.i18.1995. - DOI - PMC - PubMed
    1. Liu C. et al., Phytic acid improves intestinal mucosal barrier damage and reduces serum levels of proinflammatory cytokines in a 1,2-dimethylhydrazine-induced rat colorectal cancer model. Br. J. Nutr. 2018;120:121–130. doi: 10.1017/s0007114518001290. doi: 10.1017/S0007114518001290. - DOI - DOI - PubMed
    1. Koh G. Y. et al., Parabacteroides distasonis attenuates toll-like receptor 4 signaling and Akt activation and blocks colon tumor formation in high-fat diet-fed azoxymethane-treated mice. Int. J. Cancer. 2018;143:1797–1805. doi: 10.1002/ijc.31559. - DOI - PubMed