Single-Cell Sequencing Analysis Based on Public Databases for Constructing a Metastasis-Related Prognostic Model for Gastric Cancer
- PMID: 35528539
- PMCID: PMC9068325
- DOI: 10.1155/2022/7061263
Single-Cell Sequencing Analysis Based on Public Databases for Constructing a Metastasis-Related Prognostic Model for Gastric Cancer
Abstract
Background: Although incidences of gastric cancer have decreased in recent years, the disease remains a significant danger to human health. Lack of early symptoms often leads to delayed diagnosis of gastric cancer, so that many patients miss the opportunity for surgery. Treatment for advanced gastric cancer is often limited. Immunotherapy, targeted therapy, and the mRNA vaccine have all emerged as potentially viable treatments for advanced gastric cancer. However, our understanding of the immune microenvironment of gastric cancer is far from sufficient; now is the time to explore this microenvironment.
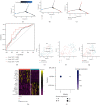
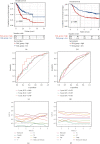
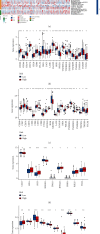
Methods: In our study, using TCGA dataset and the GEO dataset GSE62254, we performed in-depth transcriptome and single-cell sequencing analyses based on public databases. We analyzed differential gene expressions of immune cells in metastatic and nonmetastatic gastric cancer and constructed a prognostic model of gastric cancer patients based on these differential gene expressions. We also screened candidate vaccine genes for gastric cancer.
Results: This prognostic model can accurately predict the prognosis of gastric cancer patients by dividing them into high-risk and low-risk groups. In addition to this, we identified a candidate vaccine gene for gastric cancer: PTPN6.
Conclusions: Our study could provide new ideas for the treatment of gastric cancer.
Copyright © 2022 Rubin Xu et al.
Conflict of interest statement
All authors declare that no conflict of interest exists.
Figures


Similar articles
-
Immune landscape of advanced gastric cancer tumor microenvironment identifies immunotherapeutic relevant gene signature.BMC Cancer. 2021 Dec 11;21(1):1324. doi: 10.1186/s12885-021-09065-z. BMC Cancer. 2021. PMID: 34893046 Free PMC article.
-
Derivation and Comprehensive Analysis of Aging Patterns in Patients with Bladder Cancer.Dis Markers. 2021 Oct 21;2021:3385058. doi: 10.1155/2021/3385058. eCollection 2021. Dis Markers. 2021. PMID: 34721733 Free PMC article.
-
Identification of cuproptosis-related subtypes, construction of a prognosis model, and tumor microenvironment landscape in gastric cancer.Front Immunol. 2022 Nov 21;13:1056932. doi: 10.3389/fimmu.2022.1056932. eCollection 2022. Front Immunol. 2022. PMID: 36479114 Free PMC article.
-
A novel signature based on CeRNA and immune status predicts prognostic risk and drug sensitivity in gastric cancer patients.Front Immunol. 2022 Nov 22;13:951135. doi: 10.3389/fimmu.2022.951135. eCollection 2022. Front Immunol. 2022. PMID: 36483555 Free PMC article.
-
A novel necroptosis-related gene index for predicting prognosis and a cold tumor immune microenvironment in stomach adenocarcinoma.Front Immunol. 2022 Oct 27;13:968165. doi: 10.3389/fimmu.2022.968165. eCollection 2022. Front Immunol. 2022. PMID: 36389725 Free PMC article. Review.
Cited by
-
Immune Profiling in Gastric Cancer Reveals the Dynamic Landscape of Immune Signature Underlying Tumor Progression.Front Immunol. 2022 Jul 8;13:935552. doi: 10.3389/fimmu.2022.935552. eCollection 2022. Front Immunol. 2022. PMID: 35874784 Free PMC article.
-
Platelet-Based Liquid Biopsies through the Lens of Machine Learning.Cancers (Basel). 2023 Apr 17;15(8):2336. doi: 10.3390/cancers15082336. Cancers (Basel). 2023. PMID: 37190262 Free PMC article.
-
FOXF1 Was Identified as a Novel Biomarker of Infantile Hemangioma by Weighted Coexpression Network Analysis and Differential Gene Expression Analysis.Contrast Media Mol Imaging. 2022 Jul 30;2022:8981078. doi: 10.1155/2022/8981078. eCollection 2022. Contrast Media Mol Imaging. 2022. PMID: 35992538 Free PMC article.
-
Integrating single-cell RNA-seq and bulk RNA-seq to construct prognostic signatures to explore the role of glutamine metabolism in breast cancer.Front Endocrinol (Lausanne). 2023 Feb 10;14:1135297. doi: 10.3389/fendo.2023.1135297. eCollection 2023. Front Endocrinol (Lausanne). 2023. PMID: 36843602 Free PMC article.
-
Exploring the tumor microenvironment of breast cancer to develop a prognostic model and predict immunotherapy responses.Sci Rep. 2025 Apr 12;15(1):12569. doi: 10.1038/s41598-025-97784-9. Sci Rep. 2025. PMID: 40221624 Free PMC article.
References
LinkOut - more resources
Full Text Sources

