. 2019 Aug 27;9(46):26787-26798.
doi: 10.1039/c9ra03313k. eCollection 2019 Aug 23.

Epigallocatechin gallate prevents senescence by alleviating oxidative stress and inflammation in WI-38 human embryonic fibroblasts

Affiliations

Epigallocatechin gallate prevents senescence by alleviating oxidative stress and inflammation in WI-38 human embryonic fibroblasts

Qiao Zhang et al. RSC Adv. .

Abstract

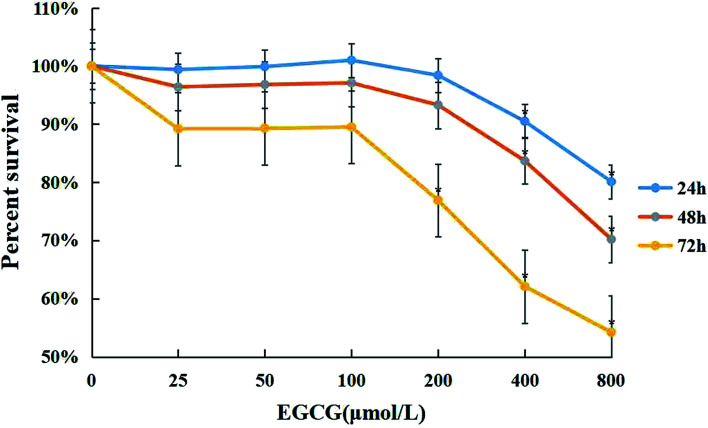
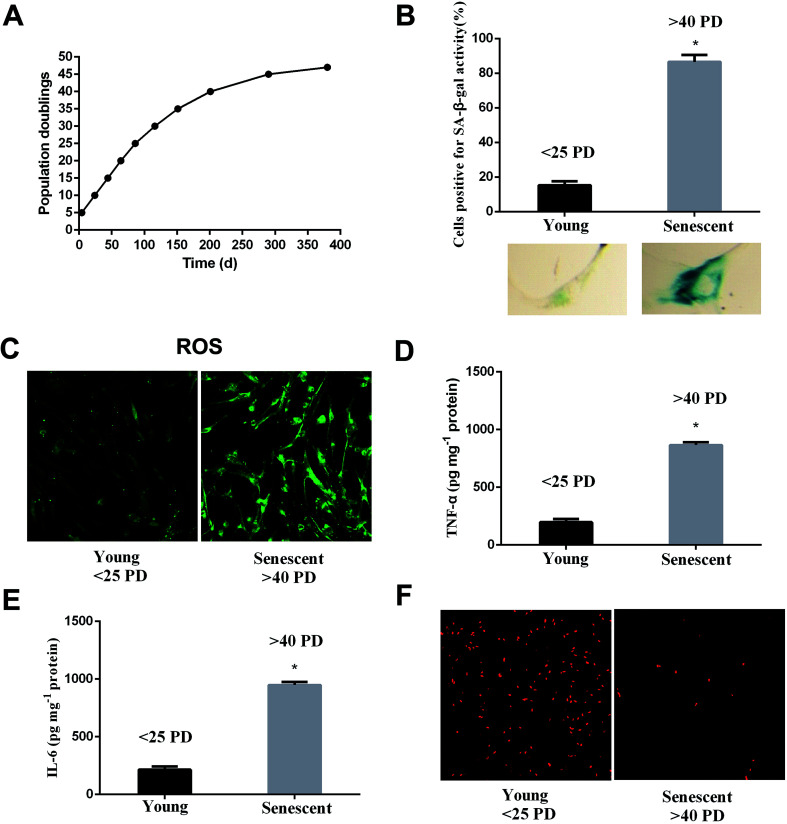
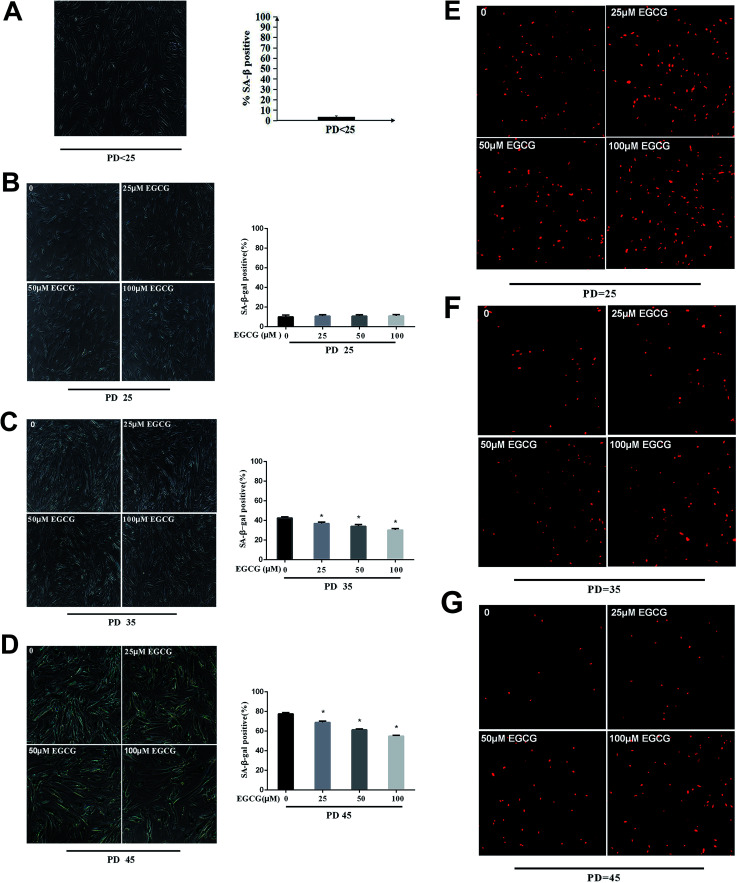
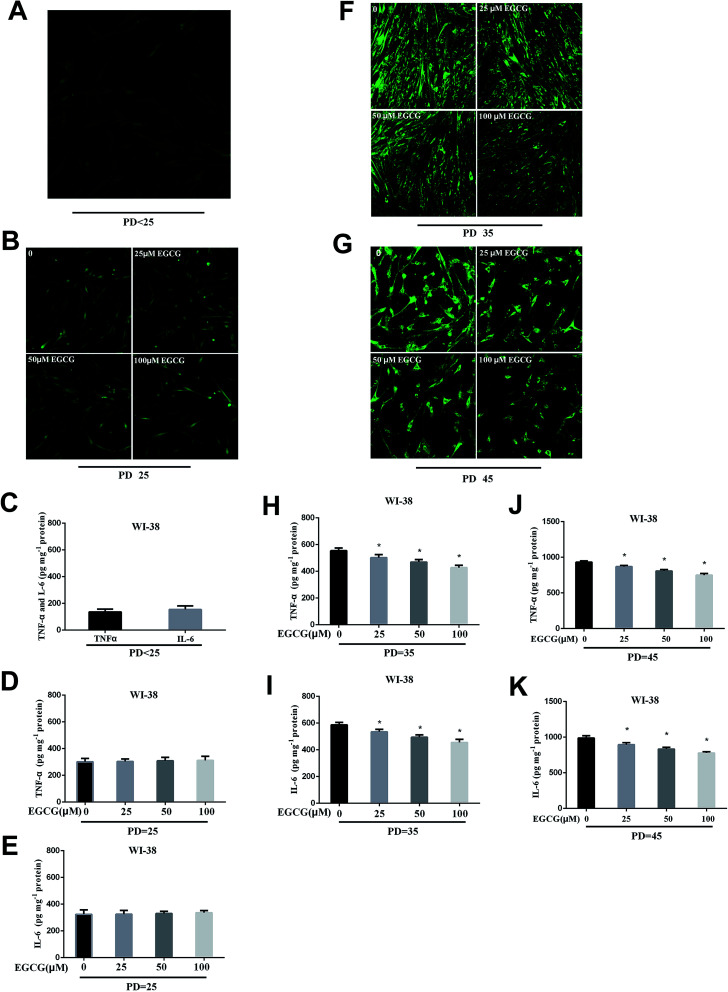
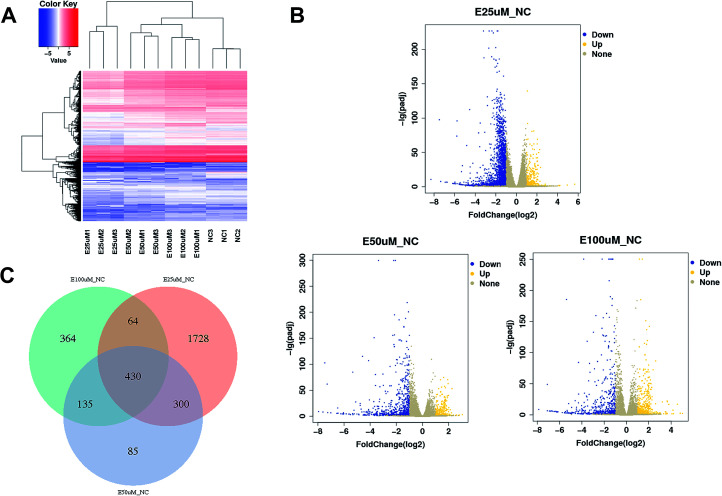
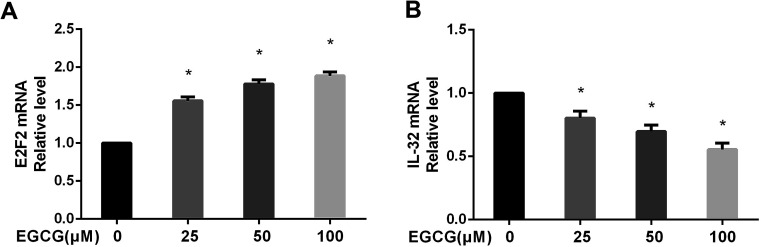
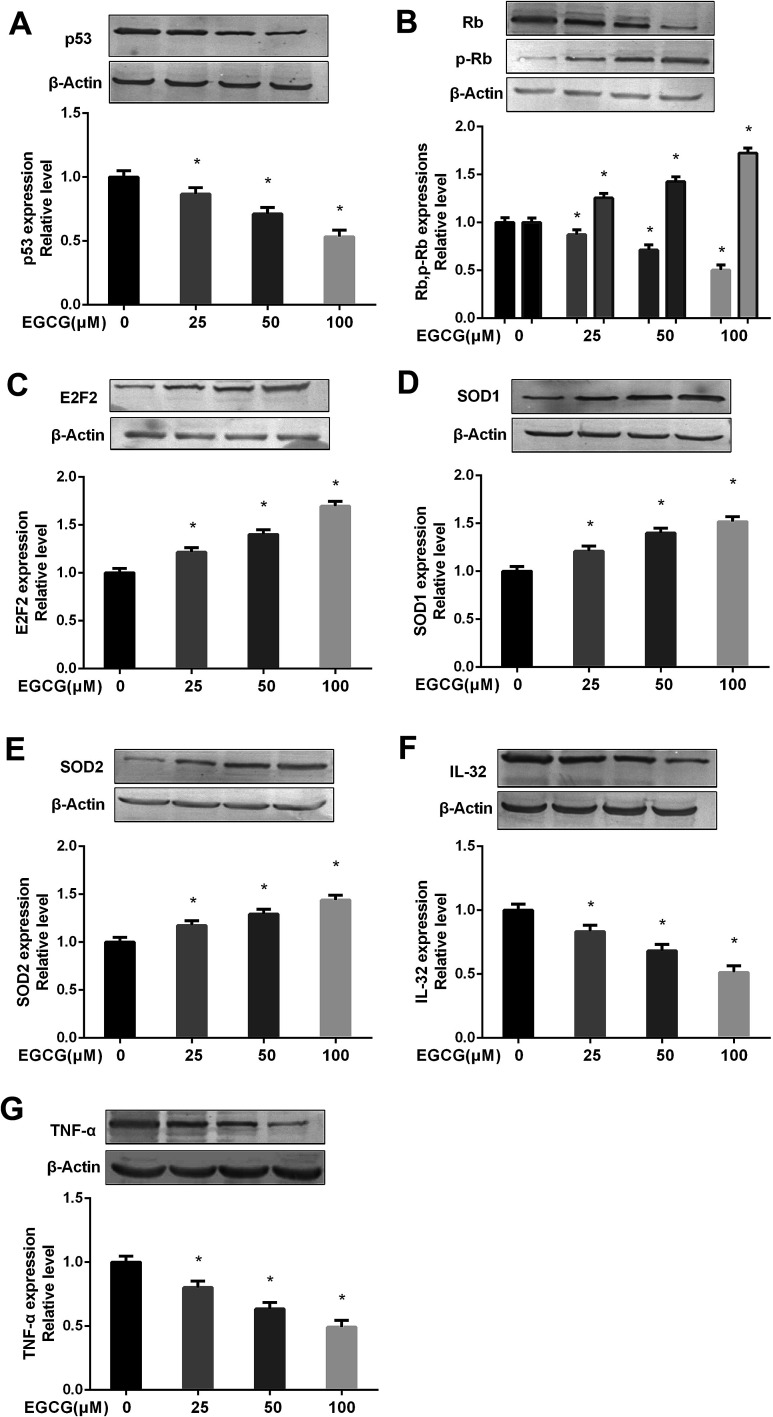
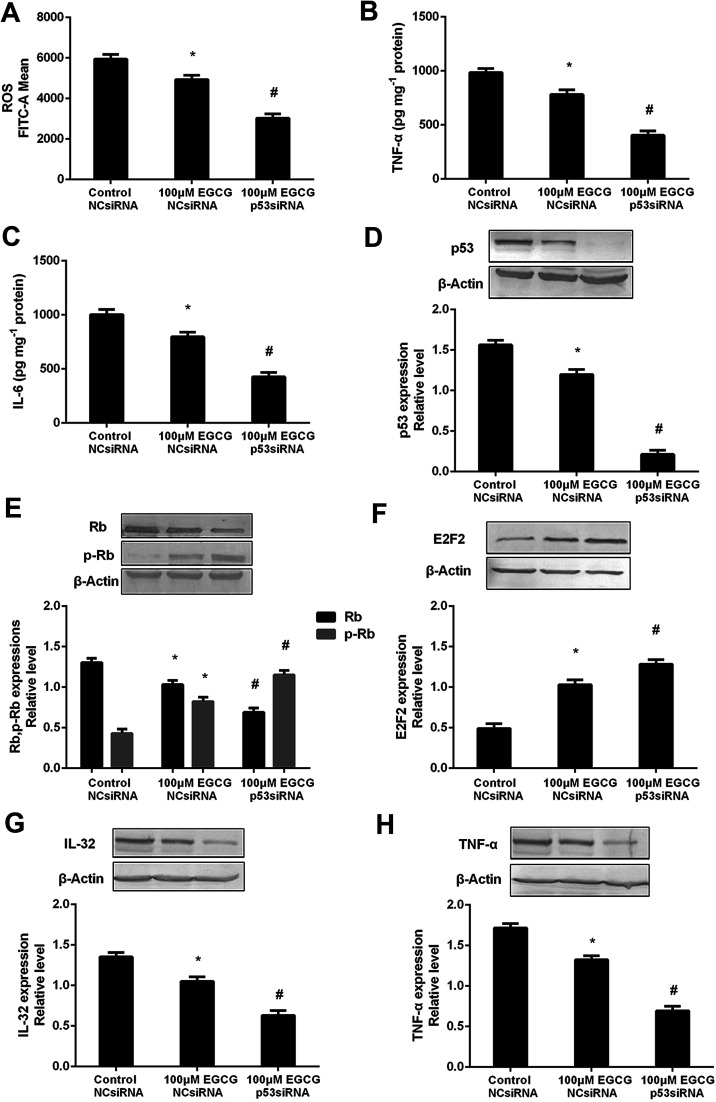
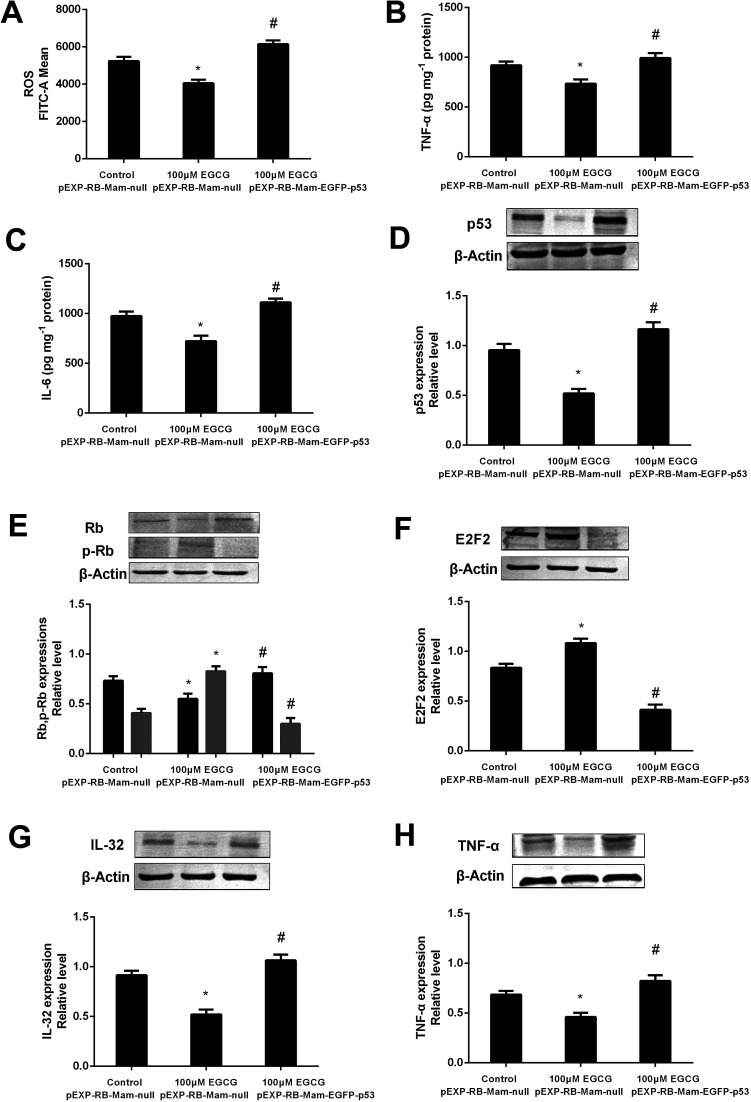
Increased levels of oxidative stress and inflammation are the underlying mechanisms behind the aging process and age-related diseases. The purpose of our research is to explore whether epigallocatechin gallate (EGCG) can extend replicative life span by preventing the oxidative stress and inflammatory effects of WI-38 fibroblasts and the involved mechanisms in vitro. WI-38 cells were treated with different concentrations of EGCG (0, 25, 50 and 100 μM) at population doubling (PD) 25. At late-stage cells, we determined the age-associated genes with signaling through transcriptome sequencing. The expression profile of the targets in WI-38 fibroblasts was confirmed by bioinformatics analysis, qPCR and western blot. We found that EGCG markedly decreased reactive oxygen species (ROS), and inflammation factors, tumor necrosis factor-α (TNF-α), interleukin (IL)-6, and significantly increased cell proliferation at PD 35 and 45. EGCG treatments significantly decreased p53 and retinoblastoma (Rb) expressions, markedly increased p-Rb and E2F2 expressions as well as antioxidant enzymes and superoxide dismutase (SOD) 1 and SOD2 content, and obviously decreased the expressions of inflammation factors IL-32, TNF-α expressions at PD 45 WI-38 cells. Moreover, the effects were changed by EGCG treatment by p53 siRNA or overexpression. These findings in our studies reveal that EGCG treatments improved senescence and enhanced the replicative life span through alleviating oxidative stress and inflammation in WI-38 fibroblasts.


Conflict of interest statement

The authors declare that they have no conflict of interests.

Figures

Fig. 1
Fig. 1. The cytotoxic effects of EGCG in WI-38 fibroblasts. The effects of EGCG (0, 25, 50, 100, 200, 400, and 800 μM) for 24, 48 and 72 h with the MTT assay. The experiments were repeated 3 times. Data are presented as means ± SD (n = 3). *P < 0.05 compared with the control group.
Fig. 2
Fig. 2. Aging is associated with increased ROS, inflammation factors and decreased proliferation. (A) Proliferation curve of WI-38 fibroblasts. (B) Early-passage cells (<25 PD) were defined as young because only 10% were positive for SA-β-Gal staining. Late-passage cells (>40 PD) were defined as senescent cells because more than 90% of the cells were positive for SA-β-Gal staining. (C) The ROS levels at early and late passages. (D) The TNF-α levels at early and late passages. (E) The IL-6 levels at early and late passages. (F) Cell proliferation shows the characteristic EdU staining. Data are presented as means ± SD (n = 3). *P < 0.05 compared with young.
Fig. 3
Fig. 3. The senescent state was dynamically monitored in WI-38 fibroblasts. (A) The senescent state at PD < 25 of WI-38. (B) The senescent state at PD 25 of WI-38. (C) The senescent state at PD 35 of WI-38. (D) The senescent state at PD 45 of WI-38. The proliferation with EdU staining at PD 25 (E), 35 (F), 45 (G) of WI-38 fibroblasts. Data are presented as means ± SD (n = 3). *P < 0.05 compared with the control group.
Fig. 4
Fig. 4. The ROS and inflammation factors levels were dynamically measured in WI-38 fibroblasts. The ROS (A and B), TNF-α and IL-6 levels (C–E) at the early passage of WI-38 fibroblasts. The ROS levels (F) at PD 35 of WI-38 fibroblasts. The ROS levels (G) at PD 45 of WI-38 fibroblasts. The TNF-α (H) and IL-6 (I) levels at PD 35 of WI-38 fibroblasts. The TNF-α (J) and IL-6 (K) levels at PD 45 of WI-38 fibroblasts. Data are presented as means ± SD (n = 3). *P < 0.05 compared with the control group.
Fig. 5
Fig. 5. mRNA expression profiling among samples. Heatmap (A), volcano plots (B) and Venn plot (C) reflect mRNA differential expression among samples.
Fig. 6
Fig. 6. The E2F2 and IL-32 mRNA levels were verified in WI-38 fibroblasts. The E2F2 (A) and IL-32 (B) mRNA levels were determined by real time-PCR at PD 45 of WI-38 fibroblasts. Data are presented as means ± SD (n = 3). *P < 0.05 compared with the control group.
Fig. 7
Fig. 7. Effects of EGCG on key proteins involved in cell proliferation, oxidative stress and inflammation at PD 45 of WI-38 cells. The p53 (A), (p)Rb (B), E2F2 (C), SOD1 (D), SOD2 (E), IL-32 (F) and TNF-α (G) protein levels were determined by western blot method at PD 45 of WI-38 fibroblasts. The experiments were repeated 3 times. Data are presented as means ± SD (n = 3). *P < 0.05 compared with the control group.
Fig. 8
Fig. 8. p53 mediated EGCG improvement of cell senescence in WI-38 cells. The ROS (A), TNF-α (B) and IL-6 (C) levels, and p53 (D), (p)Rb (E), E2F2 (F), IL-32 (G) and TNF-α (H) protein expressions after transfected with p53 siRNA at PD 45 of WI-38 cells. The experiments were repeated 3 times. Data are presented as means ± SD (n = 3). * Compared with control + NCsiRNA, P < 0.05; # compared with EGCG + NCsiRNA group, P < 0.05.
Fig. 9
Fig. 9. The p53 pathway involved into EGCG-regulation of cell lifespan in WI-38 cells. The ROS (A), TNF-α (B) and IL-6 (C) levels, and p53 (D), (p)Rb (E), E2F2 (F), IL-32 (G) and TNF-α (H) protein expressions after transfected with pEXP-RB-Mam-EGFP-p53 at PD 45 of WI-38 cells. The experiments were repeated 3 times. Data are presented as means ± SD (n = 3). * Compared with pEXP-RB-Mam-null, P < 0.05; # compared with 100 μM EGCG pEXP-RB-Mam-null, P < 0.05.

Similar articles

Cited by

References

    1. Khansari N. Shakiba Y. Mahmoudi M. Recent Pat. Inflammation Allergy Drug Discovery. 2009;3:73–80. doi: 10.2174/187221309787158371. - DOI - PubMed
    1. Zhou J. Ouedraogo M. Qu F. Duez P. Phytother. Res. 2013;27:1745–1755. doi: 10.1002/ptr.4942. - DOI - PubMed
    1. Tsubota K. Nippon Ganka Gakkai Zasshi. 2007;111:193–205. - PubMed
    1. Sampayo J. N. Gill M. S. Lithgow G. J. Biochem. Soc. Trans. 2003;31:1305–1307. doi: 10.1042/bst0311305. - DOI - PubMed
    1. Hayflick L. Moorhead P. S. Exp. Cell Res. 1961;25:585–621. doi: 10.1016/0014-4827(61)90192-6. - DOI - PubMed