. 2019 Aug 27;9(46):26734-26747.
doi: 10.1039/c9ra05072h. eCollection 2019 Aug 23.

A model for the chemomechanical coupling of myosin-V molecular motors

Affiliations

A model for the chemomechanical coupling of myosin-V molecular motors

Ping Xie. RSC Adv. .

Abstract

Herein, a model for the chemomechanical coupling of dimeric myosin-V motors is presented. Based on this model and the proposal that the rate constants of the ATPase activity of the two heads are independent of an external force in a range smaller than the stall force, we analytically studied the dynamics of the motor, such as the stepping ratio, dwell time between two mechanical steps, and velocity, under varying force and ATP concentrations. The theoretical results well reproduce the diverse available single-molecule experimental data. In particular, the experimental data showing that at a low ATP concentration, the dwell time and velocity have less force dependency than at a high ATP concentration is explained quantitatively. Moreover, the dependency of the chemomechanical coupling ratio on the force and ATP concentration was studied.


Conflict of interest statement

No conflict of interest exists.

Figures

Fig. 1
Fig. 1. Model of myosin-V motor moving on actin at low ATP. (a)–(l) Schematic illustrations of the pathway for the chemomechanical coupling (see text for detailed description). The thickness of the arrow represents the magnitude of the transition rate or probability under low backward force. (m) Simplified model derived from the pathway shown in (a)–(l), where k(+) and k(−) are the ATPase rates of the trailing and leading heads, respectively. The green circle represents the center of mass of the motor. The positions of binding sites on actin filament are denoted by …, (i − 1), i, (i + 1), …. The motor can step forward and backward with rates PEFk(+) and PEBk(−), respectively. Inset box: (a′)–(c′) show the orientations of the neck domain relative to its motor domain bound to actin filament in different nucleotide states, and (d′) shows the relative orientation of the two heads in the intermediate state with one head bound to actin and the other head detached from the actin, with the right panel corresponding to the side view of the left panel. Stars represent the position of the gold particle labeled to the head used in the experiments of Andrecka et al.
Fig. 2
Fig. 2. Model of myosin-V motor moving on actin at saturated ATP. The model is simplified from that in Fig. 1. (a)–(e) Schematic illustrations of the pathway for the chemomechanical coupling (see text for detailed description). The thickness of the arrow represents the magnitude of the transition rate or probability under low backward force. (f) Simplified model derived from the pathway shown in (a)–(e), where kD(+) and kD(−) are the rate constants of ADP release from the trailing and leading heads, respectively. The green circle represents the center of mass of the motor. The positions of binding sites on actin filament are denoted by …, (i − 1), i, (i + 1), …. The motor can step forward and backward with rates PEFkD(+) and PEBkD(−), respectively.
Fig. 3
Fig. 3. Results for dynamics of chick brain myosin-V. Lines are theoretical data calculated with parameter values given in Table 1 under the experimental conditions of Uemura et al., and symbols are experimental data taken from Uemura et al. (a) Inverse of stepping ratio versus force at saturated ATP (1 mM). (b) Dwell time versus force. (c) Velocity versus force. (d) Dwell time versus ATP concentration at no additional ADP in buffer solution and for different force values. (e) Dwell time versus ADP concentration at 1 mM ATP and for different force values. (f) Inverse of stepping ratio versus force at different ATP and ADP concentrations.
Fig. 4
Fig. 4. Results for dynamics of chick brain myosin-V. (a) Dwell time versus force at different ATP concentrations. Lines are theoretical data calculated with parameter values given in Table 1 under the experimental conditions of Mehta et al., and symbols are experimental data taken from Mehta et al. (b) Velocity versus force at different ATP concentrations. Black and red lines are theoretical data calculated with parameter values given in Table 1 under the experimental conditions of Mehta et al., blue line represents the theoretical data calculated with all parameters having the same values as that under the experimental conditions of Mehta et al. except for kD(+) = 8 s−1, and blue squares are experimental data taken from Clemen et al. (c) Dwell time versus ATP concentration for different force values. Lines are theoretical data calculated with parameter values given in Table 1 under the experimental conditions of Mehta et al., and symbols are experimental data taken from Mehta et al. (d) Inverse of stepping ratio versus force at different ATP concentrations. The theoretical data was calculated with the parameter values given in Table 1 under the experimental conditions of Mehta et al.
Fig. 5
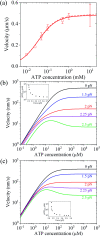
Fig. 5. Results for the dependence of velocity of myosin-V on ATP concentration. (a) Under no force. Dashed line represents the theoretical data calculated using v = k(+)d and kD(+) = 13.5 s−1 and kbT = 0.38 μM−1 s−1. Solid line represents the theoretical data calculated using eqn (17) and parameter values given in Table 1 under the experimental conditions of Uemura et al. except for kD(+) = 13.5 s−1 and kbT = 0.38 μM−1 s−1, and circles represent experimental data taken from Zhang et al. (b) Under force with different values. Lines are theoretical data calculated using eqn (17) and parameter values given in Table 1 under the experimental conditions of Uemura et al. Inset shows the ATP concentration, [ATP]max, at which the maximum velocity occurs, versus force. (c) Under force with different values. Lines are theoretical data calculated using eqn (17) and parameter values given in Table 1 under the experimental conditions of Mehta et al. Inset shows the ATP concentration, [ATP]max, at which the maximum velocity occurs, versus force.
Fig. 6
Fig. 6. Results of the mean number of ATP molecules consumed per mechanical step for chick brain myosin-V. (a) Number versus force at different ATP concentrations. The data was calculated using the parameter values given in Table 1 under the experimental conditions of Uemura et al. (b) Number versus ATP concentration for different values of the force. The data are calculated with parameter values given in Table 1 under the experimental condition of Uemura et al. (c) Number versus force at different ATP concentrations. The data was calculated with parameter values given in Table 1 under the experimental conditions of Mehta et al. (d) Number versus ATP concentration for different force values. The data was calculated using the parameter values given in Table 1 under the experimental conditions of Mehta et al.
Fig. 7
Fig. 7. Results of the force dependence of velocity for chick brain myosin-V with the inclusion of ATP-independent backward stepping under the experimental conditions of Gebhardt et al. Lines are theoretical data calculated using the parameter values given in Table 1 under the experimental conditions of Uemura et al. except for kbT = 2 μM−1 s−1. Circles are experimental data at 1 μM ATP taken from Gebhardt et al. Black line is the case with the inclusion of ATP-independent backward stepping (ε0 = 1.3 s−1 and Fd = 4.5 pN). Red line is the case without inclusion of ATP-independent backward stepping (ε0 = 0).

Similar articles

Cited by

References

    1. Reck-Peterson S. Provance D. W. Mooseker M. S. Mercer J. A. Biochim. Biophys. Acta. 2000;1496:36–51. doi: 10.1016/S0167-4889(00)00007-0. - DOI - PubMed
    1. Vale R. D. Cell. 2003;112:467–480. doi: 10.1016/S0092-8674(03)00111-9. - DOI - PubMed
    1. Yildiz A. Forkey J. N. McKinney S. A. Ha T. Goldman Y. E. Selvin P. R. Science. 2003;300:2061–2065. doi: 10.1126/science.1084398. - DOI - PubMed
    1. Forkey J. N. Quinlan M. E. Shaw M. A. Corrie J. E. T. Goldman Y. E. Nature. 2003;422:399–404. doi: 10.1038/nature01529. - DOI - PubMed
    1. Kodera N. Yamamoto D. Ishikawa R. Ando T. Nature. 2010;468:72–76. doi: 10.1038/nature09450. - DOI - PubMed