. 2022 Apr 28:2022:9284204.
doi: 10.1155/2022/9284204. eCollection 2022.

The Diagnostic and Predictive Significance of Immune-Related Genes and Immune Characteristics in the Occurrence and Progression of IgA Nephropathy

Affiliations

The Diagnostic and Predictive Significance of Immune-Related Genes and Immune Characteristics in the Occurrence and Progression of IgA Nephropathy

Jian-Bo Qing et al. J Immunol Res. .

Abstract

Objective: To investigate the potential diagnostic and predictive significance of immune-related genes in IgA nephropathy (IgAN) and discover the abnormal glomerular inflammation in IgAN.

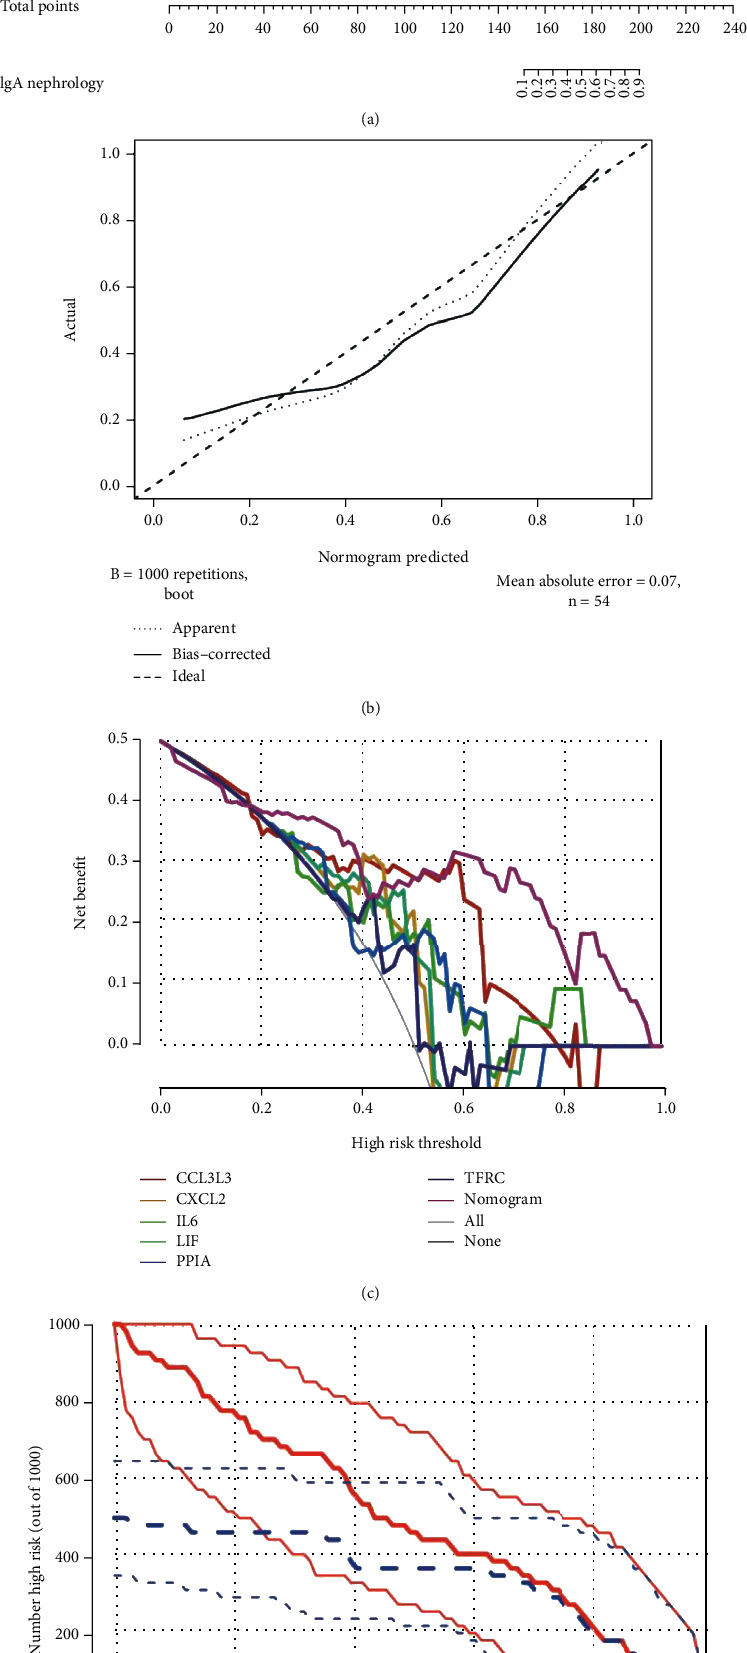
Methods: GSE116626 was used as a training set to identify different immune-related genes (DIRGs) and establish machine learning models for the diagnosis of IgAN; then, a nomogram model was generated based on GSE116626, and GSE115857 was used as a test set to evaluate its clinical value. Short Time-Series Expression Miner (STEM) analysis was also performed to explore the changing trend of DIRGs with the progression of IgAN lesions. GSE141344 was used with DIRGs to establish the ceRNA network associated with IgAN progression. Finally, ssGSEA analysis was performed on the GSE141295 dataset to discover the abnormal inflammation in IgAN.

Results: Machine learning (ML) performed excellently in diagnosing IgAN using six DIRGs. A nomogram model was constructed to predict IgAN based on the six DIRGs. Three trends related to IgAN lesions were identified using STEM analysis. A ceRNA network associated with IgAN progression which contained 8 miRNAs, 14 lncRNAs, and 3 mRNAs was established. A higher macrophage ratio and lower CD4+ T cell ratio in IgAN compared to controls were observed, and the correlation between macrophages and monocytes in the glomeruli of IgAN patients was inverse compared to controls.

Conclusion: This study reveals the diagnostic and predictive significance of DIRGs in IgAN and finds that the imbalance between macrophages and CD4+ immune cells may be an important pathomechanism of IgAN. These results provide potential directions for the treatment and prevention of IgAN.


Conflict of interest statement

The authors declare that they have no competing interests.

Figures

Figure 1
Figure 1
Workflow of the research. Abbreviations are defined as follows: Gene Expression Omnibus database (GEO), differentially expressed gene (DEG), immune-related gene (IRG), different immune-related gene (DIRG), differentially expressed miRNA (DE-miRNA), random forest (RF), Gradient Boosting Machine (GBM), Short Time-Series Expression Miner (STEM).
Figure 2
Figure 2
Differential expression analysis and enrichment analysis in GSE116626. (a) Volcano map of all DEGs of GSE116626: 245 DEGs were identified with P < 0.05 and ∣log2fold change | >1, including 160 upregulated and 85 downregulated genes. (b) Venn diagram of DEGs and IRGs: 34 DIRGs were identified. (c) Top 30 GO functional enrichment of 34 DIRGs. Biological process (BP, circle), cellular component (CC, square), and molecular function (MF, triangle) analysis results of 34 DIRGs. (d) Top 30 KEGG functional enrichment of 34 DIRGs. The size of the graph represents the number of genes, and the x-axis represents the enrichment score.
Figure 3
Figure 3
Construction and assessment of RF, GBM, and treebag model. (a) Elastic net of 34 DIRGs in GSE116626. The main parameters are alpha = 1 and lamda = 6 (CV.Glmnet function automatically produces the most appropriate value.). (b) Cumulative residual distribution map of the sample. (c) Boxplots of the residuals of the sample. Red dot stands for root mean square of residuals. The residual distributions were very close in the three models. (d) Importance of the variables in RF, GBM, and treebag model. The six DIRGs have different importance in three models.
Figure 4
Figure 4
Construction and validation of a nomogram model for IgAN diagnosis. (a) Nomogram model for IgAN diagnosis, based on the 6 DIRGs (PPIA, CCL3L3, CXCL2, TFRC, IL6, and LIF). (b) Calibration curve to evaluate the nomogram model. The actual IgAN risk and the predicted risk are very close. (c) DCA curve to assess the nomogram model. Different colors represent different combinations of variables, and the nomogram model has better benefits than other models in most risk thresholds. (d) The clinical impact curve based on the DCA curve to evaluate the nomogram model, and the nomogram model has a better clinical effect when the risk threshold exceeded 0.6.
Figure 5
Figure 5
Short Time-Series Expression Miner (STEM) analysis. (a) Heatmap of six gene expressions in trend 1, including 6 DIRGs, ITGAL, TUBB3, ADRB2, SLP1, CCL19, and CTSG. (b) Line chart of six gene expressions in trend 1, FDR = 0.00017. (c) Heatmap of seven gene expressions in trend 2, including 7 DIRGs, HLA-C, NOD1, PLAU, HLA-DRB1, HLA-DRB5, HLA-DMA, and SERPINA3. (d) Line chart of seven gene expressions in trend 2, FDR = 0.002. (e) Heatmap of six gene expressions in trend 3, including 6 DIRGs, CXCL2, NR4A1, NR4A2, CCL3, CCL3L3, and IL6. (f) Line chart of six gene expressions in trend 3, FDR = 0.0085.
Figure 6
Figure 6
Identification of ceRNA related to IgAN progression. (a) Gene rank of DE-miRNAs in GSE141344. 10 upregulated and 10 downregulated DE-miRNAs were identified using the package “DESq2” at P < 0.05 and ∣log2fold change | >1. (b) Venn diagram of 34 DIRGs and the data from miRDB, miWALK, and miRanda databases. There were three common targeted DIRGs (PPIA, ADRB2, and TFRC) in these three databases. (c) ceRNA network related to IgAN progression, including 8 miRNAs, 14 lncRNAs, and 3 mRNAs.
Figure 7
Figure 7
Immune signatures of the glomeruli in IgAN. (a) Heatmap of 24 immune cells calculated with ssGSEA in IgAN and healthy controls. (b) Boxplot of 24 immune cells in IgAN and healthy controls. Macrophages and NKT cells were significantly increased, while B cells, CD4+ T cells, Tr1, Treg, and Th1 cells were significantly decreased in IgAN. (c) Correlation heatmap of 10 main immune cells in IgAN. (d) Correlation heatmap of 10 main immune cells in healthy controls. (e) Line regression of monocytes and macrophages in IgAN and healthy controls. The proportion of monocytes and macrophages was negatively correlated in IgAN (R2 = 0.52, P = 0.003) but negatively correlated in the control group (R2 = 0.59, P = 0.009).

References

    1. Hassler J. IgA nephropathy: a brief review. Seminars in diagnostic pathology. . 2020;37(3):143–147. doi: 10.1053/j.semdp.2020.03.001. - DOI - PubMed
    1. Gutiérrez E., Carvaca-Fontán F., Luzardo L., Morales E., Alonso M., Praga M. A personalized update on IgA nephropathy: a new vision and new future challenges. Nephron . 2020;144(11):555–571. doi: 10.1159/000509997. - DOI - PubMed
    1. Schena F., Nistor I. Epidemiology of IgA nephropathy: a global perspective. Seminars in nephrology. . 2018;38(5):435–442. doi: 10.1016/j.semnephrol.2018.05.013. - DOI - PubMed
    1. Wyatt R., Julian B. IgA nephropathy. The New England journal of medicine. . 2013;368(25):2402–2414. doi: 10.1056/NEJMra1206793. - DOI - PubMed
    1. Reid S., Cawthon P., Craig J., et al. Non-immunosuppressive treatment for IgA nephropathy. The Cochrane database of systematic reviews. . 2011;(3):p. CD003962. doi: 10.1002/14651858.CD003962.pub2. - DOI - PubMed