. 2022 Apr 22:13:844292.
doi: 10.3389/fpls.2022.844292. eCollection 2022.

Long-Term High-Temperature Stress Impacts on Embryo and Seed Development in Brassica napus

Affiliations

Long-Term High-Temperature Stress Impacts on Embryo and Seed Development in Brassica napus

Kateřina Mácová et al. Front Plant Sci. .

Abstract

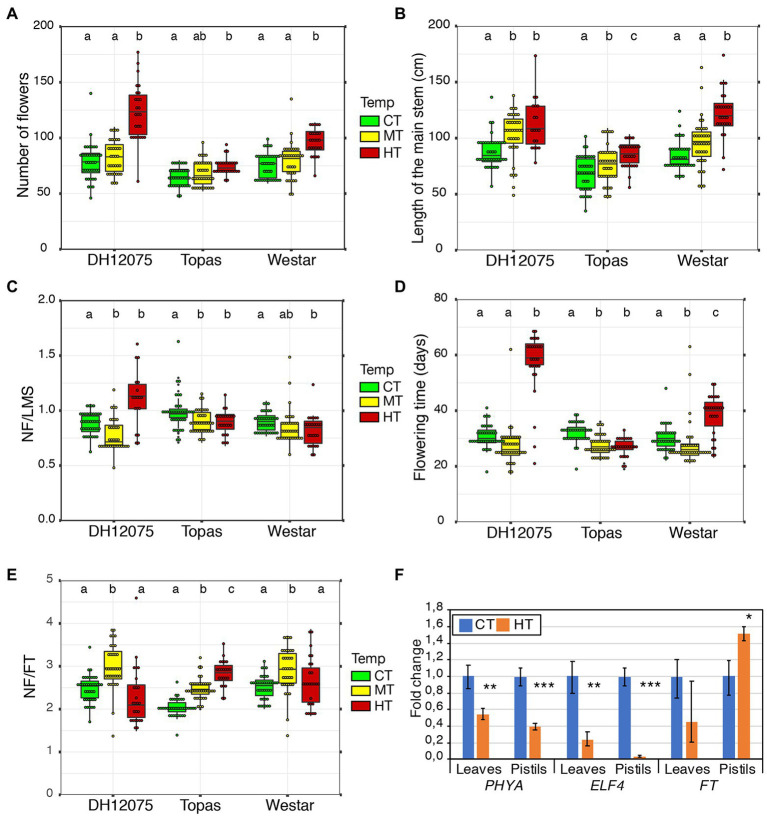
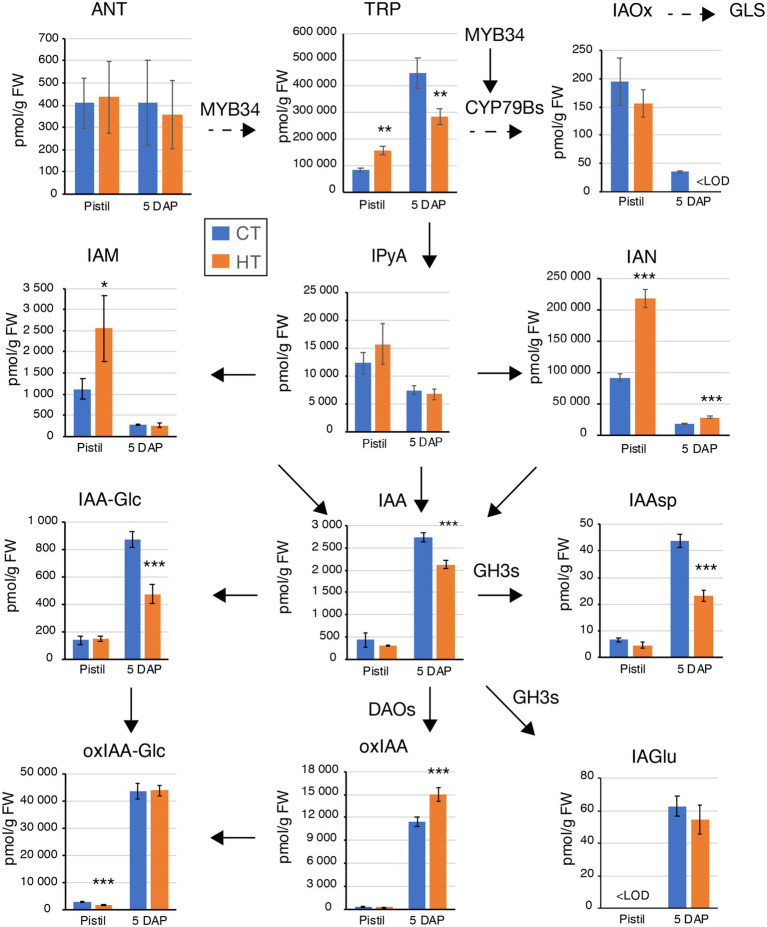
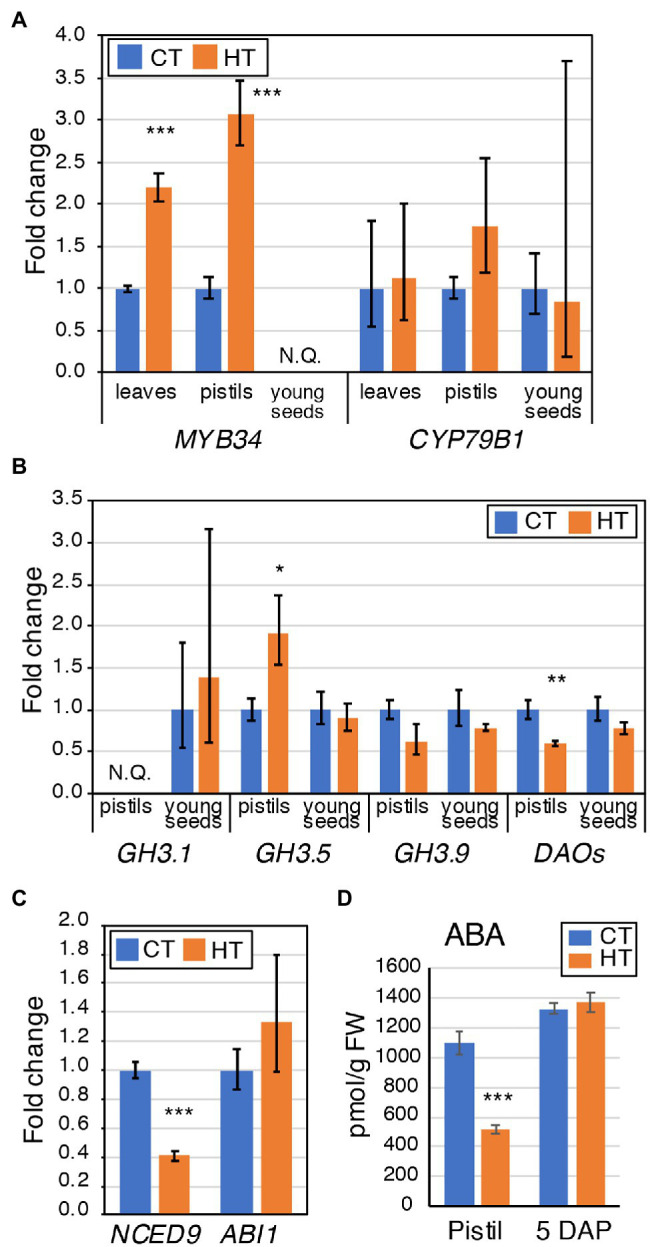
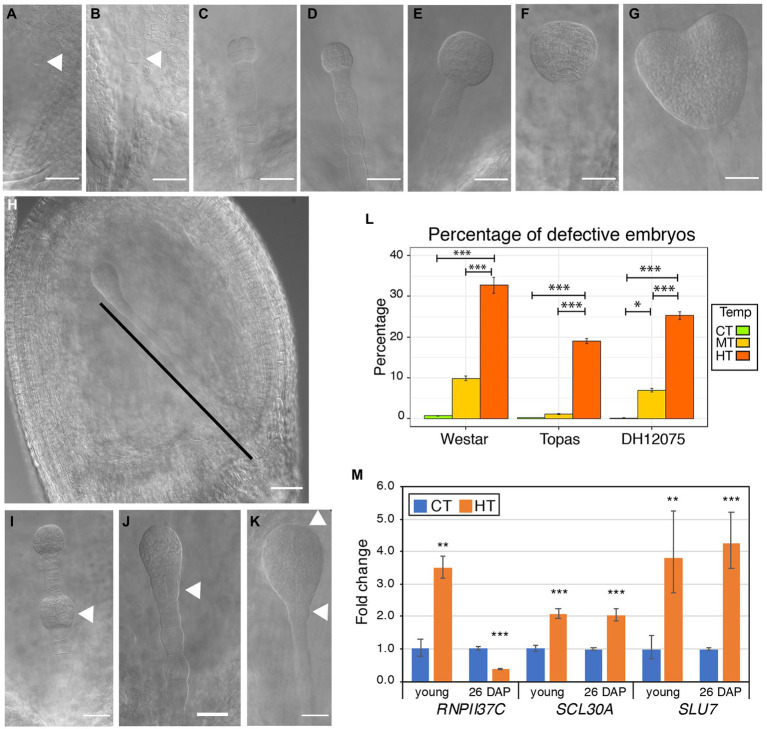
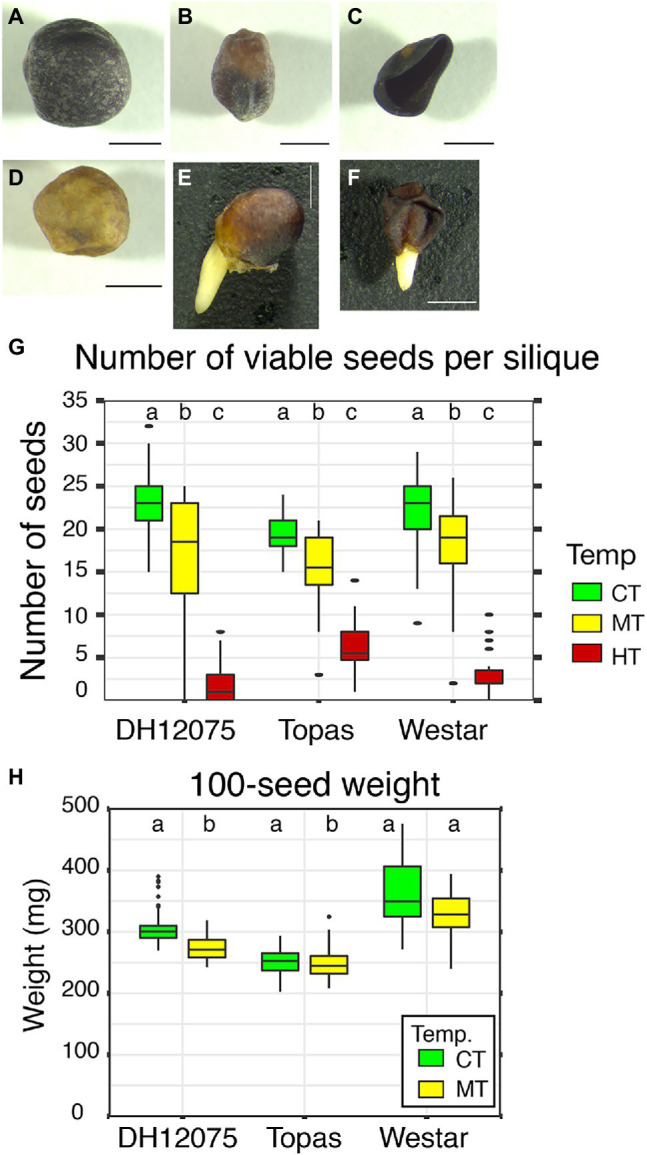
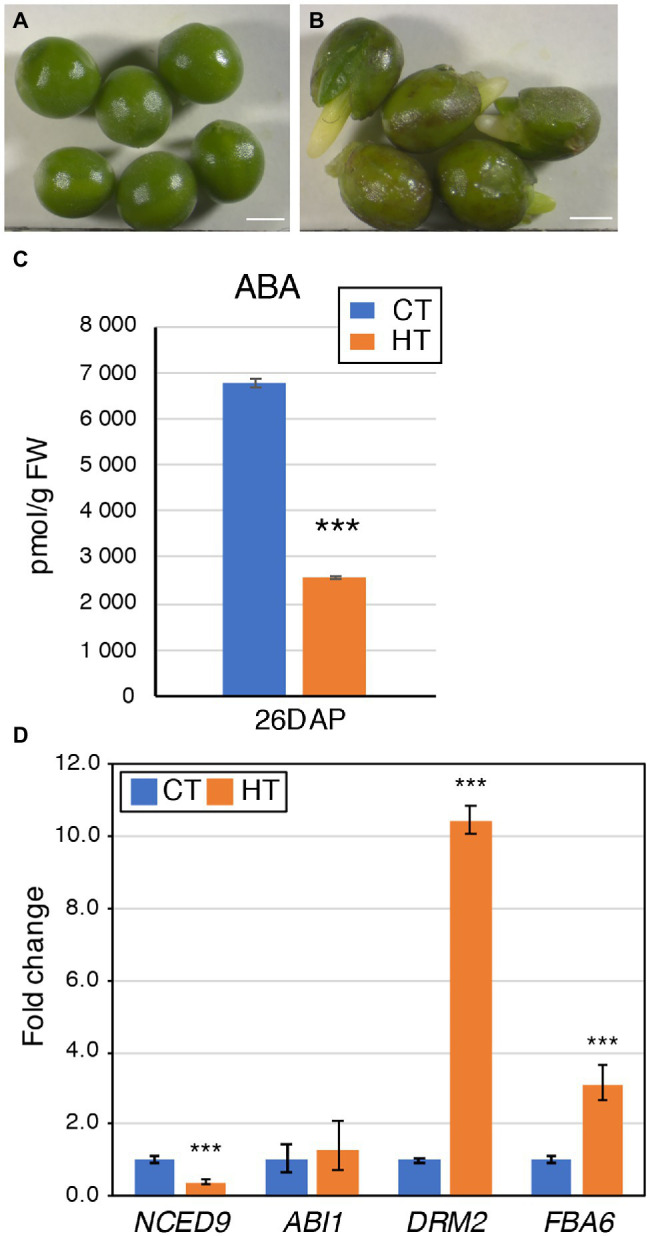
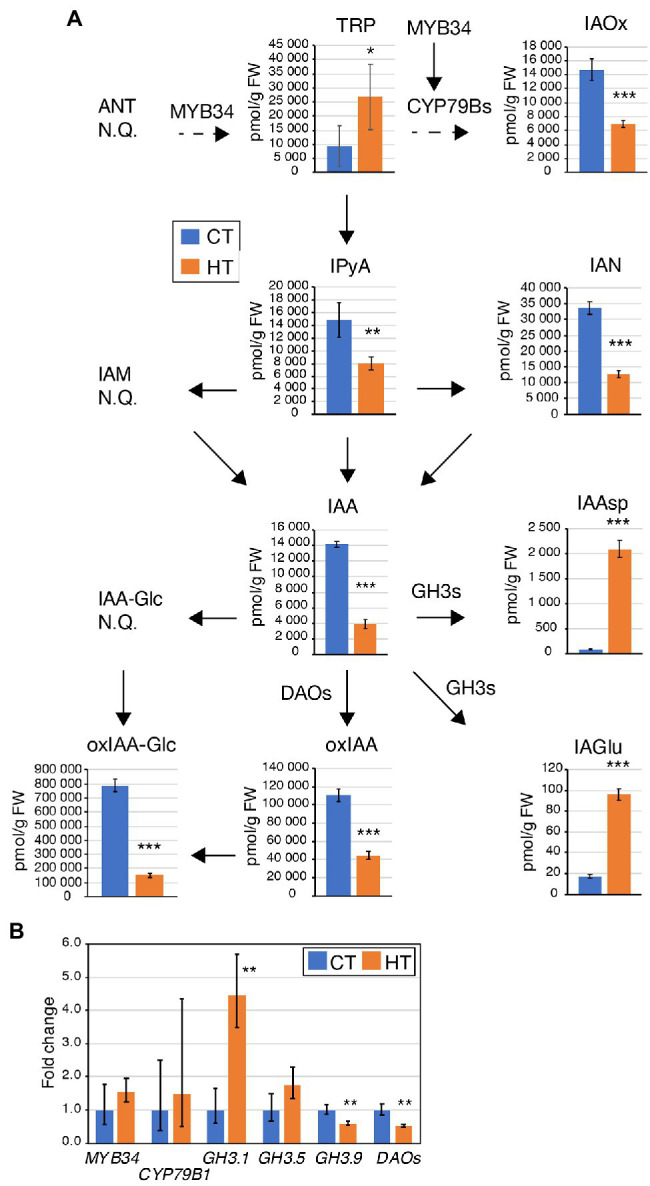
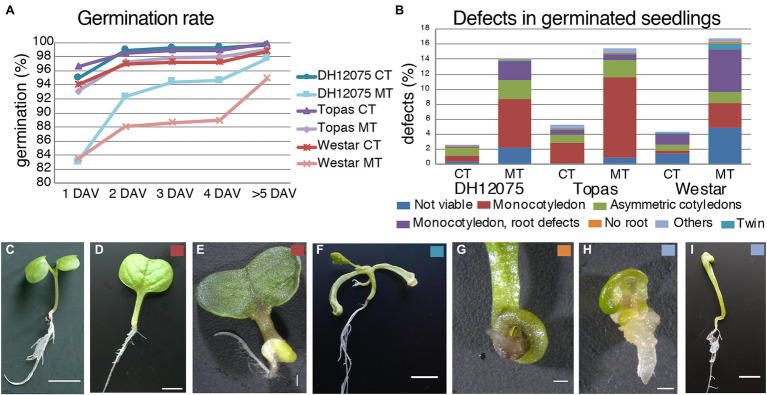
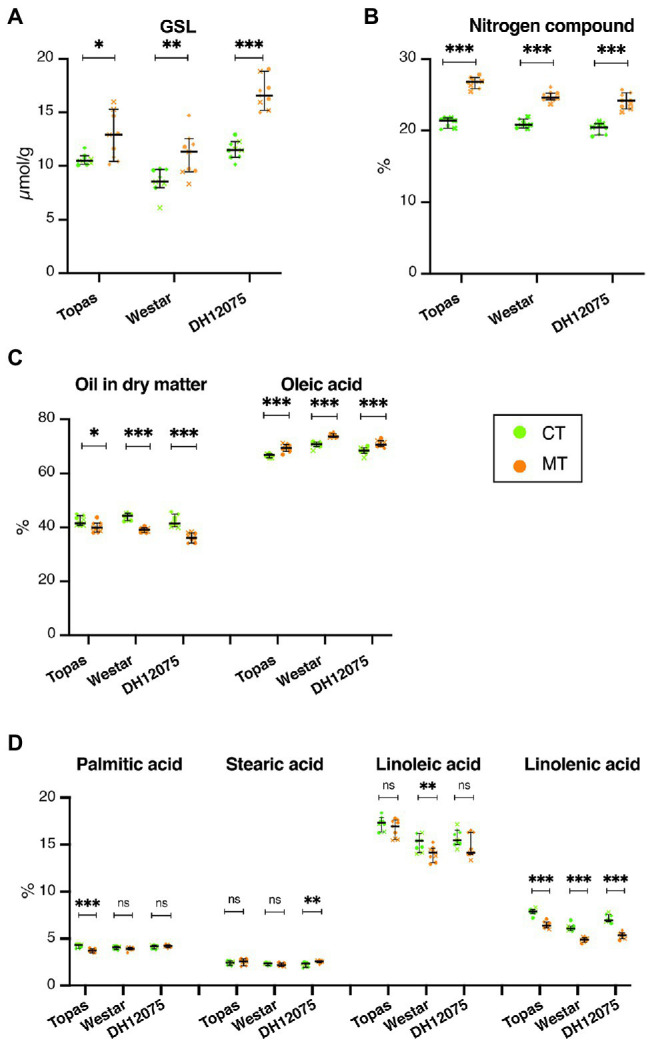
Brassica napus (rapeseed) is the second most important oilseed crop worldwide. Global rise in average ambient temperature and extreme weather severely impact rapeseed seed yield. However, fewer research explained the phenotype changes caused by moderate-to-high temperatures in rapeseed. To investigate these events, we determined the long-term response of three spring cultivars to different temperature regimes (21/18°C, 28/18°C, and 34/18°C) mimicking natural temperature variations. The analysis focused on the plant appearance, seed yield, quality and viability, and embryo development. Our microscopic observations suggest that embryonic development is accelerated and defective in high temperatures. Reduced viable seed yield at warm ambient temperature is due to a reduced fertilization rate, increased abortion rate, defective embryonic development, and pre-harvest sprouting. Reduced auxin levels in young seeds and low ABA and auxin levels in mature seeds may cause embryo pattern defects and reduced seed dormancy, respectively. Glucosinolates and oil composition measurements suggest reduced seed quality. These identified cues help understand seed thermomorphogenesis and pave the way to developing thermoresilient rapeseed.

Keywords: Brassica napus; embryo development; high temperatures; hormonal profiling; oil content; seed development; thermomorphogenesis.


Conflict of interest statement

The authors declare that the research was conducted in the absence of any commercial or financial relationships that could be construed as a potential conflict of interest.

Figures

Figure 1
Figure 1
Effects of high temperatures on flowering traits and seed production. (A–E) The number of flowers (NF; A), the length of the main stem (LMS; B), the number of flowers per cm of inflorescence (NF/LMS; C), the flowering time (FT; D), and the number of flowers per day (NF/FT; E) were quantified in DH12075, Topas, and Westar cultivars at CT (green), MT (yellow) and HT (red). The data are presented as boxplots. The box represents the interquartile range, and the line inside the box represents the median. Each dot represents a measurement. The Pearson correlation coefficient between LSM, FT, and NF, is shown in Supplementary Table S2. Boxes with the same letters (a, b, and c) within each cultivar do not differ significantly (p < 0.05). (F) Expression analysis by RT-qPCR of BnaPHYA, BnaELF4, and BnaFT in Westar leaves and pistils. The graph displays the fold changes in expression between CT (blue) and HT (orange). Asterisks indicate statistically significant difference in HT in a paired Student’s t-test (t-test; *, **, and *** correspond to value of p 0.05 > p > 0.01, 0.01 > p > 0.001, and p < 0.001, respectively). Primers and LOC information are presented in Supplementary Table S1.
Figure 2
Figure 2
Differences in auxin and auxin metabolites levels induced by high temperatures in Westar pistils and 5 days after pollination (DAP) seeds. Graphs displaying the levels (pmol/g FW) of anthranilate (ANT), tryptophan (TRP), indole-3-acetaldoxime (IAOx), indole-3-pyruvic acid (IPyA), indole-3-acetamide (IAM), indole-3-acetonitrile (IAN), indole-3-acetic acid (IAA), IAA-glucose (IAA-Glc), IAA-aspartate (IAAsp), IAA-glutamate (IAGlu), 2-oxoindole-3-acetic acid (oxIAA), and oxIAA-glucose (oxIAA-Glc). Measurements were done in two biological replicates, five technical replicates in Westar pistils and 5 DAP seeds from plants grown at CT (blue) and HT (orange). Shown is the average ± SD of one of the two biological replicates. t-test (t-test; *, **, and *** correspond to value of p 0.05 > p > 0.01, 0.01 > p > 0.001, and p < 0.001, respectively). Arrows indicate the direction of the biosynthesis pathway (plain arrow, direct reaction; dashed arrow, multiple-step enzymatic reactions). The names closed to the arrows indicate the enzymes involved in the reactions and whose gene expression was tested in Figure 3. Source data are shown in Supplementary Table S3.
Figure 3
Figure 3
Expression analysis of genes involved in auxin homeostasis and ABA levels in Westar leaves, pistils, and young seeds. (A) Expression analysis by RT-qPCR of BnaMYB4 and BnaCYP79Bs in Westar leaves (blue), pistils (orange), and young seeds (grey). (B) Expression analysis by RT-qPCR of BnaGH3.1 (blue), BnaGH3.5 (orange), BnaGH3.9 (grey), and BnaDAOs (yellow) in Westar leaves, pistils, and young seeds. NQ, not quantified. (C) Expression analysis by RT-qPCR of BnaNCED9 and BnaABA1 in Westar pistils (blue). (A–C) The graphs display the fold changes in expression between CT (blue) and HT (orange). Asterisks indicate statistically significant difference in HT in a paired Student’s t-test (t-test; *, **, and *** correspond to value of p 0.05 > p > 0.01, 0.01 > p > 0.001, and p < 0.001, respectively). Primers and LOC information are presented in Supplementary Table S1. (D) Graph showing the ABA levels (in pmol/g FW) in Westar pistils and 5 DAP seeds grown at CT and HT. Shown is the average ± SD. Asterisks indicate a statistically significant difference in HT in a paired Student’s t-test (t-test; *** corresponds to value of p < 0.001). Source data are presented in Supplementary Table S4.
Figure 4
Figure 4
Effects of high temperatures on embryo development. (A–G) Representative photos of embryos of Brassica napus plants grown at CT. The developmental stages of the embryos are one-cell (A), two-cell (B), 8-cell (C), early globular (D), late globular (E), transition (F), and heart (G). The arrowheads in (A,B) indicate the apical cell and proembryo. (H–K) Range of defective embryos observed in B. napus plants grown at MT and HT between 6 and 8 DAP. (H) Seed containing an embryo with supernumerary suspensor cells. The black line marks the suspensor. (I) Embryo (7 DAP) with cell proliferation in the suspensor, leading to a secondary embryo (arrowhead). (J) Embryo (7 DAP) with cell proliferation in the root pole (arrowhead). (K) Embryo (8 DAP) without initiation of cotyledon primordia and with unstructured root pole (arrowheads). Scale bars represent 50 μm (A–K). Uncropped pictures are presented in Supplementary Figure S5. (L) Graph displaying the percentage of defective embryos in young seeds of Westar, Topas, and DH12075 plants grown at CT (green), MT (yellow), and HT (orange). Error bars represent the 95% CI. Asterisks indicate a statistically significant difference in MT and HT in an ANOVA followed by Tukey’s post hoc test (* and *** correspond to value of p 0.05 > p > 0.01 and p < 0.001, respectively). (M) Expression analysis by RT-qPCR of BnaRNPII37C, BnaSCL30A, and BnaSLU in Westar young seeds and 26 DAP seeds. The graph displays the fold changes in expression between CT (blue) and HT (orange). Asterisks indicate statistically significant difference in HT in a paired Student’s t-test (t-test; ** and *** correspond to value of p 0.01 > p > 0.001 and p < 0.001, respectively). Primers and LOC information are presented in Supplementary Table S1.
Figure 5
Figure 5
Effects of high temperatures on seed development. (A–F) Range of phenotypes observed in mature seeds. We observed normal fully filled seed (A), partially filled seed (B), flatten shrunken seed (C), partially filled yellow seed (D), sprouting fully filled seed (E), sprouting flatten shrunken seed (F). Scale bars represent 1 mm. (G) Graph displaying the number of viable seeds per silique in DH12075, Topas, and Westar cultivars at CT (green), MT (yellow), and HT (red). (H) Graph displaying 100-seed weight in DH12075, Topas, and Westar cultivars at CT (21/18°C, green) and MT (28/18°C, yellow). The data (G,H) are presented in boxplots. The box represents the interquartile range, and the black line inside the box represents the median. Dots represent outliers. Boxes with the same letters (a, b, and c) within each cultivar do not differ significantly (p < 0.05).
Figure 6
Figure 6
Pre-harvest sprouting seed phenotypes may be linked to a decrease in ABA levels. (A,B) Topas 26 DAP seeds grown at CT (A) and HT (B). Notice the sprouting of the seeds (B), with the emergence of either root or cotyledons. Scale bars represent 1 mm. (C) Graph showing the ABA levels (in pmol/g FW) in Westar 26 DAP seeds grown at CT and HT. Shown is the average ± SD. Asterisks indicate a statistically significant difference in HT in a paired Student’s t-test (t-test; *** corresponds to value of p < 0.001). Source data are presented in Supplementary Table S4. (D) Expression analysis by RT-qPCR of BnaNCED9, BnaABA1, BnaFBA6, and BnaDRM2 in Westar 26 DAP seeds. The graph displays the fold changes in expression between CT (blue) and HT (orange). Asterisks indicate a statistically significant difference in HT in a paired Student’s t-test (t-test; *** corresponds to value of p < 0.001). Primers and LOC information are presented in Supplementary Table S1.
Figure 7
Figure 7
Differences in auxin and auxin metabolites levels and enzyme expression induced at HT in Westar 26 DAP seeds. (A) Graphs displaying the levels (pmol/g FW) of tryptophan (TRP), indole-3-acetaldoxime (IAOx), indole-3-pyruvic acid (IPyA), indole-3-acetonitrile (IAN), indole-3-acetic acid (IAA), IAA-aspartate (IAAsp), IAA-glutamate (IAGlu), 2-oxoindole-3-acetic acid (oxIAA) and oxIAA-glucose (oxIAA-Glc). Anthranilate (ANT), indole-3-acetamide (IAM), IAA-glucose (IAA-Glc) were not quantified (NQ). Measurements were done in two biological replicates, five technical replicates in Westar 26 DAP seeds from plants grown at CT (blue) and HT (orange). Shown is the average ± SD of one of the two biological replicates. Asterisks indicate statistically significant difference in HT in a paired Student’s t-test (t-test; *, **, and *** correspond to value of p 0.05 > p > 0.01, 0.01 > p > 0.001, and p < 0.001, respectively). Arrows indicate the direction of the biosynthesis pathway (plain arrow, direct reaction; dashed arrow, multiple-step enzymatic reactions). The names closed to the arrows indicate the enzymes involved in the reactions and whose gene expression was tested (B). Source data are shown in Supplementary Table S3. (B) Expression analysis by RT-qPCR of BnaMYB4, BnaCYP79Bs, BnaGH3.1, BnaGH3.5, BnaGH3.9, and BnaDAOs in Westar 26 DAP seeds. The graph displays the fold changes in expression between CT (blue) and HT (orange). Asterisks indicate statistically significant difference in HT in a paired Student’s t-test (t-test; ** corresponds to value of p 0.01 > p > 0.001). Primers and LOC information are presented in Supplementary Table S1.
Figure 8
Figure 8
Seed development at high temperatures affects seedling viability. (A) Graph displaying the cumulative percentage of seed germination at 1, 2, 3, and 4 day after vernalization (DAV), and later for seeds produced by DH12075, Topas, Westar plants grown at CT and MT. (B) Percentage of defective seedlings per categories of defects: not viable (dark blue), with one cotyledon (red), asymmetrically positioned cotyledons (green), twin seedlings (turquoise), with one cotyledon, and defective root (purple), without any root (orange) and other categories (light blue). The analysis was performed on seedlings from seeds produced by DH12075, Topas, Westar plants grown at CT and MT. (C–I) Range of observed seedling phenotypes. A wild-type seedling is shown (C). Seedlings (D,E) are with one cotyledon (red). (F) The seedling is with two roots and two shoots (turquoise). (G) Zoom in of a seedling without root (orange). (H,I) Are shown seedlings from the other categories (light blue). The small colored square in the upper right corner refers to the categories. Scale bars represent 10 mm.
Figure 9
Figure 9
Differences in Glucosinolates (GSL), Nitrogen, and seed oil levels induced at MT. (A–D) Graphs are displaying the levels of glucosinolates (GSL in 9% humidity, μmol/g; A), nitrogen compound (%; B), total oil in dry matter (%) and oleic acid (% of total oil; C), palmitic acid (% of total oil), stearic acid (% of total oil), linoleic acid (% of total oil) and linolenic acid (% of total oil; D) at CT (green) and MT (orange) in Topas, Westar and DH12075 cultivars. The data from three biological replicates are plotted (•, replicate 1; ×, replicate 2; ♦, replicate 3). The horizontal line represents the median with 95% CI. Asterisks indicate statistically significant difference in MT in a paired Student’s t-test (t-test; *, **, and *** correspond to value of p 0.05 > p > 0.01, 0.01 > p > 0.001, and p < 0.001, respectively). Source data are found in Supplementary Table S6. The measurements were done in three biological replicates, each in three technical replicates.

Similar articles

Cited by

References

    1. Aksouh-Harradj N. M., Campbell L. C., Mailer R. J. (2006). Canola response to high and moderately high temperature stresses during seed maturation. Can. J. Plant Sci. 86, 967–980. doi: 10.4141/p05-130 - DOI
    1. Alexander M. P. (1969). Differential staining of aborted and nonaborted pollen. Stain. Technol. 44, 117–122. doi: 10.3109/10520296909063335, PMID: - DOI - PubMed
    1. Andersen C. L., Jensen J. L., Ørntoft T. F. (2004). Normalization of real-time quantitative reverse transcription-PCR data: a model-based variance estimation approach to identify genes suited for normalization, applied to bladder and colon cancer data sets. Cancer Res. 64, 5245–5250. doi: 10.1158/0008-5472.can-04-0496, PMID: - DOI - PubMed
    1. Angadi S. V., Cutforth H. W., Miller P. R., McConkey B. G., Entz M. H., Brandt S. A., et al. . (2000). Response of three brassica species to high temperature stress during reproductive growth. Can. J. Plant Sci. 80, 693–701. doi: 10.4141/P99-152 - DOI
    1. Annisa A., Chen S., Turner N. C., Cowling W. A. (2013). Genetic variation for heat tolerance during the reproductive phase in Brassica rapa. J. Agron. Crop Sci. 199, 424–435. doi: 10.1111/jac.12034 - DOI

LinkOut - more resources