Review
. 2022 Apr 26:2022:8729003.
doi: 10.1155/2022/8729003. eCollection 2022.

Effect of PCSK9 Inhibitor on Blood Lipid Levels in Patients with High and Very-High CVD Risk: A Systematic Review and Meta-Analysis

Affiliations
Review

Effect of PCSK9 Inhibitor on Blood Lipid Levels in Patients with High and Very-High CVD Risk: A Systematic Review and Meta-Analysis

Yue Zhang et al. Cardiol Res Pract. .

Abstract

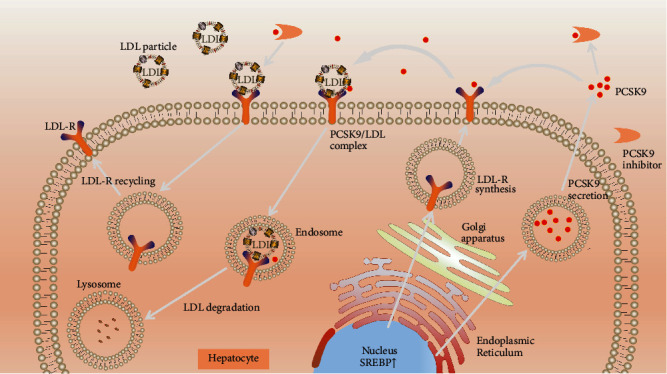
Objectives: We aimed to investigate the effects of proprotein convertase subtilisin/kexin type 9 (PCSK9) inhibitor on blood lipid levels in patients with high and very-high cardiovascular risk.

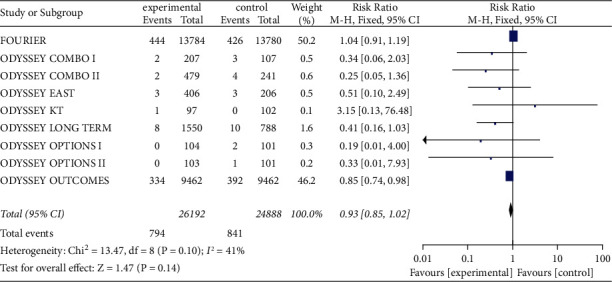
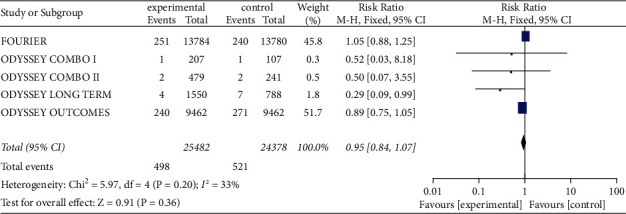
Design: 14 trials (n = 52,586 patients) comparing treatment with or without PCSK9 inhibitors were retrieved from PubMed and Embase updated to 1st Jun 2021. The data quality of included studies was assessed by two independent researchers using the Cochrane systematic review method. All-cause mortality, cardiovascular mortality, and changes in serum low-density lipoprotein cholesterol (LDL-C), total cholesterol (TC), triglyceride (TG), apolipoprotein B (ApoB), lipoprotein (a) (LP (a)), non-high-density lipoprotein cholesterol (non-HDL-C), high-density lipoprotein cholesterol (HDL-C), and apolipoprotein A1 (ApoA1) from baseline were analyzed using Rev Man 5.1.0 software.

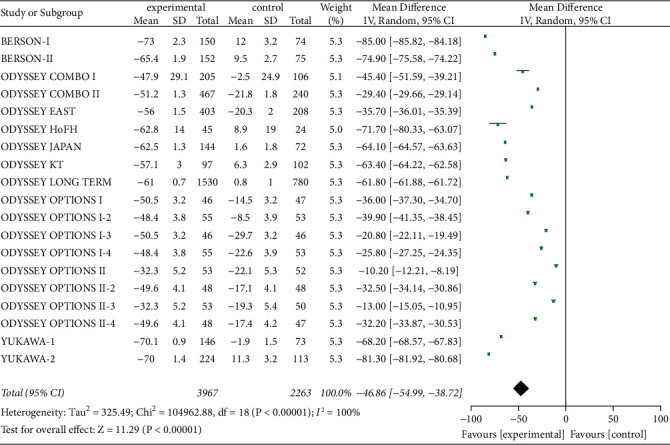
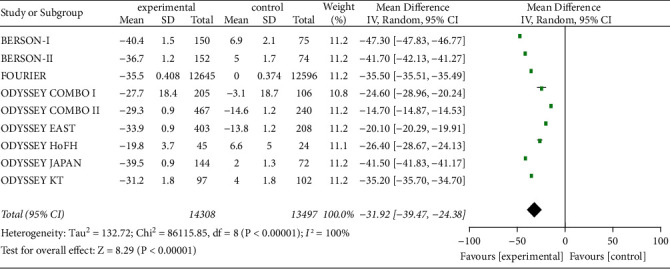
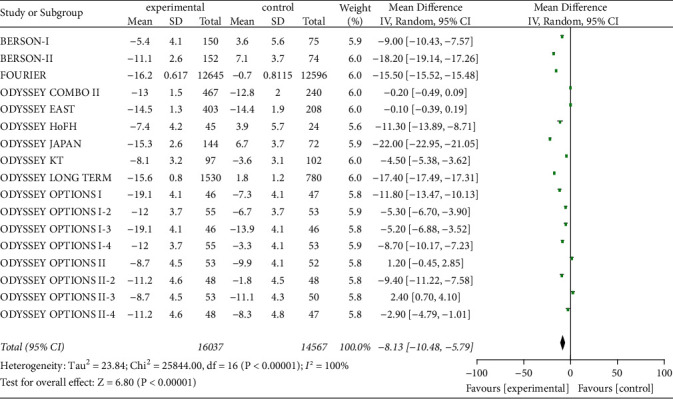
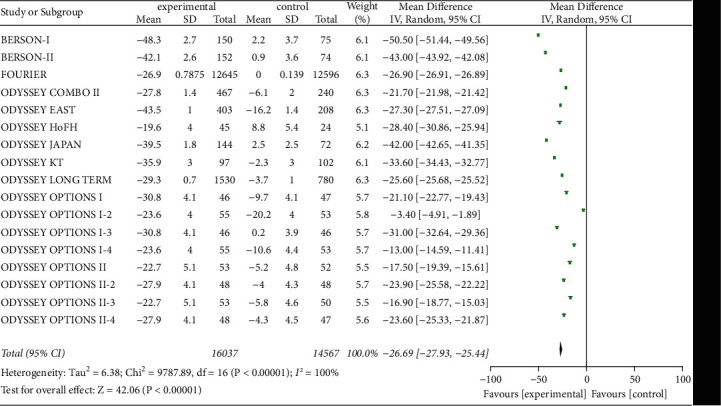
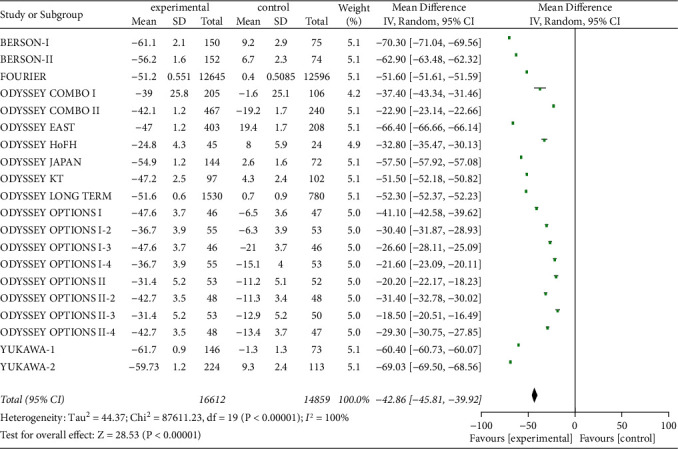
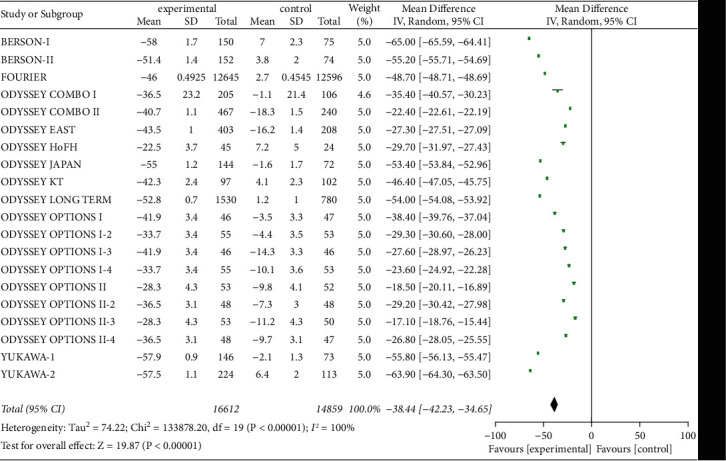
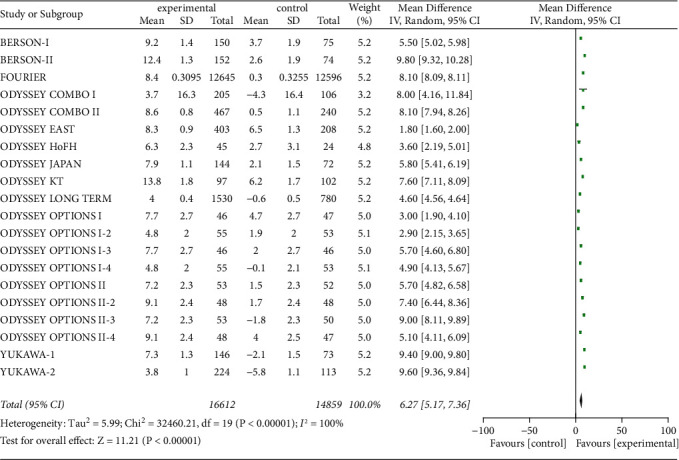
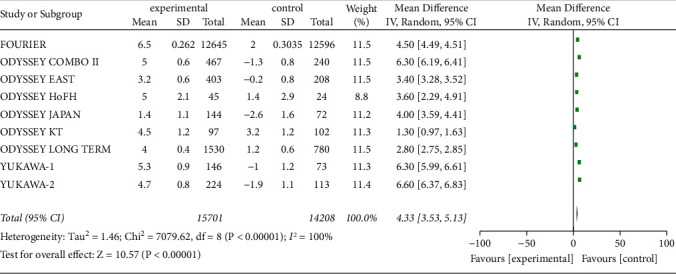
Results: Compared with treatments without PCSK9 inhibitor, addition of PCSK9 inhibitors (evolocumab and alirocumab) had obvious decreasing effects on the levels of LDL-C [MD = -46.86, 95% CI (-54.99 to -38.72), P < 0.00001], TC [MD = -31.92, 95% CI (-39.47 to -24.38), P < 0.00001], TG [MD = -8.13, 95% CI (-10.48 to -5.79), P < 0.00001], LP(a) [MD = -26.69, 95% CI (-27.93 to -25.44), P < 0.00001], non-HDL-C [MD = -42.86, 95% CI (-45.81 to -39.92), P < 0.00001], and ApoB [MD = -38.44, 95% CI (-42.23 to -34.65), P < 0.00001] in high CVD risk patients. Conversely, changes of HDL-C [MD = 6.27, CI (5.17 to 7.36), P < 0.00001] and ApoA1 [MD = 4.33, 95% CI (3.53 to 5.13), P < 0.00001] from baseline were significantly more in high cardiovascular disease risk patients who received PCSK9 inhibitors treatment.

Conclusion: Addition of PCSK9 inhibitors to standard therapy resulted in definite improvement in blood lipid levels compared with therapies that did not include them.


Conflict of interest statement

The authors declare that there are no conflicts of interest.

Figures

Figure 1
Figure 1
Mechanism of PCSK9 inhibitors: LDLR binds to circulating LDL particles then LDLR/LDL complexes are internalized in endosomes. In the endosome, LDL is carried to lysosome to be degraded when LDLR is recycled to the cell surface. When PCSK9 is present, it binds to LDLR to induce its internalization and degradation in lysosomes. This leads to decreased LDLR expression on the cell surface therefore increases circulating LDL-C levels.
Figure 2
Figure 2
The all-cause mortality between two groups.
Figure 3
Figure 3
The cardiovascular mortality between two groups.
Figure 4
Figure 4
Comparison of the reduction of serum LDL-C (%) from baseline between control group and experimental group.
Figure 5
Figure 5
Comparison of the reduction of serum TC (%) from baseline between control group and experimental group.
Figure 6
Figure 6
Comparison of the reduction of serum TG (%) from baseline between control group and experimental group.
Figure 7
Figure 7
Comparison of the reduction of serum Lp (a) (%) from baseline between control group and experimental group.
Figure 8
Figure 8
Comparison of the reduction of serum non-HDL-C (%) from baseline between control group and experimental group.
Figure 9
Figure 9
Comparison of the reduction of serum ApoB (%) from baseline between control group and experimental group.
Figure 10
Figure 10
Comparison of the rise of serum HDL-C (%) from baseline between control group and experimental group.
Figure 11
Figure 11
Comparison of the rise of serum ApoA1 (%) from baseline between control group and experimental group.

Similar articles

Cited by

References

    1. Roth G. A., Mensah G. A., Johnson C. O., et al. Global burden of cardiovascular diseases and risk factors, 1990-2019: update from the GBD 2019 study. Journal of the American College of Cardiology . 2020;76(25):2982–3021. doi: 10.1016/j.jacc.2020.11.010. - DOI - PMC - PubMed
    1. Francula-Zaninovic S., Nola I. A. Management of measurable variable cardiovascular disease’ risk factors. Current Cardiology Reviews . 2018;14(3):153–163. doi: 10.2174/1573403x14666180222102312. - DOI - PMC - PubMed
    1. Grundy S. M., Feingold K. R. South Dartmouth, MA, USA: In: Endotext, MDText.com, Inc.; 2000. Guidelines for the management of high blood cholesterol.
    1. Piepoli M. F., Hoes A. W., Agewall S., et al. European Guidelines on cardiovascular disease prevention in clinical practice. European Heart Journal . 2016;37(29):2315–2381. doi: 10.1093/eurheartj/ehw106. - DOI - PMC - PubMed
    1. Carr S. S., Hooper A. J., Sullivan D. R., Burnett J. R. Non-HDL-cholesterol and apolipoprotein B compared with LDL-cholesterol in atherosclerotic cardiovascular disease risk assessment. Pathology . 2019;51(2):148–154. doi: 10.1016/j.pathol.2018.11.006. - DOI - PubMed

LinkOut - more resources