. 2022 Mar;4(3):288-299.
doi: 10.1038/s42256-022-00455-x. Epub 2022 Mar 21.

Asymmetric Predictive Relationships Across Histone Modifications

Affiliations

Asymmetric Predictive Relationships Across Histone Modifications

Hongyang Li et al. Nat Mach Intell. 2022 Mar.

Abstract

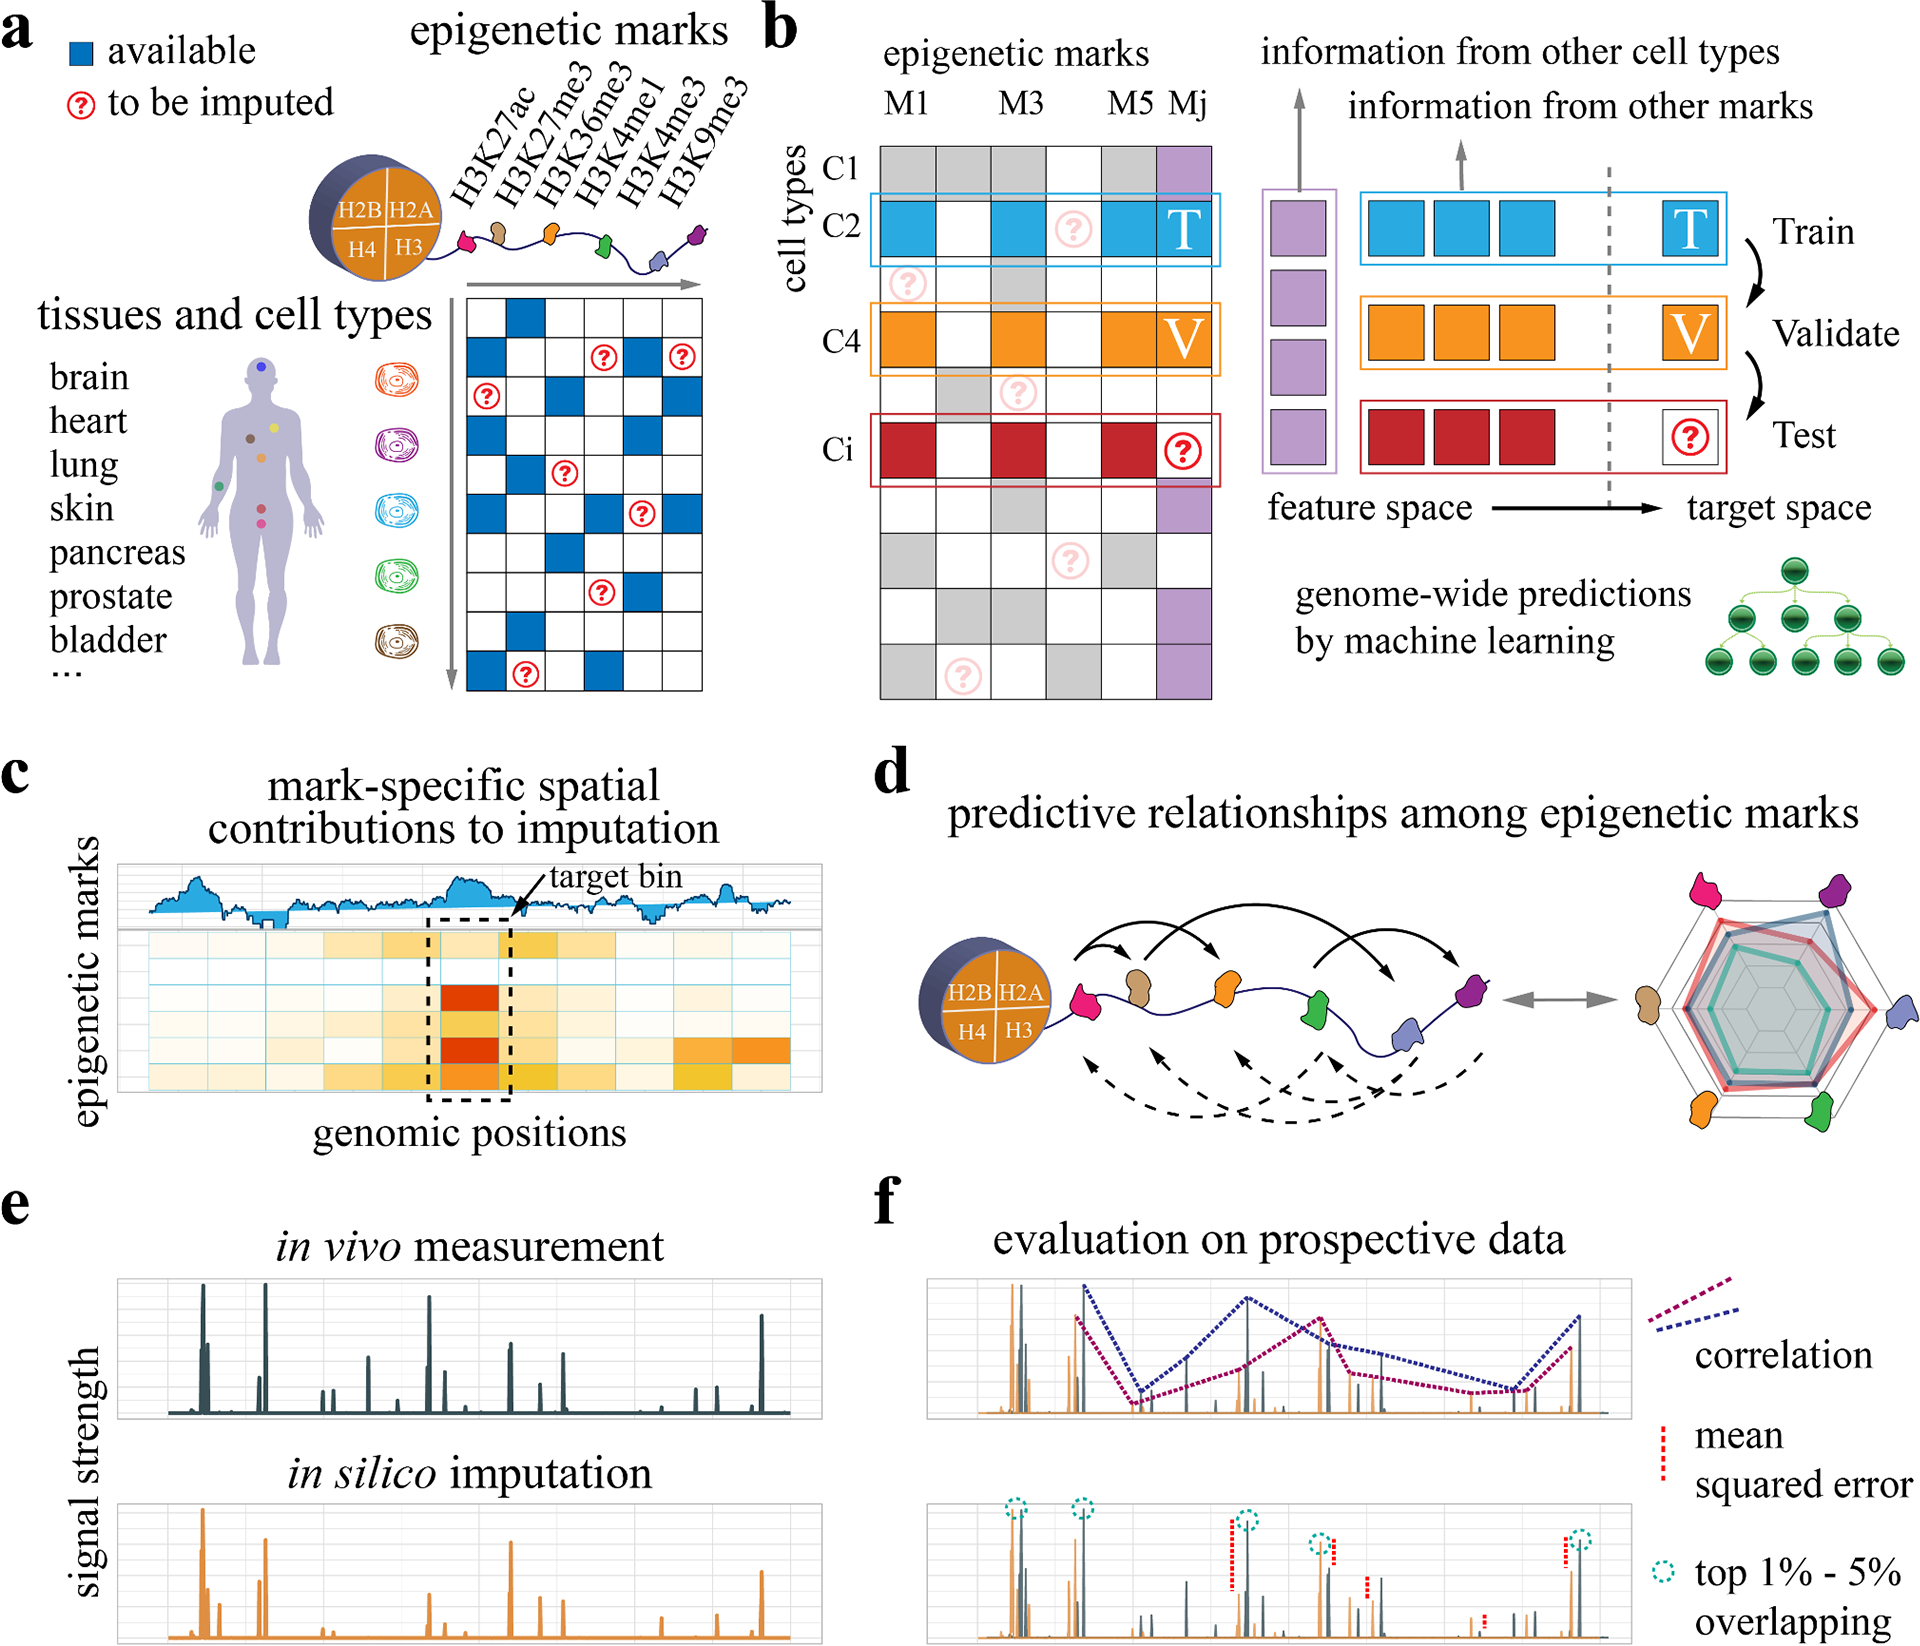
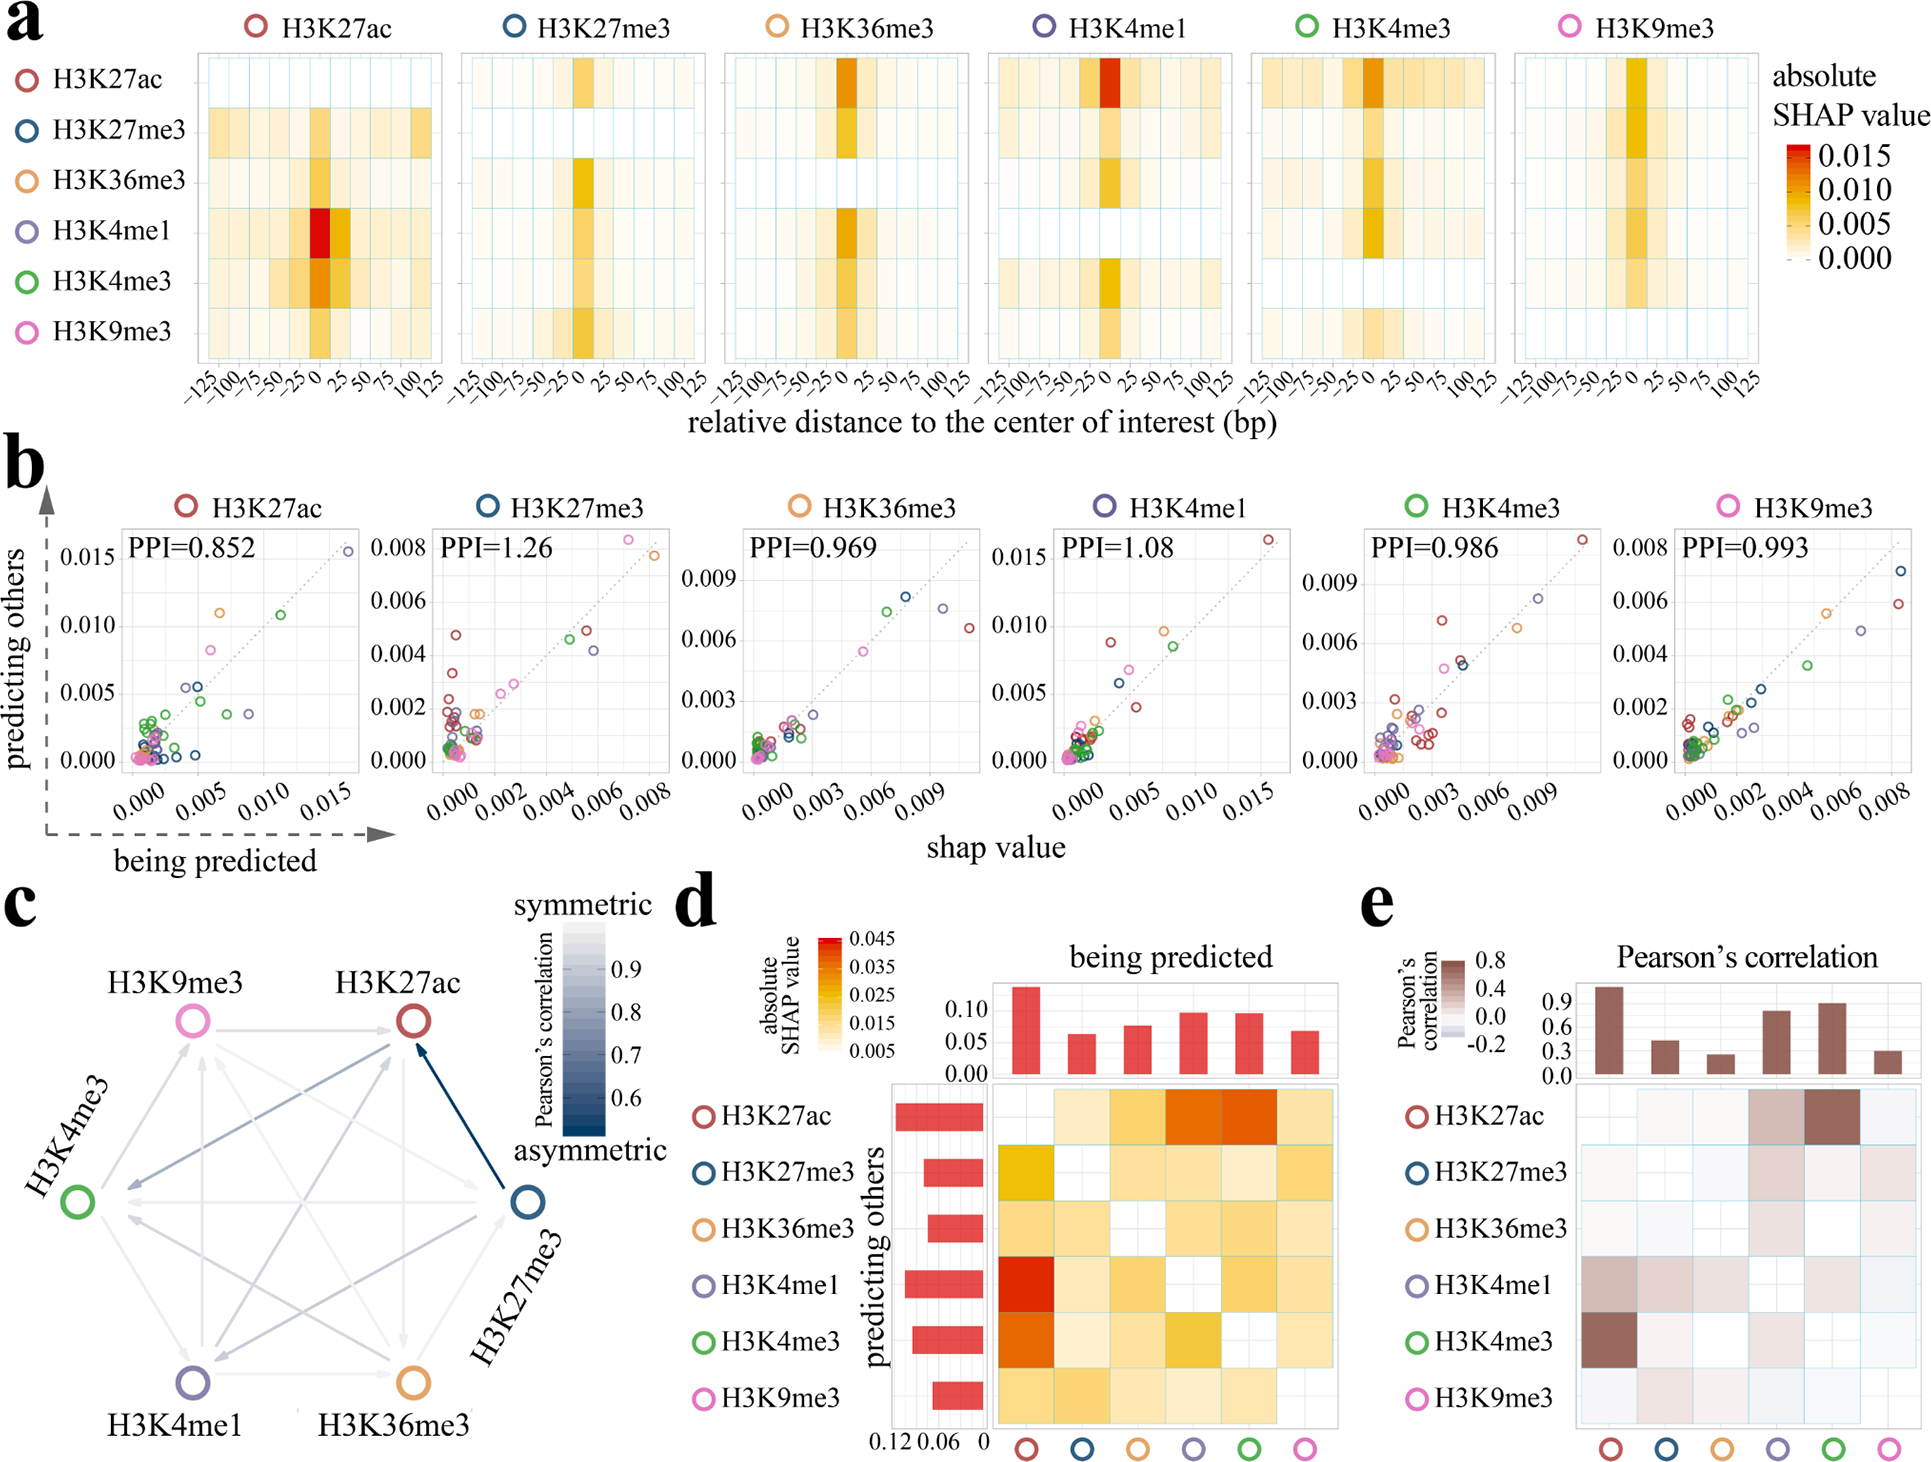
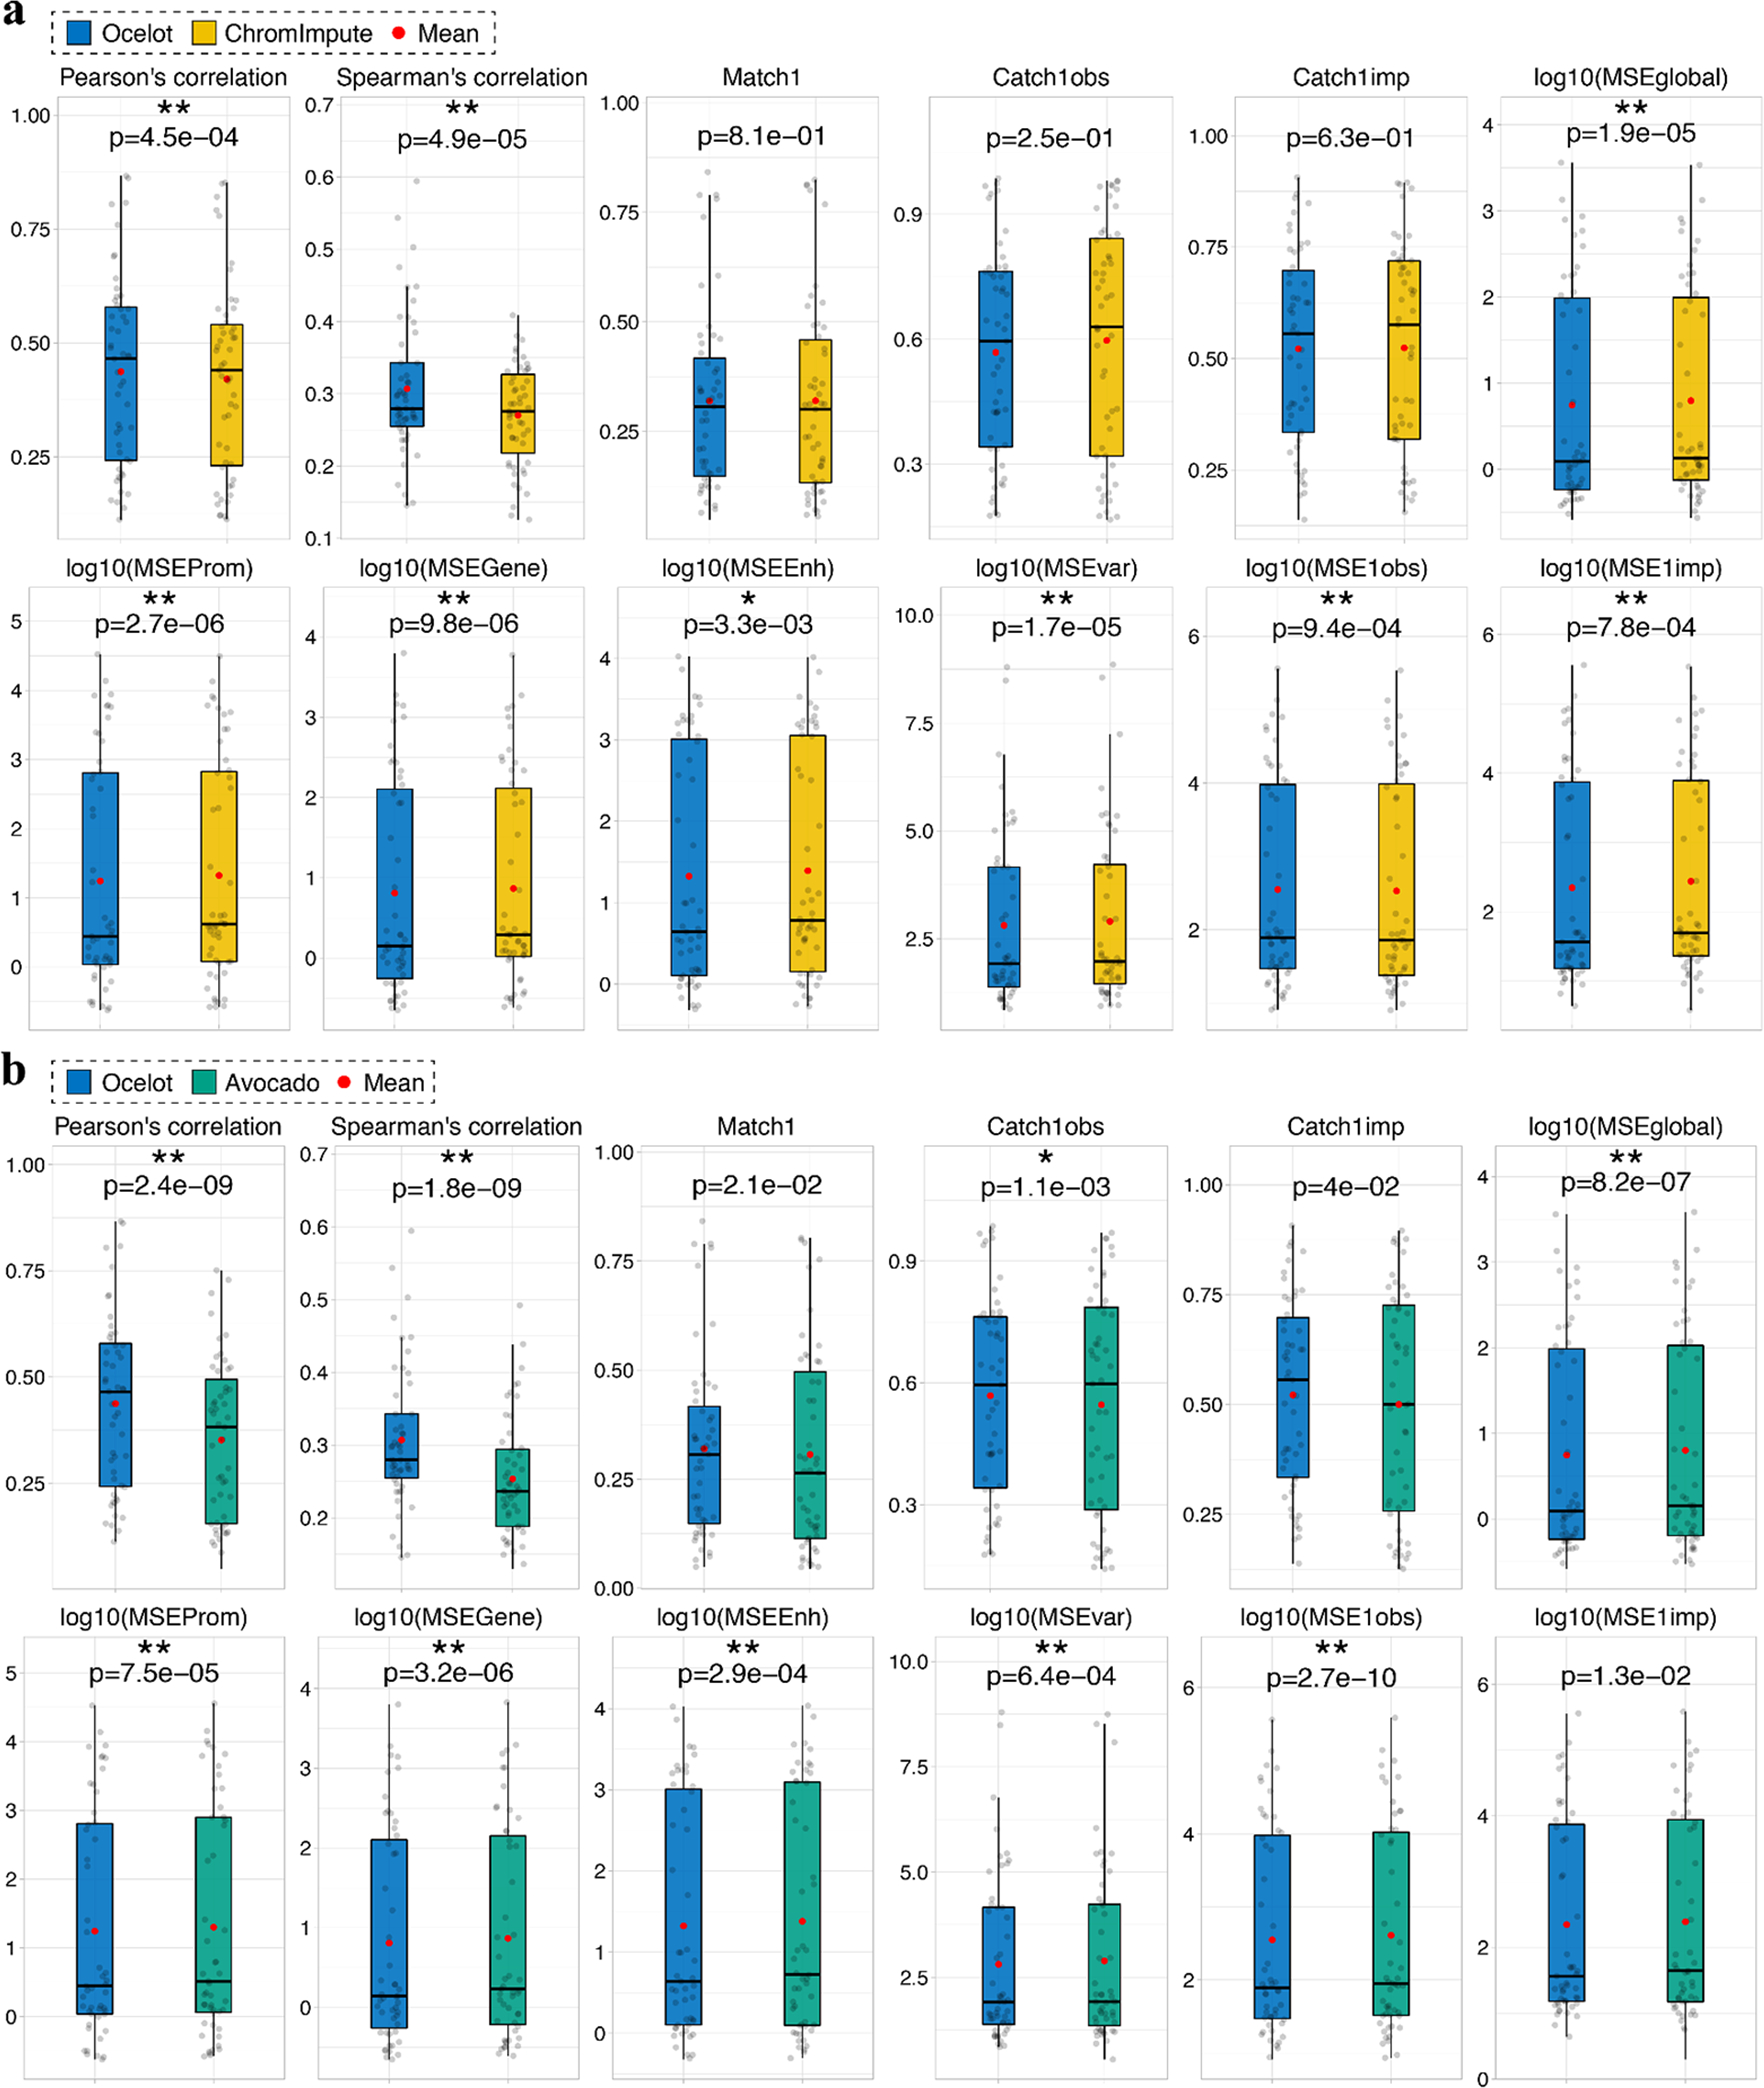
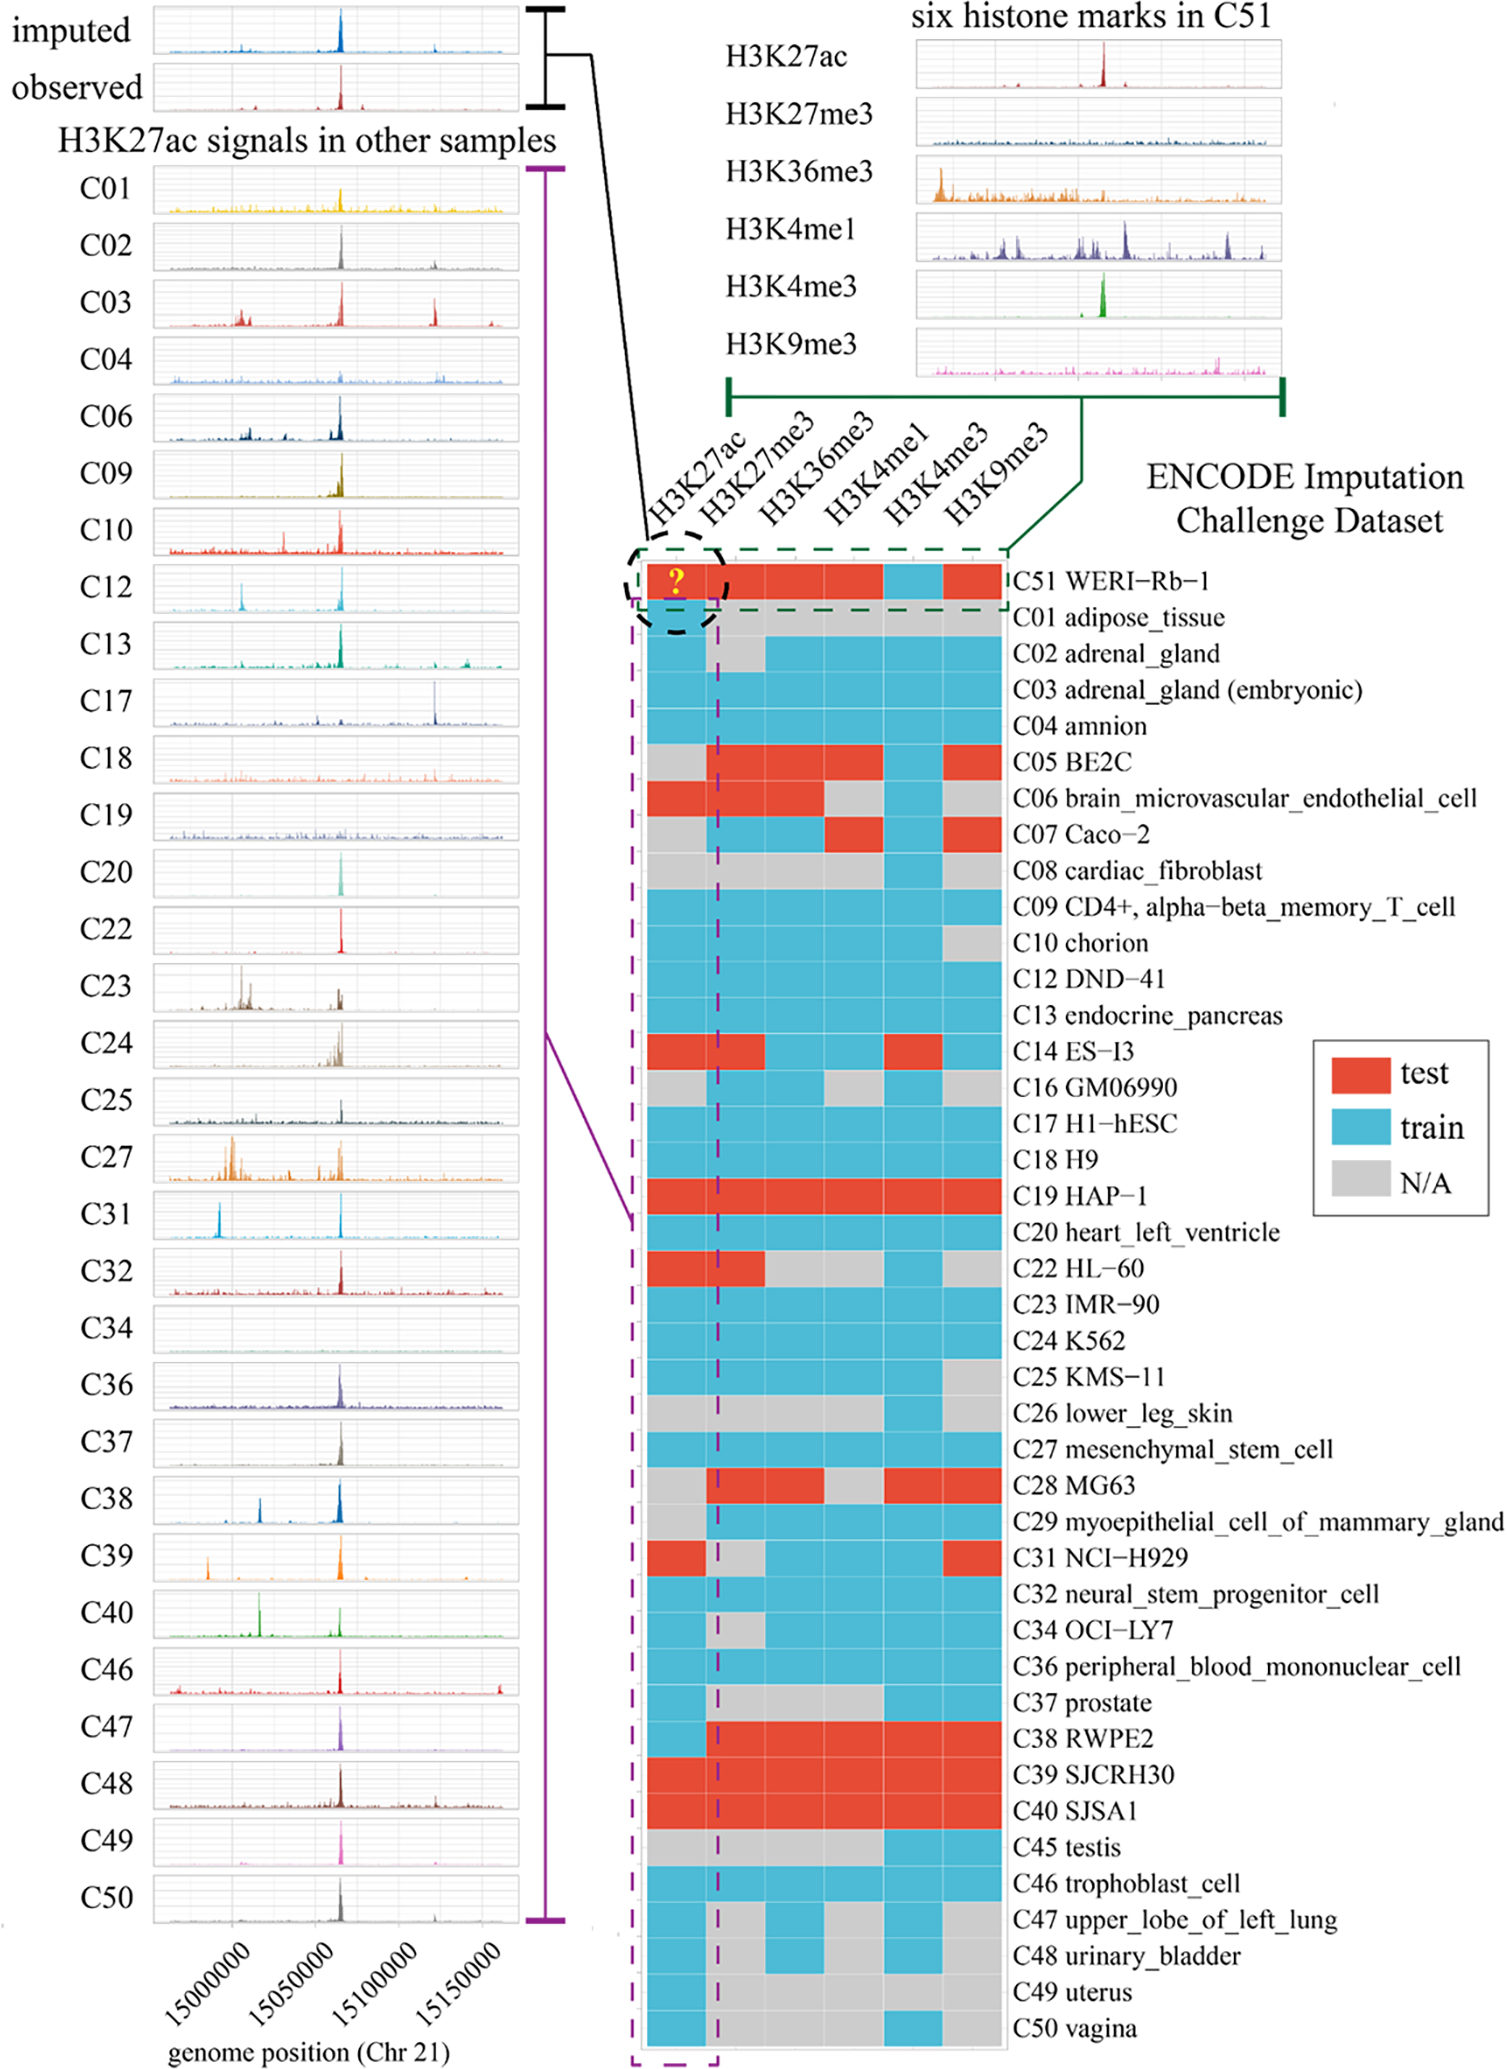
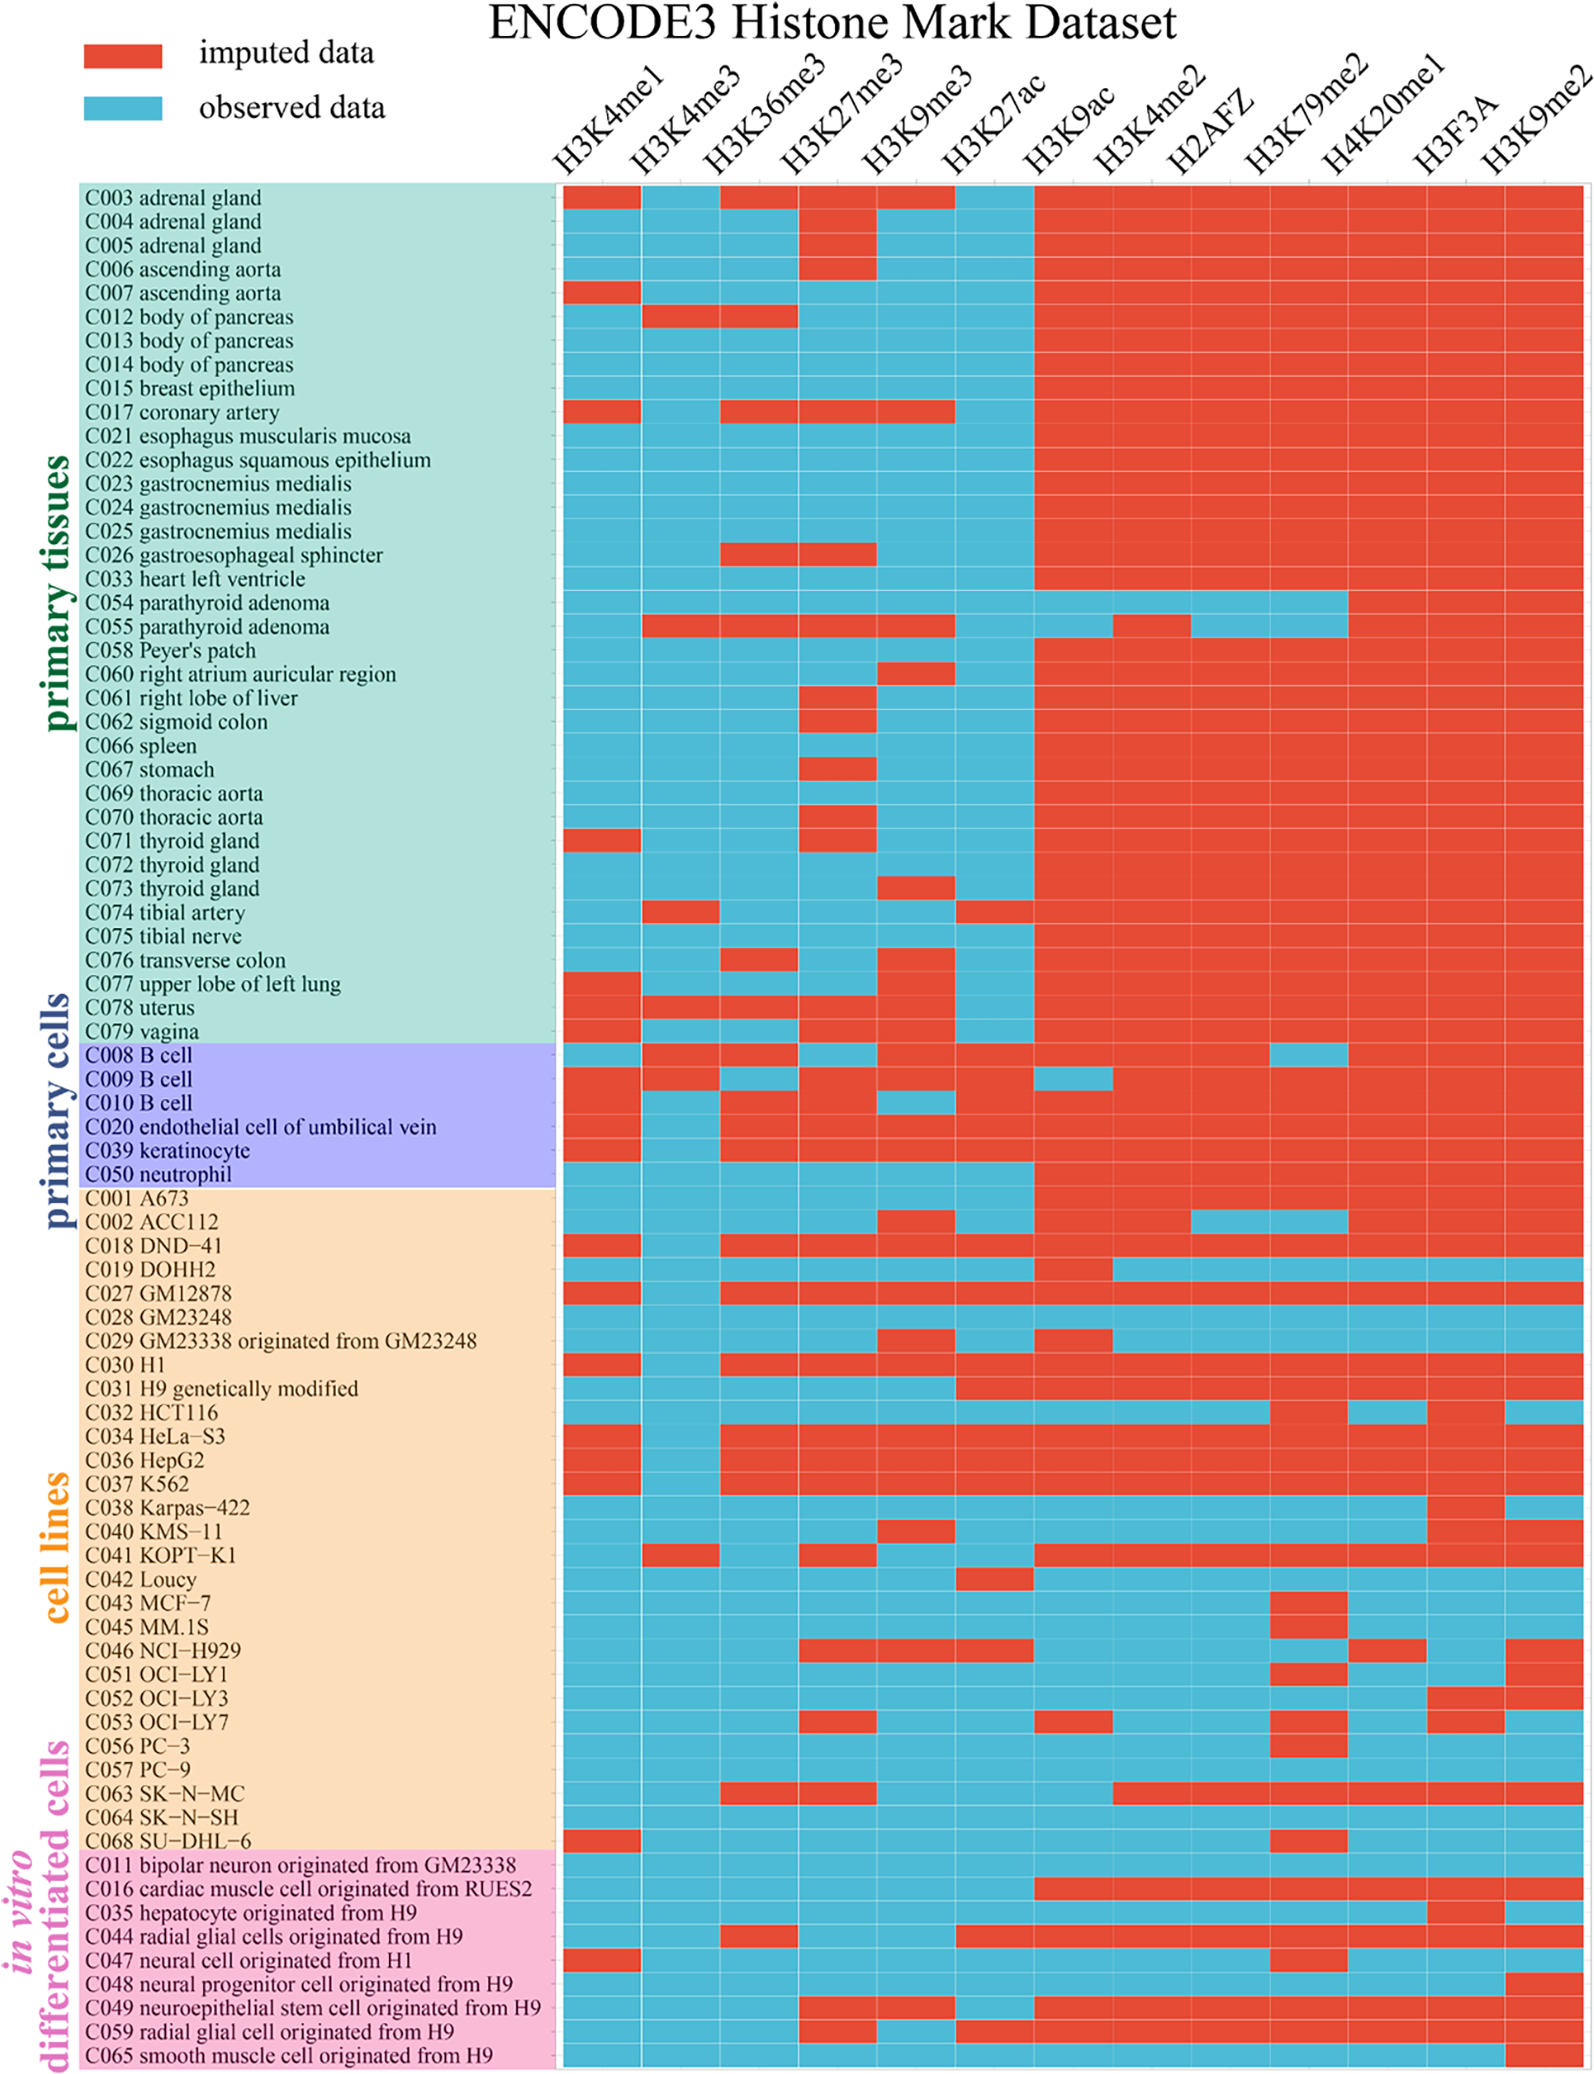
Decoding the epigenomic landscapes in diverse tissues and cell types is fundamental to understanding molecular mechanisms underlying many essential cellular processes and human diseases. Recent advances in artificial intelligence provide new methods and strategies for imputing unknown epigenomes based on existing data, yet how to reveal the predictive relationships among epigenetic marks remains largely unexplored. Here we present a machine learning approach for epigenomic imputation and interpretation. Through dissection of the spatial contributions from six histone marks, we reveal the prevalent and asymmetric cross-prediction relationships among these marks. Meanwhile, our approach achieved high predictive performance on held-out prospective epigenomes and outperformed the state-of-the-art. To facilitate future research, we further applied this approach to impute a total of 527 and 2,455 unavailable genome-wide histone modification signal tracks for the ENCODE3 and Roadmap datasets, respectively.

Keywords: Epigenome; Histone Modification; Machine Learning.


Figures

Figure 1:
Figure 1:. Overview of experimental design.
a, We develop machine learning models to impute genome-wide epigenetic signal tracks across cell types and investigate the regulatory relationships among epigenetic marks based on available data. b, For each cell type-mark combination to be imputed, we consider both the information from other cell types of the same mark and the information from other marks in the same cell type. The available data are partitioned into the training and validation sets to build machine learning models for epigenome imputation. c, To investigate the cross-prediction relationships among epigenetic marks, we dissect the machine learning models and extract the spatial contribution of each feature epigenetic mark to a target mark. d, The pairwise modulatory relationships among marks are summarized. The relationships are directional and asymmetric, where the solid and dashed arrows represent predicting others and being predicted respectively. e, The in silico imputation from our approach is compared with held-out in vivo measurement, which is collected prospectively to avoid information leakage or overfitting. f, The imputed data are compared with observed data based on multiple evaluation metrics, including correlations, mean squared errors (MSEs), and overlapping for the top 1% - 5% regions.
Figure 2:
Figure 2:. Schematic illustration of the tree-based model and neural network model design.
a, We first build a tree-based model through extracting features from both epigenomic tracks and DNA sequences. For each 25bp bin to be predicted, we consider the 5 upstream and 5 downstream bins to extract the neighboring information. For each 25bp bin, we calculate the (1) Maximum, (2) Minimum, (3) Mean, and (4) the Number of unique values as the “MMMN” features. Then for these 4 features, we further calculate the difference between this track and the average values across cell types, resulting in another 4 features - the “ΔMMMN” features. When Ntrack is the number of entries that are treated as feature entries, a total of 11×8×Ntrack feature values are extracted from the epigenetic tracks. In addition, the DNA sequences from the three 25bp bins are one-hot encoded into another 300 = 3×25×4 features. Then all these features are used to build a lightGBM model to predict one value of the target bin. b, In the neural network model, the signal tracks are directly used as inputs without feature extraction. Specifically, for each epigenomic entry treated as a feature entry, both the signal and Δsignal (the difference between this track and the average track across cell types) tracks are considered as two channels. The input length is 3200bp = 128 bins × 25bp. Then the DNA sequence is one-hot encoded into 4 nucleotide channels. When Ntrack tracks are considered as feature entries, the number of channels is (2×Ntrack + 4). Then we build a deep convolutional neural network with two encoders and one decoder. The building block of the encoders is Pooling-Convolution-Convolution (PCC) layers. There are four and two PCC blocks in encoder 1 and encoder 2, respectively. The building block of the decoder is Upscaling-Convolution-Convolution (UCC) layers and four UCC blocks are used in the decoder. The encoder 1 and decoder are further connected with concatenation layers to reduce information decay. Finally, 128 values are predicted simultaneously, corresponding to the 128 bins of the input.
Figure 3:
Figure 3:. Ocelot reveals the asymmetric and spatial cross-regulation of multiple histone modifications in epigenome imputation.
a, The SHAP analysis was performed on Ocelot models to reveal the pairwise cross-regulation between six histone modifications represented as six heatmaps. The histone marks along the six heatmap rows serve as predictors to predict other marks, whereas the marks along the column are the target to be predicted. Each row in a heatmap has 11 positions, covering the upstream −125bp to downstream +125bp around the center of the target 25bp bin to be predicted. High SHAP values are shown in red. For example, in the first heatmap the H3K4me1 row has a high SHAP value (the red block) in the center, indicating that H3K4me1 largely contributes to the prediction of H3K27ac at the center position. b, The pairwise comparison of SHAP values between two scenarios: (1) using mark A to predict mark B and (2) using mark B to predict mark A. For each histone mark, we compare it with the other 5 marks and represent these SHAP values as circles. The colors represent the other marks. For each color, there are 11 circles, corresponding to the 25bp bins around the center bin of interest in panel a. For example, in the first scatter plot, if a circle is above the diagonal dashed line, it indicates that H3K27ac has larger predictive power (higher SHAP values) as features in predicting the other marks. We define an indicator, Predictive Power Index (PPI), which is the ratio of the average SHAP value when this mark predicts others over the average SHAP value when other marks predict this mark. c, We further calculate Pearson’s correlation of SHAP values between (1) using mark A to predict mark B and (2) using mark B to predict mark A in all histone mark pairs. Lower correlation (dark blue) indicates higher level of asymmetry in cross-regulation and the direction of stronger prediction power is represented by the arrow. d, In addition to analysis at the 25bp bin level, the SHAP values of 11 bins in panel a are summed to obtain the matrix at the histone mark level. Each row and column of this matrix are also summed to obtain the accumulated SHAP values of predicting other marks (the bar plot on the top) and being predicted by other marks (the bar plot on the left). This matrix is asymmetric and directional. e, We also calculated the pairwise correlation among histone marks based on the average signal tracks from all training cell types. The accumulated correlations are shown as bars on the top. This correlation matrix is symmetric and undirected.
Figure 4:
Figure 4:. Predictive performance comparisons between Ocelot, ChromImpute and Avocado.
We benchmarked Ocelot with a, ChromImpute and b, Avocado, on 51 genome-wide mark profiles collected prospectively, including multiple histone modifications and chromatin accessibility (DNase-seq and ATAC-seq). Predictive performance was evaluated using 12 scoring metrics on the ENCODE Imputation Challenge testing set of 51 mark-cell type pairs. For each metric, the paired one-sided Wilcoxon signed-rank test was performed between two methods across 51 testing pairs. The significantly different ones are labeled by asterisks (* p-value < 0.01 and ** p-value < 0.001)
Figure 5:
Figure 5:. An imputation example on the ENCODE Imputation Challenge dataset.
The heatmap is the matrix of the ENCODE Imputation Challenge partial dataset of six histone marks across 41 tissue and cell types that have at least one histone mark as the train or test data (bottom right). The complete challenge data matrix is shown in Supplementary Table 10. A 200-kbp region in Chr 21 of H3K27ac mark in the C51 (WERI-Rb-1) cell line is used to compare our imputation and the held-out observed ground truth (top left). For comparison, the signals of H3K27ac mark in other cell types are shown on the left, most of which are similar to the ground true as expected. In addition, all six marks of the same region in the C51 cell line are shown on top right, which are quite different from each other.
Figure 6:
Figure 6:. Application of Ocelot to impute missing entries and complete the ENCODE3 histone mark dataset.
The ENCODE3 histone mark dataset covers 13 histone marks in 79 cell and tissue conditions, including primary tissues (n=36), primary cells (n=6), cell lines (n=28) and in vitro differentiated cells (n=9). A total of 500 (48.69%) whole-genome profiles were observed (blue blocks) and used to build machine learning models. Then we imputed the remaining 527 (51.31%) profiles (red blocks).

Similar articles

Cited by

References

    1. Venter JC et al. The sequence of the human genome. Science 291, 1304–1351 (2001). - PubMed
    1. Rivera CM & Ren B Mapping human epigenomes. Cell 155, 39–55 (2013). - PMC - PubMed
    1. Smith ZD & Meissner A DNA methylation: roles in mammalian development. Nat. Rev. Genet. 14, 204–220 (2013). - PubMed
    1. Thiele I et al. A community-driven global reconstruction of human metabolism. Nat. Biotechnol. 31, 419–425 (2013). - PMC - PubMed
    1. Wittkopp PJ & Kalay G Cis-regulatory elements: molecular mechanisms and evolutionary processes underlying divergence. Nat. Rev. Genet. 13, 59–69 (2011). - PubMed