. 2022 Mar;1(1):pgac003.
doi: 10.1093/pnasnexus/pgac003. Epub 2022 Mar 2.

Circulating inflammatory monocytes oppose microglia and contribute to cone cell death in retinitis pigmentosa

Affiliations

Circulating inflammatory monocytes oppose microglia and contribute to cone cell death in retinitis pigmentosa

Jun Funatsu et al. PNAS Nexus. 2022 Mar.

Abstract

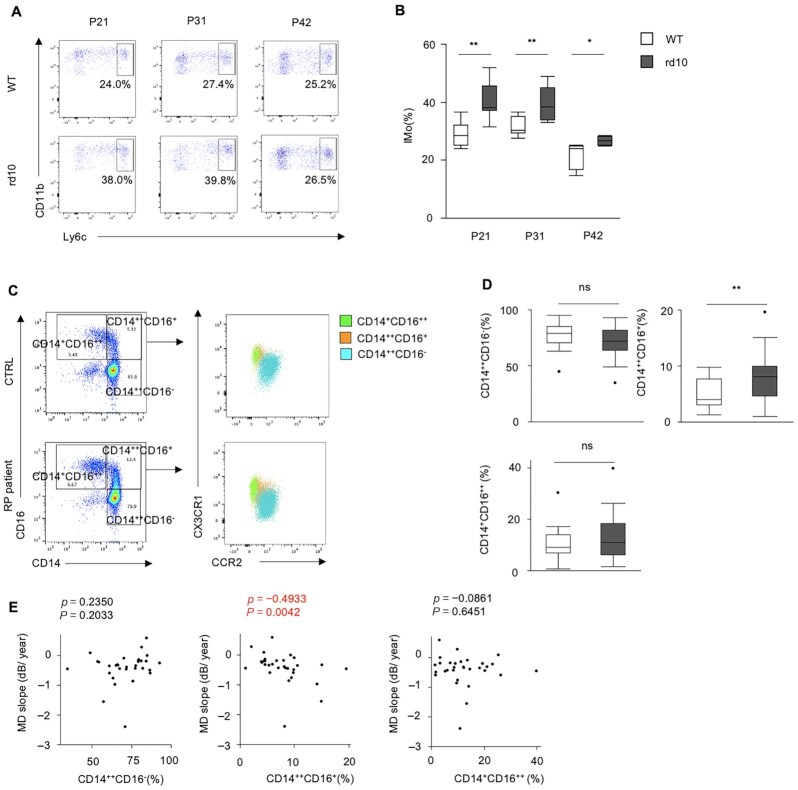
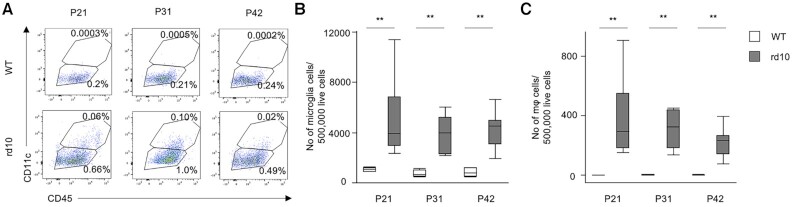
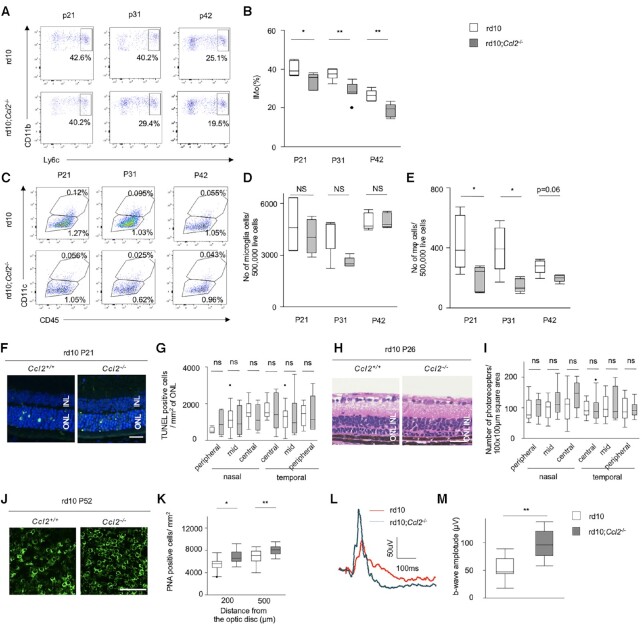
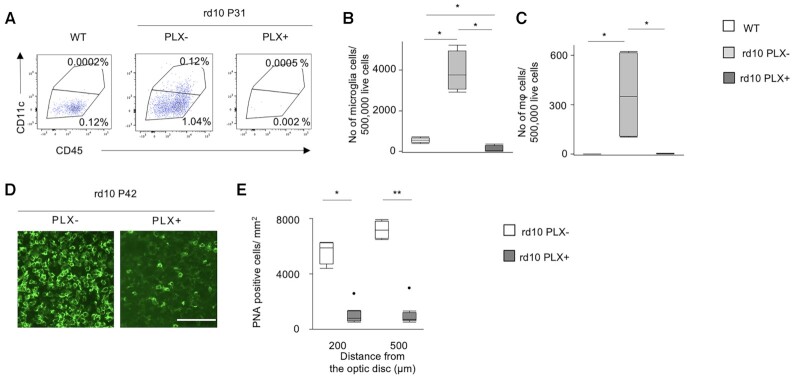
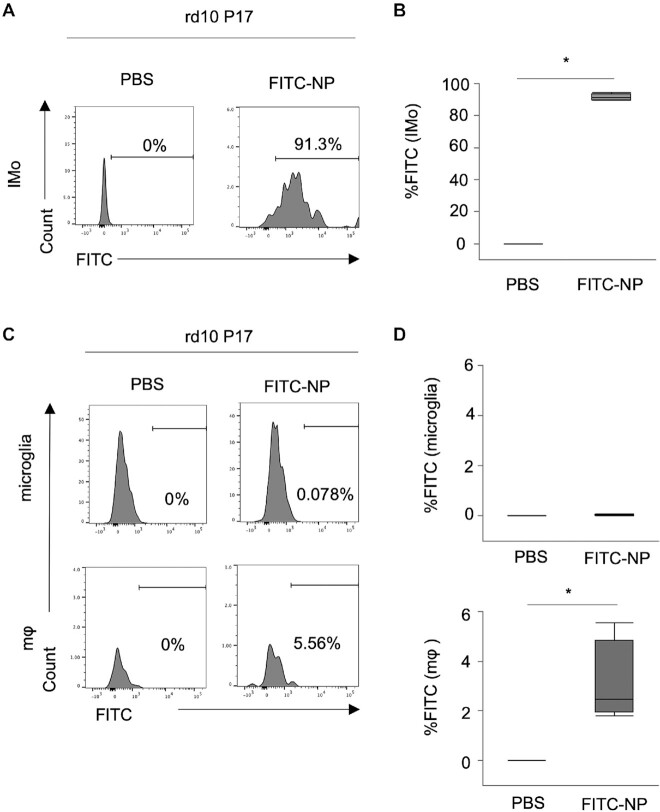
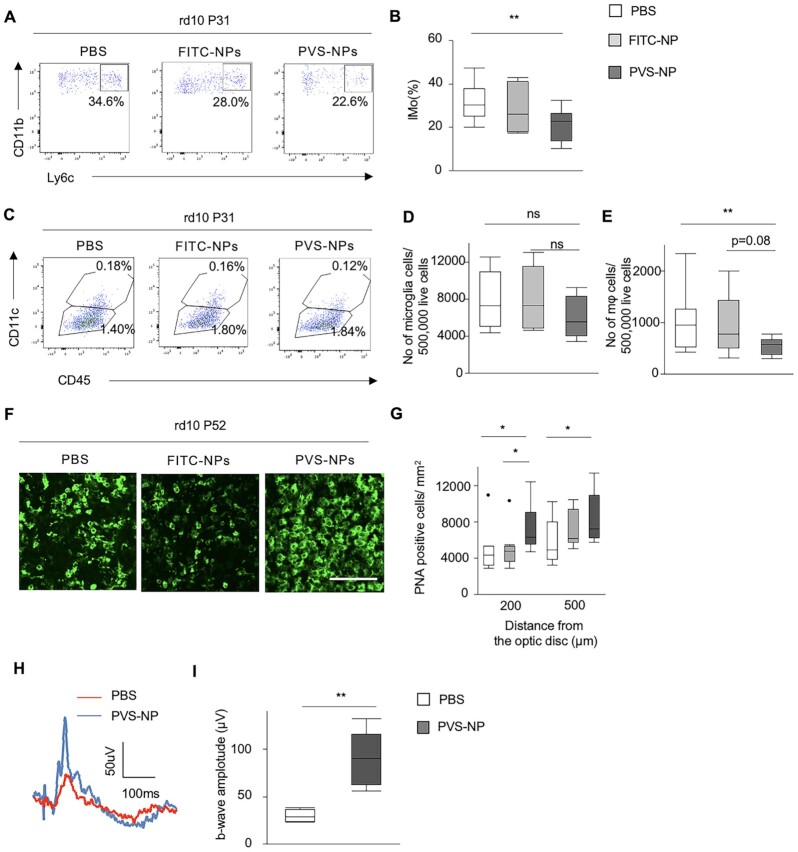
Retinitis pigmentosa (RP) is an intractable inherited disease that primarily affects the rods through gene mutations followed by secondary cone degeneration. This cone-related dysfunction can lead to impairment of daily life activities, and ultimately blindness in patients with RP. Paradoxically, microglial neuroinflammation contributes to both protection against and progression of RP, but it is unclear which population(s) - tissue-resident microglia and/or peripheral monocyte-derived macrophages (mφ) - are implicated in the progression of the disease. Here we show that circulating blood inflammatory monocytes (IMo) are key effector cells that mediate cone cell death in RP. Attenuation of IMo and peripherally engrafted mφ by Ccl2 deficiency or immune modulation via intravenous nano-particle treatment suppressed cone cell death in rd10 mice, an animal model of RP. In contrast, the depletion of resident microglia by a colony-stimulating factor 1 receptor inhibitor exacerbated cone cell death in the same model. In human patients with RP, IMo was increased and correlated with disease progression. These results suggest that peripheral IMo is a potential target to delay cone cell death and prevent blindness in RP.

Keywords: Nanomedicine; Neuroinflammation; Peripheral monocyte.


Conflict of interest statement

Conflict of interest statement: The authors have declared that no conflict of interest exists.

Figures

Fig. 1.
Fig. 1.
IMo were significantly increased in the peripheral blood of mice and RP patients. (A) Flow cytometry findings for the blood samples of WT and rd10 mice at P21, P31, and P42. IMo were defined as CD11b+Ly-6ChiLy-6Glo−neg cells. (B) The proportions of IMo in WT and rd10 mice (P21: WT, n = 7, rd10, n = 7; P31: WT, n = 8, rd10, n = 6; and P42: WT, n = 5, rd10, n = 5). (C) Flow cytometry findings for the blood samples of RP patients (n = 31) and healthy controls (n = 16). The monocytes were divided into nonclassical (CD14+CD16++, left upper gate), intermediate (CD14++CD16+, right upper gate), and classical (CD14++CD16, right bottom gate) subsets. The expression levels of CCR2 and CX3CR1 in each subset are shown in the right panel (nonclassical subset: light blue; intermediate subset: orange; and classical subset: green). (D) The percentages of monocyte subtypes according to CD14/CD16 expression in the healthy subjects and RP patients. CD14++CD16+ intermediate monocytes were significantly increased in the RP patients compared with the controls. (E) The correlations between the mean deviation (MD) slope in HFA10-2 tests and the percentage of monocyte subsets in RP patients were analyzed by Spearman's rank correlation test. There was a negative correlation between the intermediate monocyte subset and the MD slope (i.e. the decline of visual sensitivity). In these graphs, the central horizontal bars indicate the medians, boxes indicate 25th–75th percentiles, and whiskers indicate 1.5 times the interquartile range from the bottom and the top of the box. Outliers are shown as dots. Wilcoxon rank-sum tests were performed to assess the significance. *P < 0.05, **P < 0.01.
Fig. 2.
Fig. 2.
Retinal microglia and mφ were significantly increased in rd10 mice. (A) Flow cytometry analysis of the retinal samples of WT and rd10 mice at P21, P31, and P42. CD11bhiCD11cmidCD45midLy-6GloLy-6Clo cells were defined as microglia (lower gate), and CD11bhiCD11chiCD45hiLy-6GloLy-6Clo cells were defined as mφ (upper gate). (B) The number of retinal microgila cells per 500,000 analyzed cells of the WT and rd10 mouse retina (P21: WT, n = 8, rd10, n = 7; P31: WT, n = 9, rd10, n = 6; and P42: WT, n = 7, rd10, n = 9). (C) The number of mφ cells per 500,000 analyzed cells of the WT and rd10 mouse retina (P21: WT, n = 8, rd10, n = 7; P31: WT, n = 9, rd10, n = 6; and P42: WT, n = 7, rd10, n = 9). The central horizontal bars indicate the medians, boxes indicate 25th–75th percentiles, and whiskers indicate 1.5 times the interquartile range from the bottom and the top of the box. Wilcoxon rank-sum tests were performed to assess the significance. **P < 0.01.
Fig. 3.
Fig. 3.
Ccl2 deficiency-attenuated IMo/mφ recruitment and suppressed cone cell death in rd10 mice. (A) Flow cytometry analysis of the blood samples of rd10 and rd10; Ccl2−/− mice at P21, P31, and P42. (B) The proportions of CD11b+Ly-6ChiLy-6Glo−neg IMo of rd10 mice and rd10; Ccl2−/− mice (P21: rd10, n = 6, rd10; Ccl2−/−, n = 5; P31: rd10, n = 7, rd10; Ccl2−/−, n = 7; and P42: rd10, n = 5, rd10; Ccl2−/−, n = 7). (C) Flow cytometry analysis of the retinal samples of rd10 mice and rd10; Ccl2−/− mice at P21, P31m, and P42. The cells surrounded by the lower gate were defined as microglia, and the cells surrounded by the upper gate were defined as mφ. (D) The difference in the number of retinal microgila cells per 500,000 analyzed cells between rd10 mice and rd10; Ccl2−/− mice at P21: rd10, n = 6, rd10; Ccl2−/−, n = 6; at P31: rd10, n = 5, rd10; Ccl2−/−, n = 5; and at P42: rd10, n = 5, rd10; Ccl2−/−, n = 5. (E) The difference in the number of retinal mφ cells per 500,000 analyzed cells between rd10 mice and rd10; Ccl2−/− mice at P21: rd10, n = 6, rd10; Ccl2−/−, n = 6; at P31: rd10, n = 5, rd10; Ccl2−/−, n = 5; and at P42: rd10, n = 5, rd10; Ccl2−/−, n = 5. (F) TUNEL staining (green) and (G) quantification of TUNEL-positive photoreceptor cells in the retina of P21 rd10 mice (n = 8) and rd10; Ccl2−/− mice (n = 8). Scale bar: 50 μm. (H) Histological findings of the retina and (I) the results of the quantitative analysis of photoreceptor cells in the retina of P26 rd10 mice (n = 20) and rd10; Ccl2−/− mice (n = 10). Scale bar: 50 μm. (J) PNA staining and (K) the quantification of PNA-positive cone photoreceptor cells in the retina of P42 rd10 mice (n = 21) and rd10; Ccl2−/− mice (n = 15). Scale bar: 50 μm. (L) Photopic ERG and (M) the quantification of b-wave amplitudes at P35 of rd10 mice (n = 6) and rd10; Ccl2−/− mice (n = 8). In these graphs, the central horizontal bars indicate the medians, boxes indicate 25th–75th percentiles, and whiskers indicate 1.5 times the interquartile range from the bottom and the top of the box. Outliers are shown as dots. Wilcoxon rank-sum tests were performed to assess the significance. *P < 0.05, **P < 0.01.
Fig. 4.
Fig. 4.
Microglia depletion induced by the CSF1R inhibitor PLX5622 exacerbated cone photoreceptor cell death in rd10 mice. (A) Flow cytometry analysis of the retinal samples of rd10 mice fed with or without PLX5622 at P31. WT retinas without treatment were used as control samples for gating microglia and mφ. (B) and (C) Differences in the number of retinal microgila cells (B) and retinal mφ (C) per 500,000 analyzed cells among WT and rd10 mice fed with or without PLX5622 (all n = 4). Both microglia and mφ were mostly depleted in the rd10 mouse retinas 7 days after PLX5622 treatment. (D) PNA staining and (E) the quantification of PNA-positive cone photoreceptor cells in the retinas of P42 rd10 mice fed with or without PLX5622 (n = 4, respectively). Scale bar: 50 μm. The cone density was markedly decreased in the rd10 mice treated with PLX5622. The central horizontal bars indicate the medians, boxes indicate 25th–75th percentiles, and whiskers indicate 1.5 times the interquartile range from the bottom and the top of the box. Wilcoxon rank-sum tests were performed to assess the significance. *P < 0.05, **P < 0.01.
Fig. 5.
Fig. 5.
NPs were efficiently incorporated into IMo and retinal mφ in rd10 mice. (A) and (B) Flow cytometry analysis of the blood samples of P17 rd10 mice administered NPs via the tail vein. Mice were divided into a PBS group (n = 4) and an NPs (FITC-NP) group (n = 4). (A) Representative data of the FITC incorporation into IMo at 2 h after an injection of PBS and FITC-NPs. (B) The quantification of FITC incorporation into IMo, expressed as the percentage above threshold. (C) and (D) Flow cytometry analysis of the FITC incorporation in retinal samples of P17 rd10 mice after NP administration (PBS: n = 4; FITC-NP: n = 4). (C) Representative data of the FITC incorporation into microglia and mφ at 24 h after an intravenous administration of PBS and FITC-NPs. (D) Quantification of FITC incorporation into microglia and mφ. Data are the percentage above threshold. The central horizontal bars indicate the medians, boxes indicate 25th–75th percentiles, and whiskers indicate 1.5 times the interquartile range from the bottom and the top of the box. Wilcoxon rank-sum tests were performed to assess the significance. *P < 0.05.
Fig. 6.
Fig. 6.
Attenuation of IMo/mφ suppresses cone cell death in rd10 mice. (A) Flow cytometry analysis of the blood samples of P31 rd10 mice treated with PBS, FITC-NPs, or PVS-NPs. The mice received an intravenous injection of 1 of these 3 agents 2×/week beginning on P21. The gate was defined as CD11b+Ly-6ChiLy-6Glo−neg IMo. (B) Changes in the proportion of IMo in the 3 groups (PBS: n = 10; FITC-NP: n = 11; and PVS-NP: n = 14). (C) Flow cytometry analysis of the retinal samples of P31 rd10 mice treated with PBS, FITC-NPs, or PVS-NPs. The cells surrounded by the lower gate were defined as microglia, and the cells surrounded by the upper gate were defined as mφ. (D) and (E) The difference in the number of retinal microglia (D) and mφ (E) per 500,000 analyzed cells among the 3 groups (PBS: n = 14; FITC-NP: n = 12; and PVS-NP: n = 14). (F) PNA staining and (G) quantification of PNA-positive cone cells in the retina of P52 rd10 mice treated with PBS (n = 9), FITC-NP (n = 9), or PVS-NP (n = 9). Scale bar: 50 μm. (H) Photopic ERG and (I) the quantification of b-wave amplitudes of P35 rd10 mice treated with PBS (n = 6) and rd10; Ccl2−/− mice (n = 8). The central horizontal bars indicate the medians, boxes indicate 25th–75th percentiles, and whiskers indicate 1.5 times the interquartile range from the bottom and the top of the box. Outliers are shown as dots. Wilcoxon rank-sum tests were performed to assess the significance. *P < 0.05, **P < 0.01.

Similar articles

Cited by

References

    1. Hartong DT, Berson EL, Dryja TP. 2006. Retinitis pigmentosa. Lancet North Am Ed. 368, 1795–1809. - PubMed
    1. Komeima K, Rogers BS, Lu L, Campochiaro PA. 2006. Antioxidants reduce cone cell death in a model of retinitis pigmentosa. Proc Natl Acad Sci. 103, 11300–11305. - PMC - PubMed
    1. Paschalis EI, et al. . 2018. Permanent neuroglial remodeling of the retina following infiltration of CSF1R inhibition-resistant peripheral monocytes. Proc Natl Acad Sci. 115, E11359–E11368. - PMC - PubMed
    1. Yoshida N., et al. , 2013. Clinical evidence of sustained chronic inflammatory reaction in retinitis pigmentosa. Ophthalmology. 120, 100–105. - PubMed
    1. Zhao L., et al. 2015. Microglial phagocytosis of living photoreceptors contributes to inherited retinal degeneration. EMBO Mol Med. 7, 1179–1197. - PMC - PubMed