Review
. 2022 Apr 10;12(2):97-124.
doi: 10.1007/s13534-022-00220-4. eCollection 2022 May.

Functional photoacoustic microscopy of hemodynamics: a review

Affiliations
Review

Functional photoacoustic microscopy of hemodynamics: a review

Chao Liu et al. Biomed Eng Lett. .

Abstract

Functional blood imaging can reflect tissue metabolism and organ viability, which is important for life science and biomedical studies. However, conventional imaging modalities either cannot provide sufficient contrast or cannot support simultaneous multi-functional imaging for hemodynamics. Photoacoustic imaging, as a hybrid imaging modality, can provide sufficient optical contrast and high spatial resolution, making it a powerful tool for in vivo vascular imaging. By using the optical-acoustic confocal alignment, photoacoustic imaging can even provide subcellular insight, referred as optical-resolution photoacoustic microscopy (OR-PAM). Based on a multi-wavelength laser source and developed the calculation methods, OR-PAM can provide multi-functional hemodynamic microscopic imaging of the total hemoglobin concentration (CHb), oxygen saturation (sO2), blood flow (BF), partial oxygen pressure (pO2), oxygen extraction fraction, and metabolic rate of oxygen (MRO2). This concise review aims to systematically introduce the principles and methods to acquire various functional parameters for hemodynamics by photoacoustic microscopy in recent studies, with characteristics and advantages comparison, typical biomedical applications introduction, and future outlook discussion.

Keywords: Calculation methods; Hemodynamics; Multi-functional imaging; Photoacoustic imaging.


Conflict of interest statement

Conflict of interestThe authors have no conflicts of interest to declare.

Figures

Fig. 1
Fig. 1
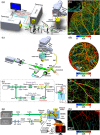
Functional in vivo photoacoustic imaging of a normalized CHb in mouse ear [62], b sO2 in mouse brain with intact skull [63], c blood vessel and Evans Blue-labeled lymphatic vessels [55], d Blood flow velocities with direction [64], e MRO2 of mouse kidney in acute kidney injury model [65], and f pO2 in the mouse ear [66]. All figures are reprinted with permission
Fig. 2
Fig. 2
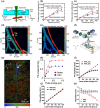
The system ag and corresponding sO2 imaging results bh for linear sO2 methods: two laser sources [73] and single laser source with EOM [69], fiber-based SRS [70], and crystal-based SRS [71]. All figures are reprinted with permission
Fig. 3
Fig. 3
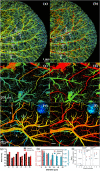
ae The nonlinear sO2 measurement method based on intensity saturation [74]; a is the diagram for single wavelength imaging; bc respectively show the average photoacoustic amplitude as a function of the fluence in vein and artery in nonlinear sO2 result (d); e Shows the linear sO2 result by a conventional dual-wavelength method. fk Signifies the nonlinear sO2 measurement method based on different pulse width [75]; f is picosecond/nanosecond single-wavelength system diagram; g is the nonlinear sO2 brain imaging; h shows the in vivo nonlinear sO2 results in an artery-vein pair in a mouse ear with different pulse energies; i and j are photoacoustic amplitudes of HbO2 and HbR under different picosecond and nanosecond pulse energies; k demonstrates the saturation factor for HbO2 and HbR under different pulsed energy, which is defined as the ratio of the photoacoustic amplitude with picosecond excitation to that with nanosecond excitation. All figures are reprinted with permission
Fig. 4
Fig. 4
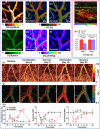
af sO2 imaging without and with compensation related to absorption saturation effect [62], optical scattering [76] and acoustic attenuation [77], and their comparison are shown in g, i, respectively. All figures are reprinted with permission
Fig. 5
Fig. 5
ac The blood flow location in the somatosensory area in the right hemisphere of the brain, space–time plot acquired along the vein via scanning, and the measured time traces of the cerebral blood flow speeds by direct measurement [75]. de The system and flow measurement results based on the modulated continuous-wave laser beam [93]. fe The principle, measured relationship between the preset flow speeds and spectral density, and the comparison between the preset flow speeds and measured flow speeds [98]. All figures are reprinted with permission
Fig. 6
Fig. 6
ac Respectively the probe-beam geometry, sequential A-scans used for calculation, and measured particle flow with different scanning directions from the target correlation photoacoustic Doppler bandwidth broadening flowmetric method [99]. df Respectively the experimental setup, demonstration of de-correlation within finite transducer beam width, and measured flow results using 3.5 MHz cylindrically focused transducer by the temporal cross-correlation photoacoustic flowmetric method [105]. gi Respectively the principle, shifted time of PA signals from two locations, Av and Bv, and the comparison of flow results by spatial-domain target correlation photoacoustic flowmetric method [108]. All figures are reprinted with permission
Fig. 7
Fig. 7
ac Respectively the system setup, normalized photoacoustic modulation frequency responses with different flow speeds (1.06 (pink), 2.1 (green), 4.2 (red), 10.6 (black) and 21.2 (gray) mm/s), and the flow measurement results compared with the preset values by the photothermal-thermal-tagging photoacoustic flowmetric method [111]. df are respectively the system setup, thermal decay curves acquired with different blood flow speeds, and measured flow speed versus set flow speed through the ultrasound-thermal-tagging photoacoustic flowmetric method [112]. gk The system setup, vessel structure, blood flow, speed profiles along with the dashed white line in (h), time-domain blood flow speed in the artery from the pulsed-laserbeam-thermal-tagging photoacoustic flowmetric method [116]. All figures are reprinted with permission. (Color figure online)
Fig. 8
Fig. 8
a, b The CHb acquired by photoacoustic imaging at 570 nm and the time-integrated phosphorescence acquired by confocal imaging at 523 nm; cd, and ef The sO2 and pO2 imaging of mouse ear in hyperoxia and normoxia models, respectively [66]. gh are the combined image of sO2 in the labeled tumor region and the OEF variation in the tumor region from day 0 to day 7 [67]. ik are respectively the variation in CHb, sO2, flow rate, OEF, and MRO2 during the monitoring of hemodynamic responses after cryotherapy on mouse ear [143]. All figures are reprinted with permission

Similar articles

Cited by

References

    1. Dunn AK, Devor A, Bolay H, Andermann ML, Moskowitz MA, Dale AM, et al. Simultaneous imaging of total cerebral hemoglobin concentration, oxygenation, and blood flow during functional activation. Opt Lett [Internet] 2003;28(1):28–30. doi: 10.1364/OL.28.000028. - DOI - PubMed
    1. Devor A, Dunn AK, Andermann ML, Ulbert I, Boas DA, Dale AM. Coupling of total hemoglobin concentration, oxygenation, and neural activity in rat somatosensory cortex. Neuron. 2003;39(2):353–359. doi: 10.1016/S0896-6273(03)00403-3. - DOI - PubMed
    1. Wright GA, Hu BS, Macovski A. Estimating oxygen saturation of blood in vivo with MR imaging at 1.5 T. J Magn Reson Imaging [Internet] 1991;1(3):275–83. doi: 10.1002/jmri.1880010303. - DOI - PubMed
    1. An H, Lin W. Quantitative measurements of cerebral blood oxygen saturation using magnetic resonance imaging. J Cereb Blood Flow Metab [Internet] 2000;20(8):1225–1236. doi: 10.1097/00004647-200008000-00008. - DOI - PMC - PubMed
    1. Axel L. Blood flow effects in magnetic resonance imaging. Am J Roentgenol [Internet] 1984;143(6):1157–1166. doi: 10.2214/ajr.143.6.1157. - DOI - PubMed

LinkOut - more resources