

Encapsulation of echinomycin in cyclodextrin inclusion complexes into liposomes: in vitro anti-proliferative and anti-invasive activity in glioblastoma
- PMID: 35529392
- PMCID: PMC9072562
- DOI: 10.1039/c9ra05636j
Encapsulation of echinomycin in cyclodextrin inclusion complexes into liposomes: in vitro anti-proliferative and anti-invasive activity in glioblastoma
Abstract
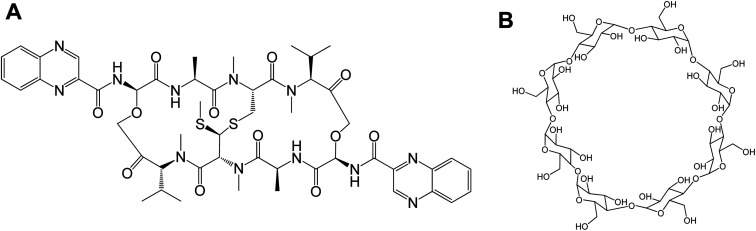
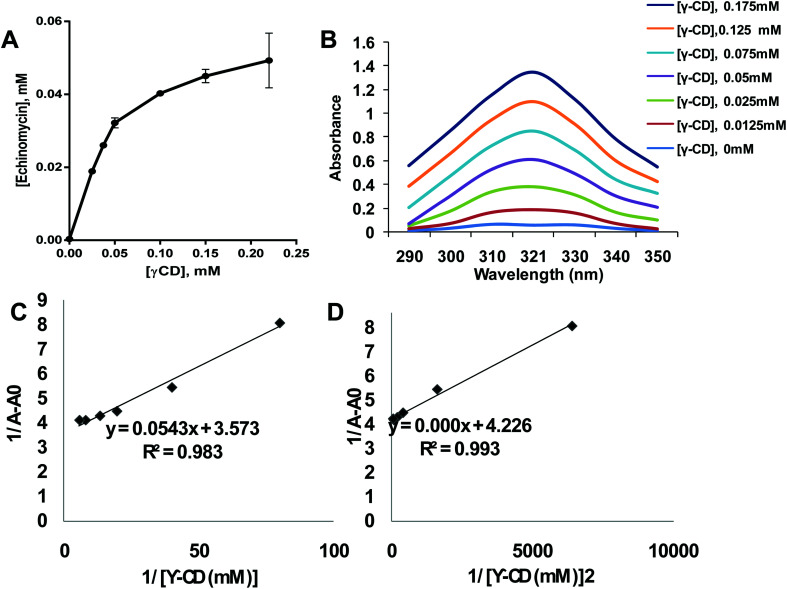
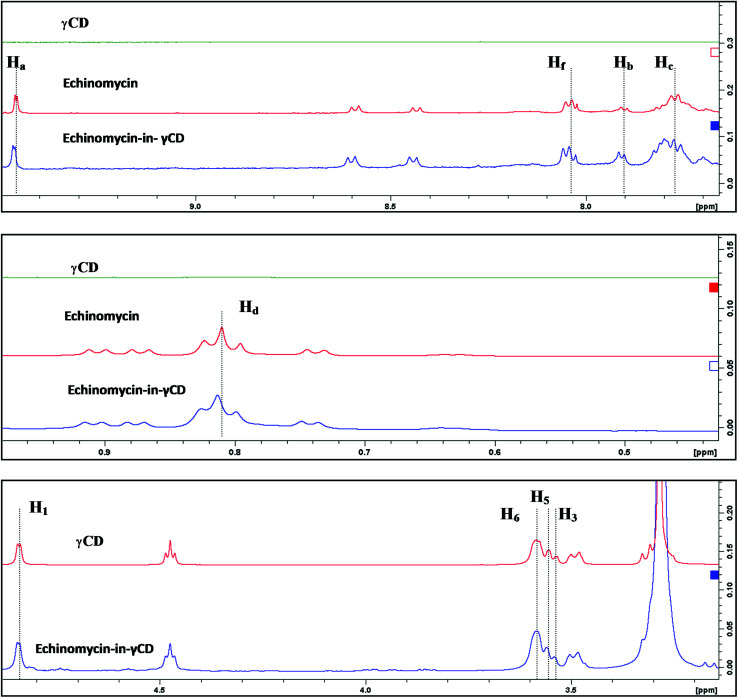
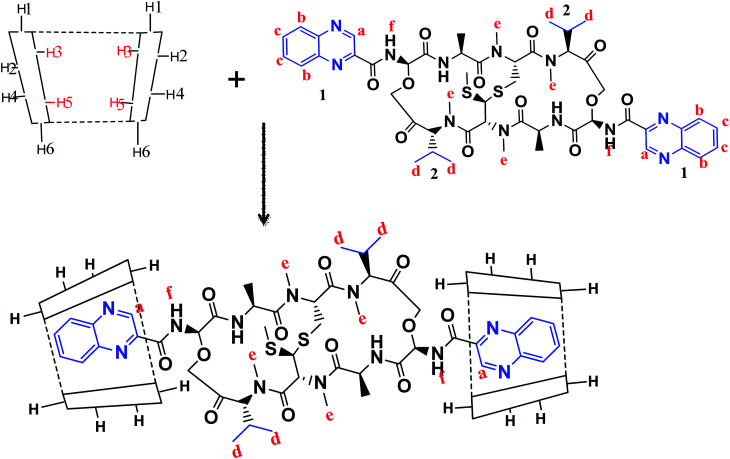
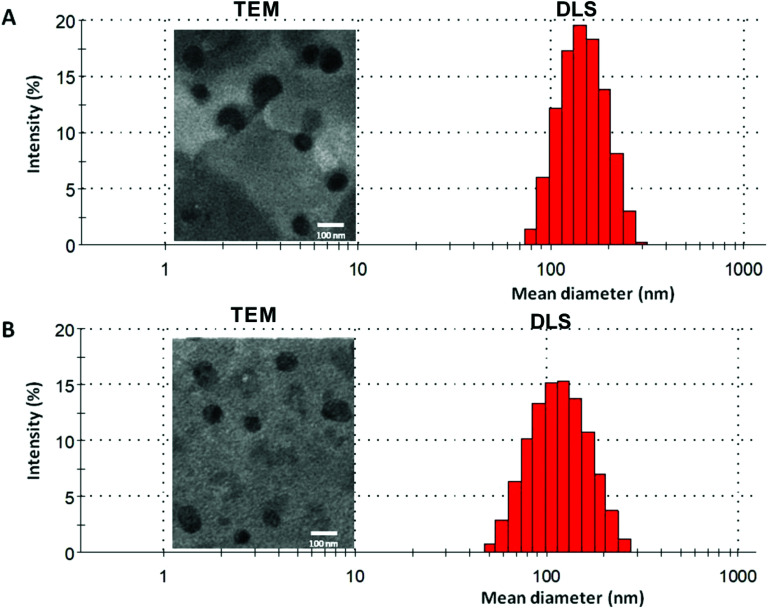
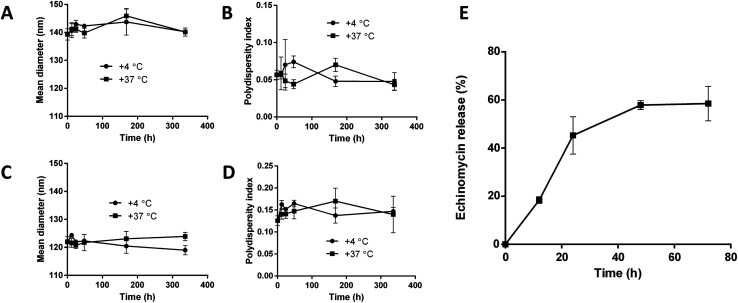
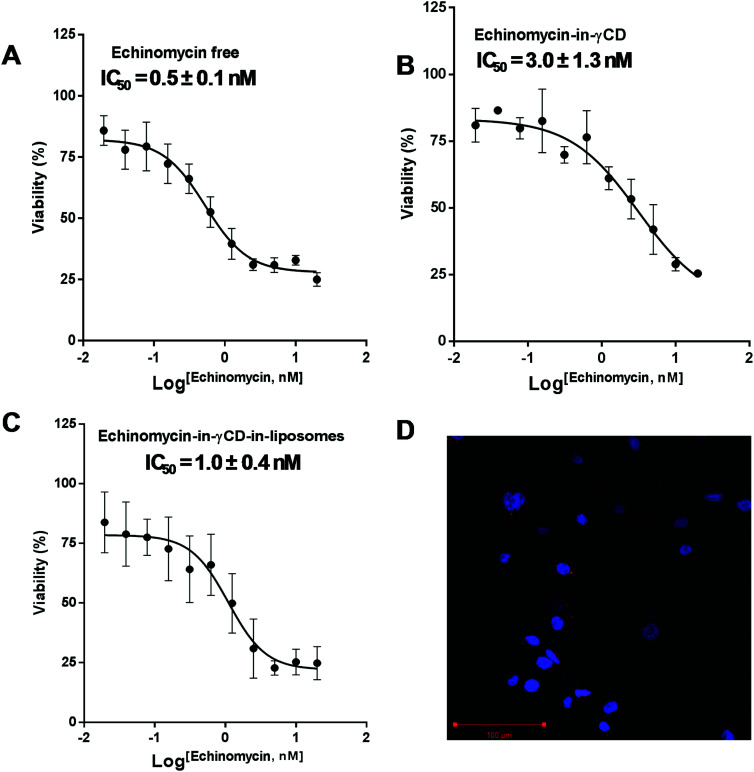
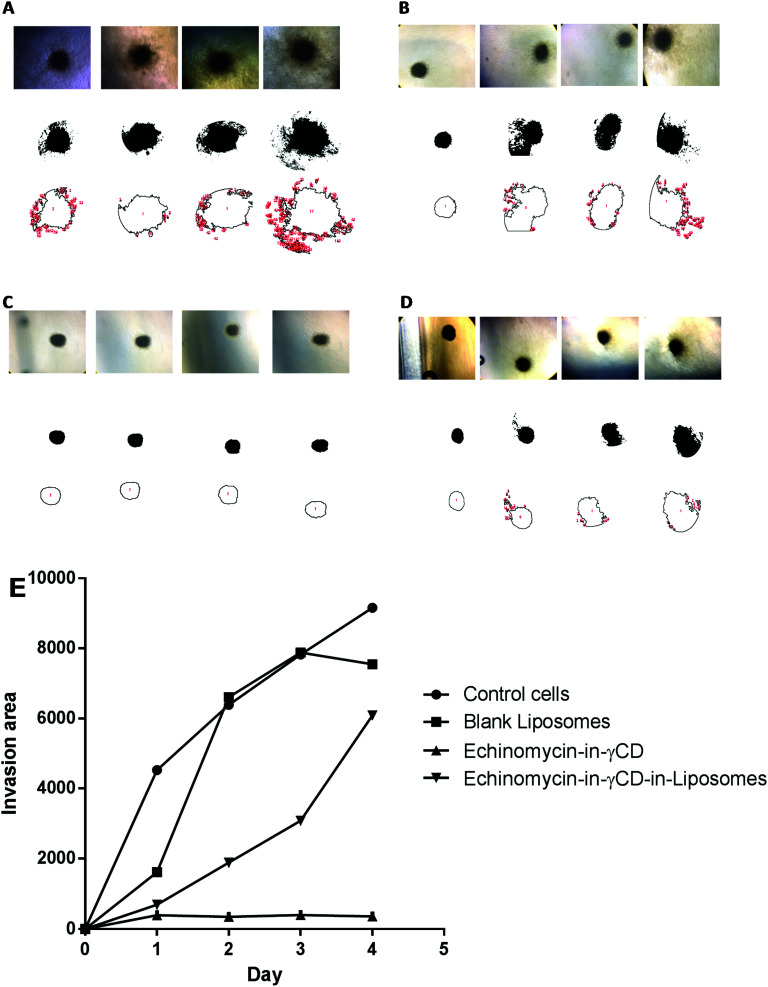
Echinomycin, a DNA bis-intercalator peptide, belongs to the family of quinoxaline antibiotics. Echinomycin exhibits potent antitumor and antimicrobial activity. However, it is highly water insoluble and suffers from low bioavailability and unwanted side effects. Therefore, developing new formulations and delivery systems that can enhance echinomycin solubility and therapeutic potency is needed for further clinical application. In this study, echinomycin has been complexed into the hydrophobic cavity of γ-cyclodextrin (γCD) then encapsulated into PEGylated liposomes. The anti-proliferative and anti-invasive effect has been evaluated against U-87 MG glioblastoma cells. Echinomycin-in-γCD inclusion complexes have been characterized by phase solubility assay, TLC, and 1H-NMR. The echinomycin-in-γCD inclusion complexes have been loaded into liposomes using a thin film hydration method to end up with echinomycin-in-γCD-in-liposomes. Drug-loaded liposomes were able to inhibit cell proliferation with IC50 of 1.0 nM. Moreover, echinomycin-in-γCD-in-liposomes were found to inhibit the invasion of U-87 MG cells using the spheroid gel invasion assay. In conclusion, the current work describes for the first time γCD-echinomycin complexes and their encapsulation into PEGylated liposomes.
This journal is © The Royal Society of Chemistry.
Conflict of interest statement
There are no conflicts to declare.
Figures
Similar articles
-
Aptamer-functionalized pH-sensitive liposomes for a selective delivery of echinomycin into cancer cells.RSC Adv. 2021 Sep 1;11(47):29164-29177. doi: 10.1039/d1ra05138e. eCollection 2021 Sep 1. RSC Adv. 2021. PMID: 35479561 Free PMC article.
-
Loading of capsaicin-in-cyclodextrin inclusion complexes into PEGylated liposomes and the inhibitory effect on IL-8 production by MDA-MB-231 and A549 cancer cell lines.Z Naturforsch C J Biosci. 2021 May 26;76(11-12):503-514. doi: 10.1515/znc-2021-0018. Print 2021 Nov 25. Z Naturforsch C J Biosci. 2021. PMID: 34036759
-
Preparation and Spectroscopic Characterization of Inclusion Complexes of 3D Ball-Milled Rifampicin with β-cyclodextrin and γ-cyclodextrin : 3D Ball-Milled Rifampicin with β-cyclodextrin and γ-cyclodextrin.AAPS PharmSciTech. 2022 May 9;23(5):138. doi: 10.1208/s12249-022-02290-0. AAPS PharmSciTech. 2022. PMID: 35534746
-
Self-assembled γ-cyclodextrin as nanocarriers for enhanced ocular drug bioavailability.Int J Pharm. 2022 Apr 25;618:121654. doi: 10.1016/j.ijpharm.2022.121654. Epub 2022 Mar 9. Int J Pharm. 2022. PMID: 35278603 Review.
-
γ-Cyclodextrin.Int J Pharm. 2017 Jan 10;516(1-2):278-292. doi: 10.1016/j.ijpharm.2016.10.062. Epub 2016 Oct 29. Int J Pharm. 2017. PMID: 27989822 Review.
Cited by
-
Cinnamaldehyde-cucurbituril complex: investigation of loading efficiency and its role in enhancing cinnamaldehyde in vitro anti-tumor activity.RSC Adv. 2022 Mar 8;12(12):7540-7549. doi: 10.1039/d2ra00044j. eCollection 2022 Mar 1. RSC Adv. 2022. PMID: 35424684 Free PMC article.
-
Metal-organic frameworks as nanoplatforms for combination therapy in cancer treatment.Med Oncol. 2024 Dec 9;42(1):26. doi: 10.1007/s12032-024-02567-3. Med Oncol. 2024. PMID: 39653960 Review.
-
Effect of cucurbit[7]uril on DPPC-containing liposomes: Interactions with the lipid bilayer.Sci Prog. 2025 Apr-Jun;108(2):368504251334687. doi: 10.1177/00368504251334687. Epub 2025 Apr 17. Sci Prog. 2025. PMID: 40241517 Free PMC article.
-
Unlocking the Therapeutic Potential of BCL-2 Associated Protein Family: Exploring BCL-2 Inhibitors in Cancer Therapy.Biomol Ther (Seoul). 2024 May 1;32(3):267-280. doi: 10.4062/biomolther.2023.149. Epub 2024 Apr 9. Biomol Ther (Seoul). 2024. PMID: 38589288 Free PMC article. Review.
-
Optimized Rutin-incorporating PEGylated Nanoliposomes as a Model with Remarkable Selectivity Against PANC1 and MCF7 Cell Lines.Anticancer Agents Med Chem. 2025;25(12):859-872. doi: 10.2174/0118715206231749241209073759. Anticancer Agents Med Chem. 2025. PMID: 39844565
References
-
- Katagiri K., Yoshida T. and Sato K., in Mechanism of action of antimicrobial and antitumor agents, Springer, 1975, pp. 234–251
LinkOut - more resources
Full Text Sources
Other Literature Sources
Miscellaneous