

Topologic Reorganization of White Matter Connectivity Networks in Early-Blind Adolescents
- PMID: 35529452
- PMCID: PMC9072039
- DOI: 10.1155/2022/8034757
Topologic Reorganization of White Matter Connectivity Networks in Early-Blind Adolescents
Abstract
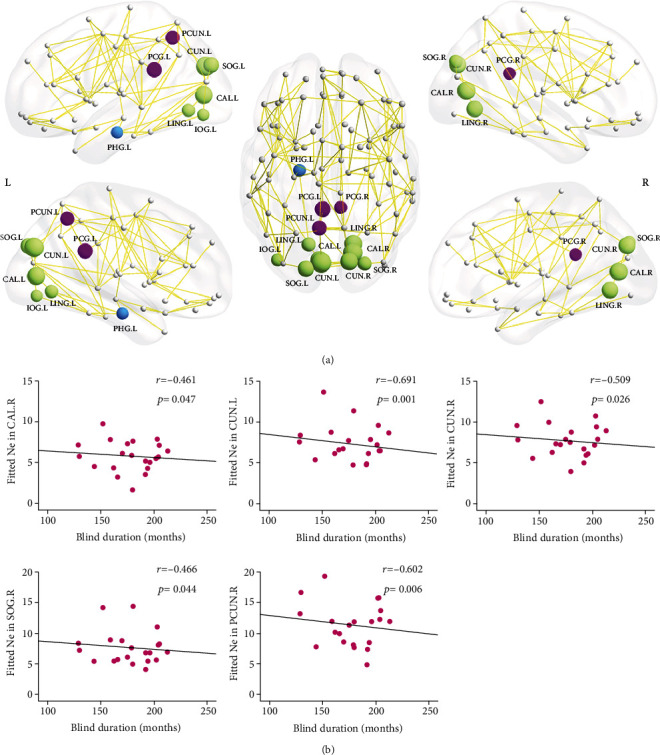
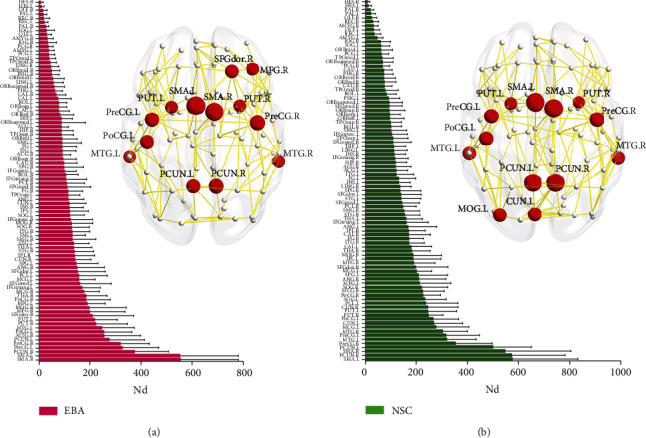
Blindness studies are important models for the comprehension of human brain development and reorganization, after visual deprivation early in life. To investigate the global and local topologic alterations and to identify specific reorganized neural patterns in early-blind adolescents (EBAs), we applied diffusion tensor tractography and graph theory to establish and analyze the white matter connectivity networks in 21 EBAs and 22 age- and sex-matched normal-sighted controls (NSCs). The network profiles were compared between the groups using a linear regression model, and the associations between clinical variables and network profiles were analyzed. Graph theory analysis revealed "small-world" attributes in the structural connection networks of both EBA and NSC cohorts. The EBA cohort exhibited significant lower network density and global and local efficiency, as well as significantly elevated shortest path length, compared to the NSC group. The network efficiencies were markedly reduced in the EBA cohort, with the largest alterations in the default-mode, visual, and limbic areas. Moreover, decreased regional efficiency and increased nodal path length in some visual and default-mode areas were strongly associated with the period of blindness in EBA cohort, suggesting that the function of these areas would gradually weaken in the early-blind brains. Additionally, the differences in hub distribution between the two groups were mainly within the occipital and frontal areas, suggesting that neural reorganization occurred in these brain regions after early visual deprivation during adolescence. This study revealed that the EBA brain structural network undergoes both convergent and divergent topologic reorganizations to circumvent early visual deprivation. Our research will add to the growing knowledge of underlying neural mechanisms that govern brain reorganization and development, under conditions of early visual deprivation.
Copyright © 2022 Zhifeng Zhou et al.
Conflict of interest statement
The authors have no conflict of interest to declare.
Figures


Similar articles
-
Alterations of the Brain Microstructure and Corresponding Functional Connectivity in Early-Blind Adolescents.Neural Plast. 2019 Feb 24;2019:2747460. doi: 10.1155/2019/2747460. eCollection 2019. Neural Plast. 2019. PMID: 30996726 Free PMC article.
-
Disrupted topologic efficiency of white matter structural connectome in migraine: a graph-based connectomics study.J Headache Pain. 2024 Nov 25;25(1):204. doi: 10.1186/s10194-024-01919-8. J Headache Pain. 2024. PMID: 39581995 Free PMC article.
-
Plastic reorganization of the topological asymmetry of hemispheric white matter networks induced by congenital visual experience deprivation.Neuroimage. 2024 Oct 1;299:120844. doi: 10.1016/j.neuroimage.2024.120844. Epub 2024 Sep 10. Neuroimage. 2024. PMID: 39260781
-
White Matter-Based Structural Brain Network of Major Depression.Adv Exp Med Biol. 2021;1305:35-55. doi: 10.1007/978-981-33-6044-0_3. Adv Exp Med Biol. 2021. PMID: 33834393 Review.
-
Graph theory approach for the structural-functional brain connectome of depression.Prog Neuropsychopharmacol Biol Psychiatry. 2021 Dec 20;111:110401. doi: 10.1016/j.pnpbp.2021.110401. Epub 2021 Jul 12. Prog Neuropsychopharmacol Biol Psychiatry. 2021. PMID: 34265367 Review.
Cited by
-
White Matter Function and Network Abnormalities in Patients with Diabetic Retinopathy.Diabetes Metab Syndr Obes. 2024 Nov 3;17:4149-4166. doi: 10.2147/DMSO.S492099. eCollection 2024. Diabetes Metab Syndr Obes. 2024. PMID: 39512603 Free PMC article.
References
Publication types
MeSH terms
LinkOut - more resources
Full Text Sources
