

Parameter estimation of the COVID-19 transmission model using an improved quantum-behaved particle swarm optimization algorithm
- PMID: 35529477
- PMCID: PMC9067002
- DOI: 10.1016/j.dsp.2022.103577
Parameter estimation of the COVID-19 transmission model using an improved quantum-behaved particle swarm optimization algorithm
Abstract
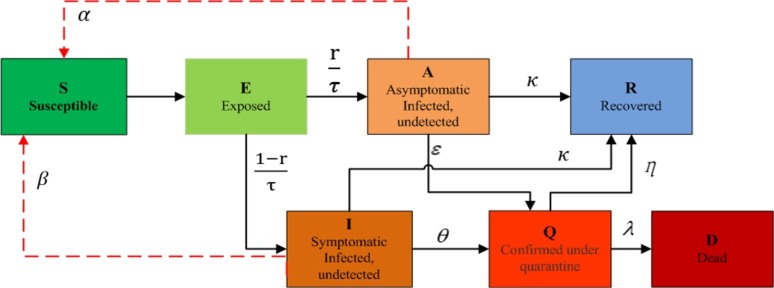
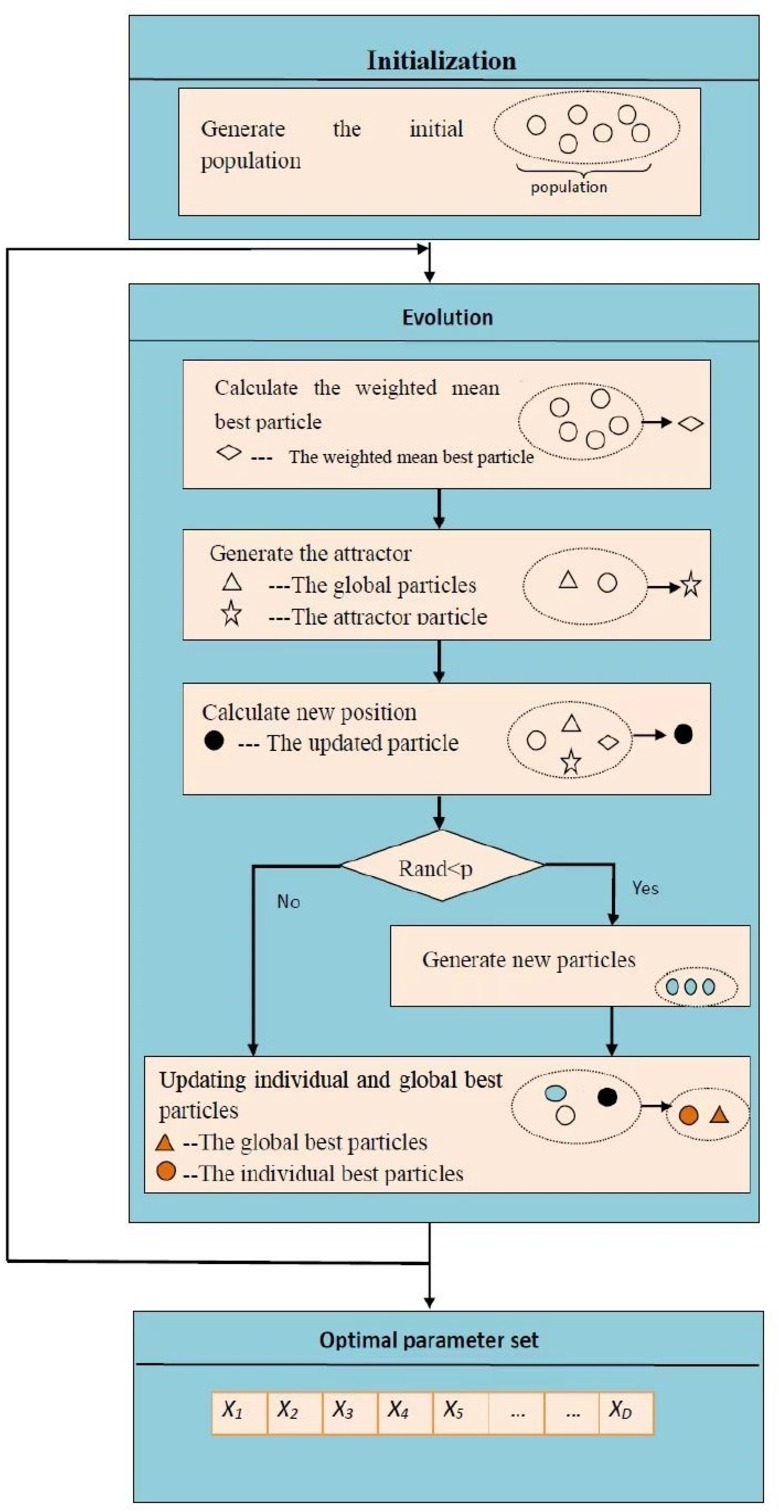
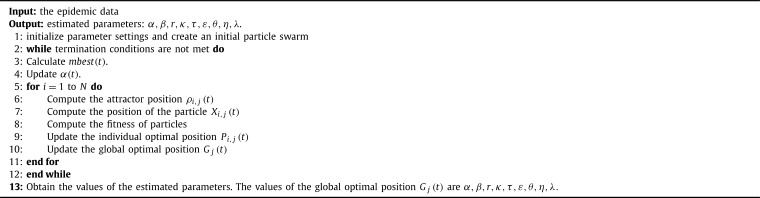
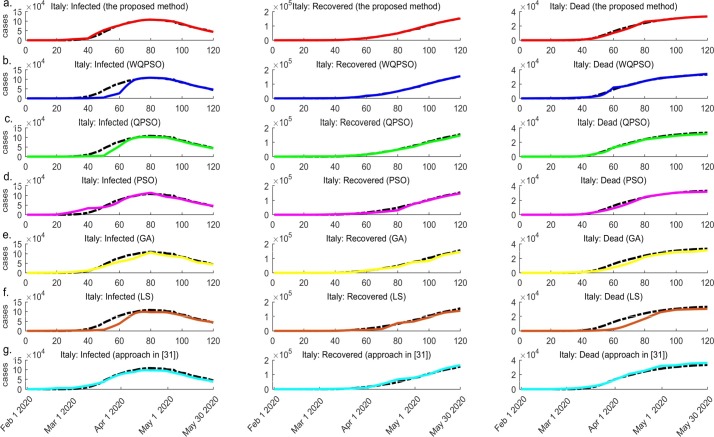
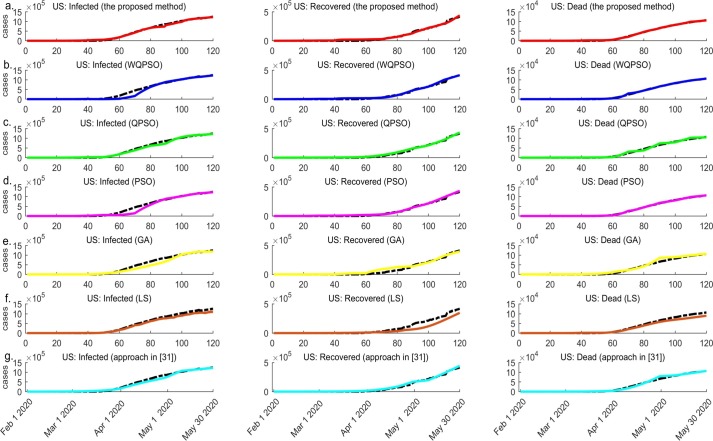
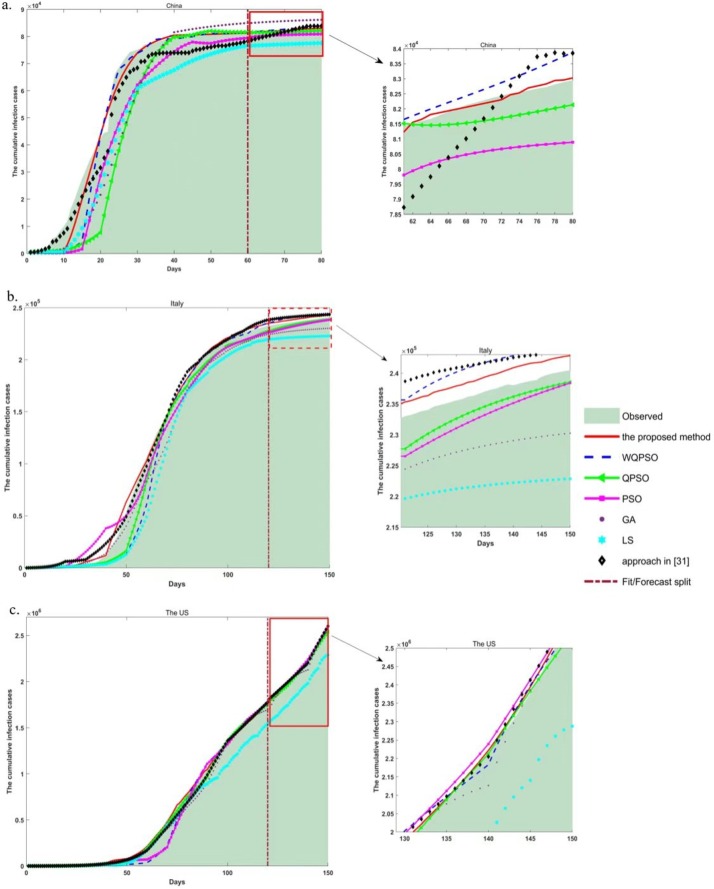
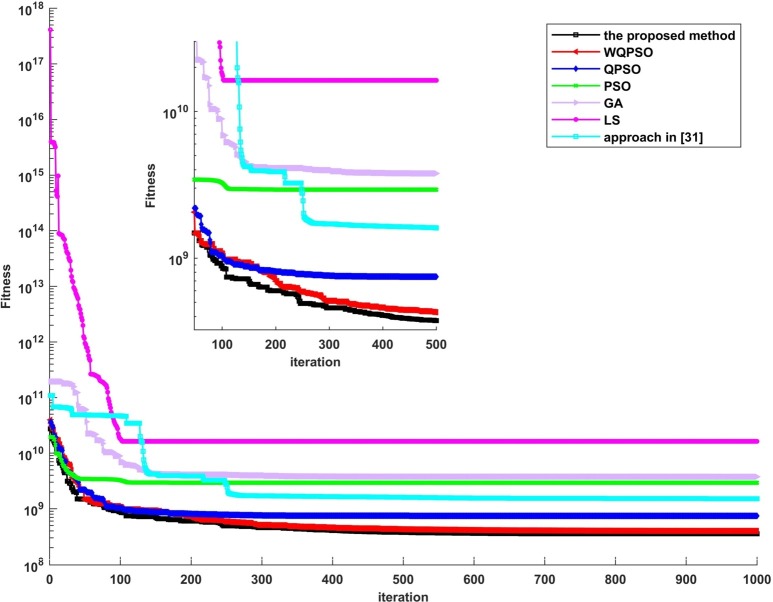
The outbreak of coronavirus disease (COVID-19) and its accompanying pandemic have created an unprecedented challenge worldwide. Parametric modeling and analyses of the COVID-19 play a critical role in providing vital information about the character and relevant guidance for controlling the pandemic. However, the epidemiological utility of the results obtained from the COVID-19 transmission model largely depends on accurately identifying parameters. This paper extends the susceptible-exposed-infectious-recovered (SEIR) model and proposes an improved quantum-behaved particle swarm optimization (QPSO) algorithm to estimate its parameters. A new strategy is developed to update the weighting factor of the mean best position by the reciprocal of multiplying the fitness of each best particle with the average fitness of all best particles, which can enhance the global search capacity. To increase the particle diversity, a probability function is designed to generate new particles in the updating iteration. When compared to the state-of-the-art estimation algorithms on the epidemic datasets of China, Italy and the US, the proposed method achieves good accuracy and convergence at a comparable computational complexity. The developed framework would be beneficial for experts to understand the characteristics of epidemic development and formulate epidemic prevention and control measures.
Keywords: COVID-19; Mathematical modeling; Parameter estimation; Quantum-behaved particle swarm optimization.
© 2022 Elsevier Inc. All rights reserved.
Conflict of interest statement
The authors declare that they have no known competing financial interests or personal relationships that could have appeared to influence the work reported in this paper.
Figures


References
-
- Souza W., Buss L.F., Candido D., et al. Epidemiological and clinical characteristics of the COVID-19 epidemic in Brazil. Nat. Hum. Behav. 2020;4(8):856–895. - PubMed
-
- Hao X., Cheng S., Wu D., et al. Reconstruction of the full transmission dynamics of COVID-19 in Wuhan. Nature. 2020;584(2020):1–7. - PubMed
LinkOut - more resources
Full Text Sources