. 2022 May 3:10:e13417.
doi: 10.7717/peerj.13417. eCollection 2022.

Integrated lipidomics and RNA sequencing analysis reveal novel changes during 3T3-L1 cell adipogenesis

Affiliations

Integrated lipidomics and RNA sequencing analysis reveal novel changes during 3T3-L1 cell adipogenesis

Yangli Pei et al. PeerJ. .

Abstract

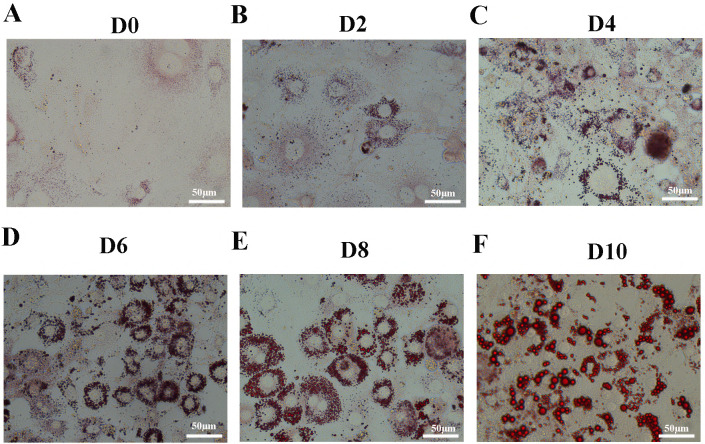
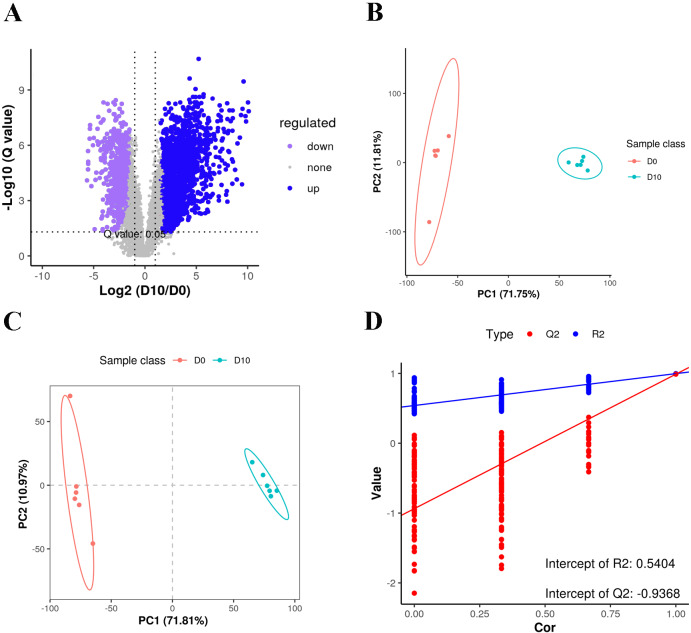
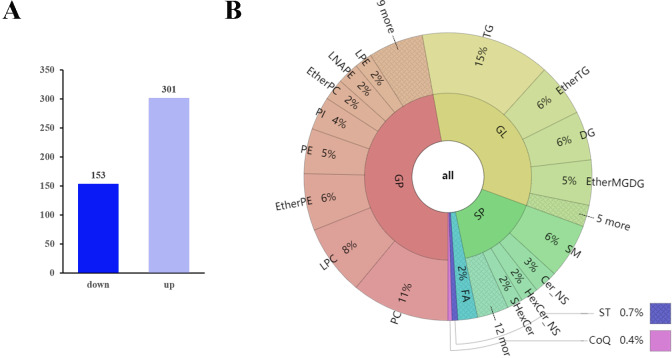
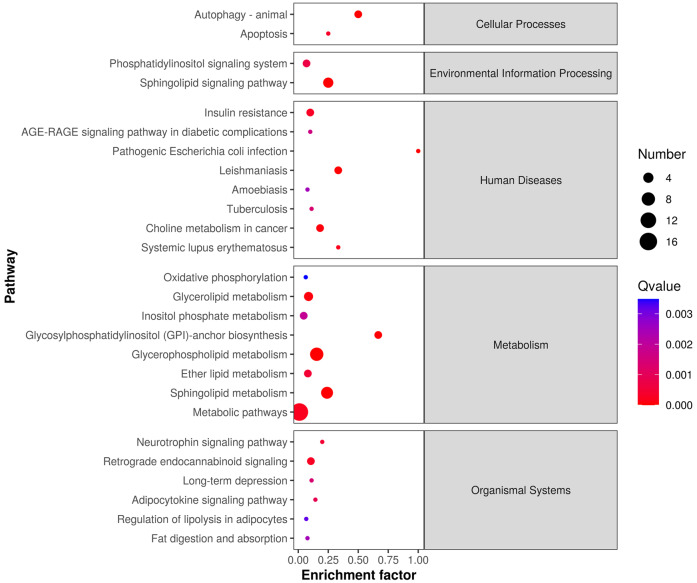
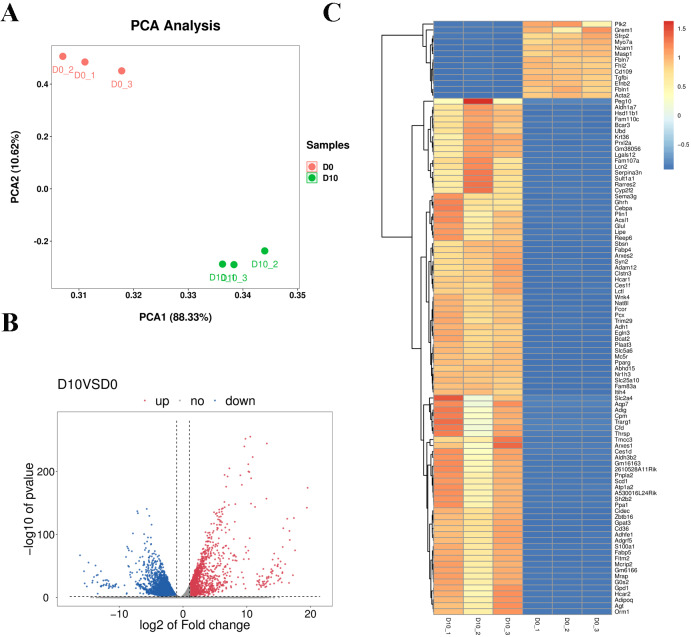
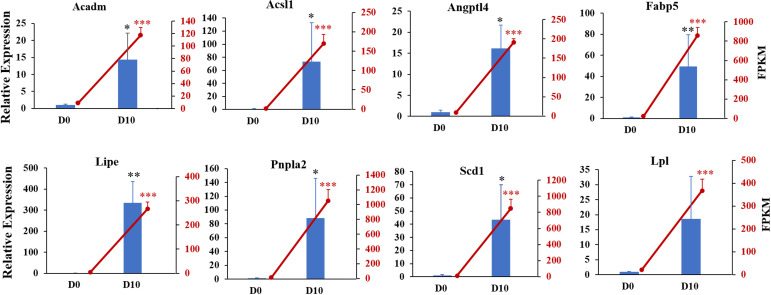
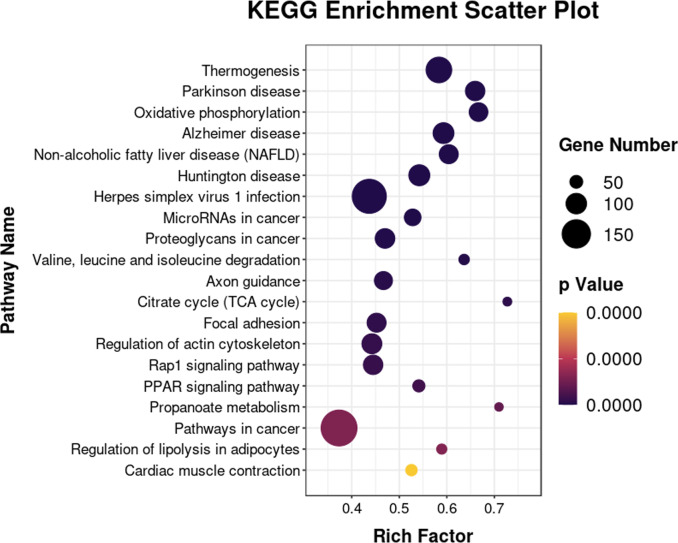
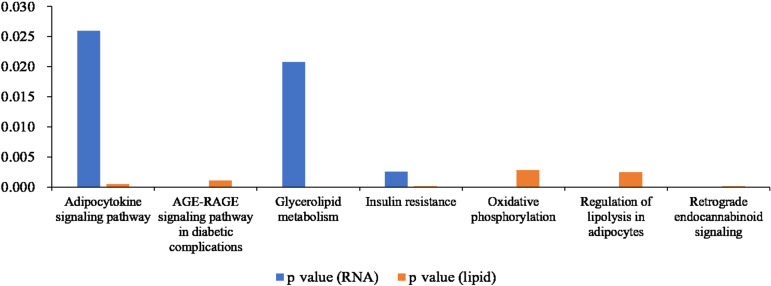
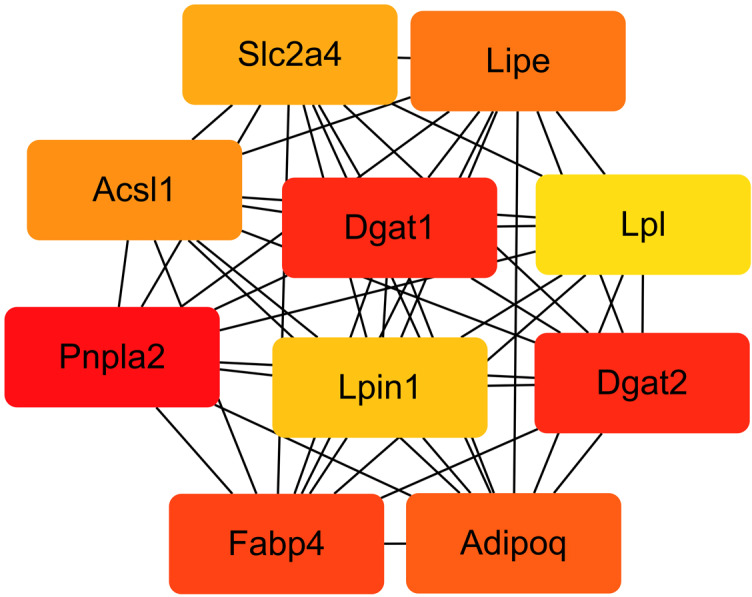
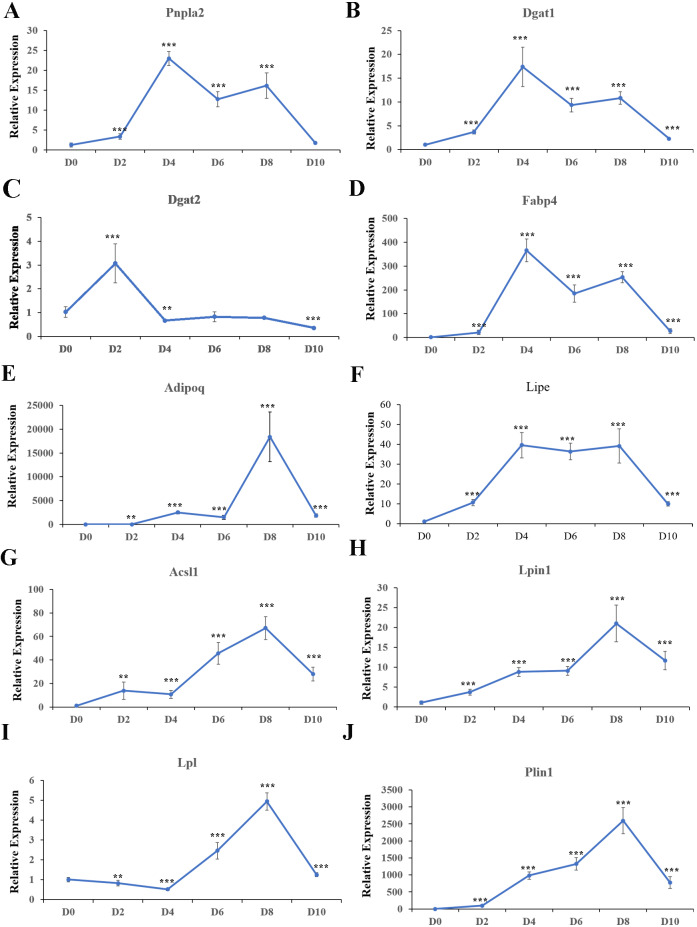
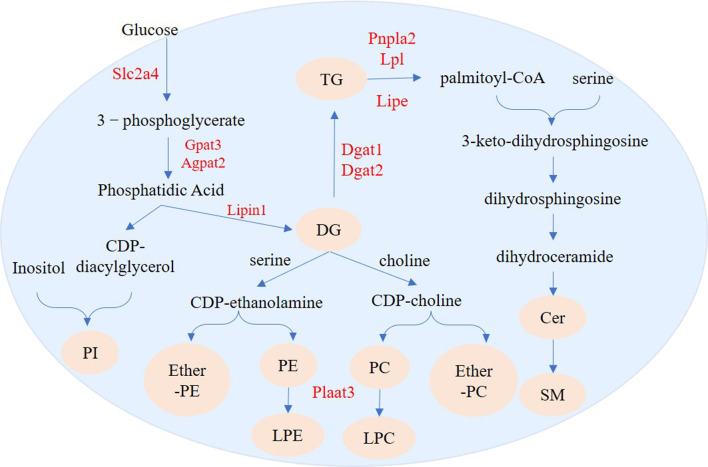
After adipogenic differentiation, key regulators of adipogenesis are stimulated and cells begin to accumulate lipids. To identify specific changes in lipid composition and gene expression patterns during 3T3-L1 cell adipogenesis, we carried out lipidomics and RNA sequencing analysis of undifferentiated and differentiated 3T3-L1 cells. The analysis revealed significant changes in lipid content and gene expression patterns during adipogenesis. Slc2a4 was up-regulated, which may enhance glucose transport; Gpat3, Agpat2, Lipin1 and Dgat were also up-regulated, potentially to enrich intracellular triacylglycerol (TG). Increased expression levels of Pnpla2, Lipe, Acsl1 and Lpl likely increase intracellular free fatty acids, which can then be used for subsequent synthesis of other lipids, such as sphingomyelin (SM) and ceramide (Cer). Enriched intracellular diacylglycerol (DG) can also provide more raw materials for the synthesis of phosphatidylinositol (PI), phosphatidylcholine (PC), phosphatidylethanolamine (PE), ether-PE, and ether-PC, whereas high expression of Pla3 may enhance the formation of lysophophatidylcholine (LPC) and lysophosphatidylethanolamine (LPE). Therefore, in the process of adipogenesis of 3T3-L1 cells, a series of genes are activated, resulting in large changes in the contents of various lipid metabolites in the cells, especially TG, DG, SM, Cer, PI, PC, PE, etherPE, etherPC, LPC and LPE. These findings provide a theoretical basis for our understanding the pathophysiology of obesity.

Keywords: 3T3-L1; Adipogenesis; Ceramide; Diacylglycerol; Lipidomics; Phospholipid; Sphingomyelin; Triacylglycerol.


Conflict of interest statement

The authors declare there are no competing interests.

Figures

Figure 1
Figure 1. Oil Red O staining of 3T3-L1 cells during adipogenesis.
Oil Red O staining of 3T3-L1 cells at D0 (A), D2 (B), D4 (C), D6 (D), D8 (E), and D10 (F) after duction. The red dots inside the cells are lipid droplets.
Figure 2
Figure 2. Volcano plot, PCA and PLS-DA of the detected compounds in the two groups.
(A) Volcano plot of lipid metabolites. (B) PCA scatter plot of differentially expressed lipid metabolites. (C) PLS-DA score plots of D0 and D10 cells based on the extracted spectral data. (D) Permutation plot of PLS-DA based on the extracted spectral data.
Figure 3
Figure 3. Differentially expressed lipid metabolites in two groups.
(A) Among 454 identified differentially expressed metabolites, 301 were upregulated and 153 were downregulated. (B) The differentially expressed lipid metabolites included 214 glycerophospholipids (GPs), 152 glycerolipids (GLs), 73 sphingolipids (SPs), 10 fatty acyls (FAs), three sterol lipids (STs) and two prenol lipids (PLs).
Figure 4
Figure 4. Lipid metabolic pathway analysis of the identified differentially expressed lipid species.
Figure 5
Figure 5. RNA-seq analysis of undifferentiated and differentiated 3T3-L1 cells.
(A) PCA results of the two groups. (B) Volcano plot of DEGs in undifferentiated and differentiated 3T3-L1 cells. Down-regulated genes are represented by blue dots and up-regulated genes are represented by red dots. (C) Heatmap comparison represents gene expression changes.
Figure 6
Figure 6. Gene expression levels from RNA-seq analysis (FPKM) and qRT-PCR (relative expression).
qRT-PCR was used to analyze expression levels of Acadm, Acsl1, Angptl4, Fabp5, Lipe, Pnpla2, Scd1, Npy1r, Pik3cd, and Lpl. The 18s, B2m, and β-actin genes were used as internal references for standardization. Bar graph (Blue) showing results from qRT-PCR (left ordinate). The line chart represents the results from RNA-seq analysis (right ordinate in red).
Figure 7
Figure 7. Bubble diagram of KEGG enrichment result.
Bubble color corresponds to the p value for statistical significance of KEGG pathway enrichment. Bubble size is proportional to the number of genes annotated in a particular pathway.
Figure 8
Figure 8. Histogram showing p values for statistically significant KEGG pathway enrichment overlapping between the differentially expressed gene and differentially expressed metabolite datasets.
Figure 9
Figure 9. Interaction network of the top 10 hub genes.
Figure 10
Figure 10. Relative expression of top 10 hub genes.
qRT-PCR was used to analyze expression of the top 10 hub genes. 18s, B2m, and β-actin served as the internal reference genes.
Figure 11
Figure 11. Regulation pathways of genes and lipid metabolites during 3T3-L1 adipogenesis.
The yellow circles represent the differentially expressed lipid metabolites, and red text represent differentially expressed genes.

Similar articles

Cited by

References

    1. Al Adhami H, Evano B, Le Digarcher A, Gueydan C, Dubois E, Parrinello H, Dantec C, Bouschet T, Varrault A, Journot L. A systems-level approach to parental genomic imprinting: the imprinted gene network includes extracellular matrix genes and regulates cell cycle exit and differentiation. Genome Research. 2015;25:353–367. doi: 10.1101/gr.175919.114. - DOI - PMC - PubMed
    1. Bankaitis VA, Grabon A. Phosphatidylinositol synthase and diacylglycerol platforms bust a move. Developmental Cell. 2011;21:810–812. doi: 10.1016/j.devcel.2011.10.016. - DOI - PMC - PubMed
    1. Bremer J, Figard PH, Greenberg DM. The biosynthesis of choline and its relation to phospholipid metabolism. Biochimica et Biophysica Acta. 1960;43:477–488. doi: 10.1016/0006-3002(60)90470-4. - DOI
    1. Cao J, Li JL, Li D, Tobin JF, Gimeno RE. Molecular identification of microsomal acyl-CoA:glycerol-3-phosphate acyltransferase, a key enzyme in de novo triacylglycerol synthesis. Proceedings of the National Academy of Sciences of the United States of America. 2006;103:19695–19700. doi: 10.1073/pnas.0609140103. - DOI - PMC - PubMed
    1. Chiu HC, Kovacs A, Ford DA, Hsu FF, Garcia R, Herrero P, Saffitz JE, Schaffer JE. A novel mouse model of lipotoxic cardiomyopathy. Journal of Clinical Investigation. 2001;107:813–822. doi: 10.1172/JCI10947. - DOI - PMC - PubMed

Publication types