. 2022 May 3:10:e13137.
doi: 10.7717/peerj.13137. eCollection 2022.

Network subgraph-based approach for analyzing and comparing molecular networks

Affiliations

Network subgraph-based approach for analyzing and comparing molecular networks

Chien-Hung Huang et al. PeerJ. .

Abstract

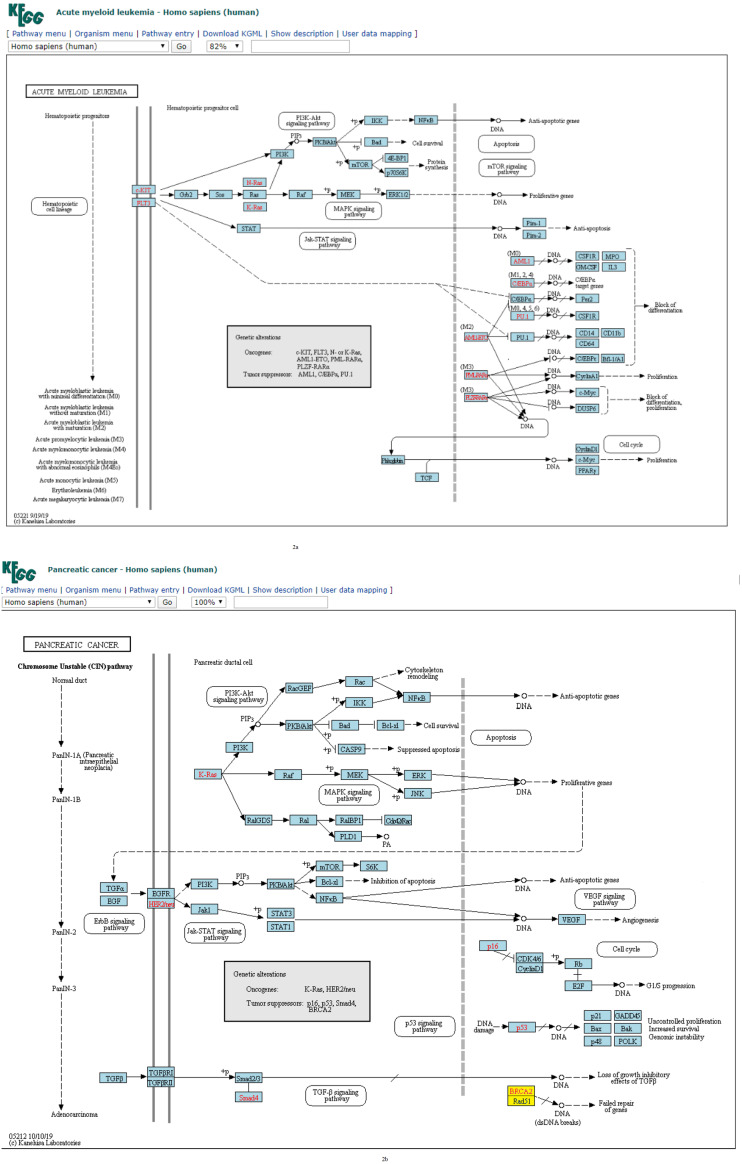
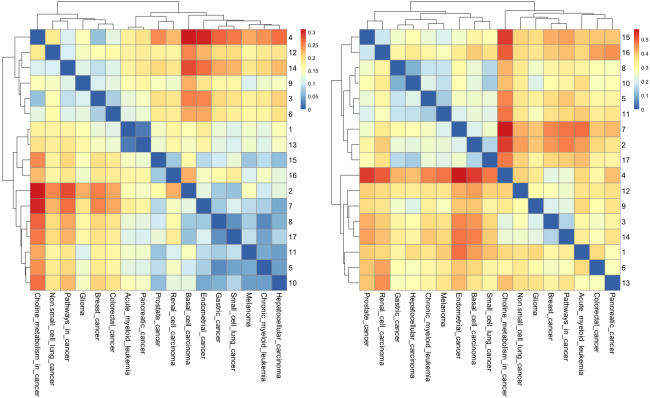
Molecular networks are built up from genetic elements that exhibit feedback interactions. Here, we studied the problem of measuring the similarity of directed networks by proposing a novel alignment-free approach: the network subgraph-based approach. Our approach does not make use of randomized networks to determine modular patterns embedded in a network, and this method differs from the network motif and graphlet methods. Network similarity was quantified by gauging the difference between the subgraph frequency distributions of two networks using Jensen-Shannon entropy. We applied the subgraph approach to study three types of molecular networks, i.e., cancer networks, signal transduction networks, and cellular process networks, which exhibit diverse molecular functions. We compared the performance of our subgraph detection algorithm with other algorithms, and the results were consistent, but other algorithms could not address the issue of subgraphs/motifs embedded within a subgraph/motif. To evaluate the effectiveness of the subgraph-based method, we applied the method along with the Jensen-Shannon entropy to classify six network models, and it achieves a 100% accuracy of classification. The proposed information-theoretic approach allows us to determine the structural similarity of two networks regardless of node identity and network size. We demonstrated the effectiveness of the subgraph approach to cluster molecular networks that exhibit similar regulatory interaction topologies. As an illustration, our method can identify (i) common subgraph-mediated signal transduction and/or cellular processes in AML and pancreatic cancer, and (ii) scaffold proteins in gastric cancer and hepatocellular carcinoma; thus, the results suggested that there are common regulation modules for cancer formation. We also found that the underlying substructures of the molecular networks are dominated by irreducible subgraphs; this feature is valid for the three classes of molecular networks we studied. The subgraph-based approach provides a systematic scenario for analyzing, compare and classifying molecular networks with diverse functionalities.

Keywords: Cancer networks; Cellular processes; Entropy; Graph theory; Information theory; Jensen-Shannon entropy; Network subgraphs; Signal transduction networks.


Conflict of interest statement

The authors declare there are no competing interests.

Figures

Figure 1
Figure 1. Visualization of the results of classification for (A) simulation I, (B) simulation II and (C) simulation III, using MST-kNN.
Figure 2
Figure 2. (A) Three-node subgraph module of the AML network. (B) Three-node subgraph module of the pancreatic cancer network.
Blue color boxes denote genes embedded in a subgraph module. Other colored objects denote genes which are not belong to a subgraph module, red color fonts mean genetic alternation (oncogene or tumor suppressor gene).
Figure 3
Figure 3. (A) Four-node subgraph module of the gastric cancer network. (B) Four-node subgraph module of the hepatocellular carcinoma network.
Blue color boxes denote genes embedded in a subgraph module. Other colored objects denote genes which are not belong to a subgraph module, red color labels mean genetic alternation (oncogene or tumor suppressor gene), and grey colored rectangle in the middle of Figs. 3A and 3B denote scaffold (KEGG annotation).
Figure 4
Figure 4. (A) The plot of the normalized frequency of the three-node subgraphs for the three pairs of cancer networks with the smallest HJS distance. Color labelling of the cancer types: AML (orange), pancreatic cancer (yellow), CML (blue), gastric cancer (purple) and small cell lung cancer (black). (B) The plot of the normalized frequency of the four-node subgraphs for the three pairs of cancer networks with the smallest HJS distance. Color labelling of the cancer types: Gastric cancer (orange), Hepatocellular carcinoma (yellow), Chronic myeloid leukaemia (blue), Melanoma (purple) and Small cell lung cancer (black).
Figure 5
Figure 5. The heatmap of Hjs distance computed for cancer networks: (A) three-node subgraphs and (B) four-node subgraphs, with light yellow and darker red denote the small and large value of Hjs respectively.
The number of each row denotes the network name (File S1).
Figure 6
Figure 6. (A) The plot of the normalized frequency of the three-node subgraphs for three pairs of STN with the smallest HJS distance.
Color labelling of the STN is: Sphingolipid signaling pathway (orange), TGF-beta signaling pathway (yellow), ErbB signaling pathway (blue), Hippo signaling pathway (purple), PI3K-Akt signaling pathway (black) and Ras signaling pathway (pink). (B) The plot of the normalized frequency of the four-node subgraphs for the three pairs of STN with the smallest HJS distance. Color labelling of the STN are: Sphingolipid signaling pathway (orange), Ras signaling pathway (yellow), Adipocytokine signaling pathway (blue), B-cell receptor signaling pathway (purple), Apelin signaling pathway black) and Chemokine signaling pathway (pink).
Figure 7
Figure 7. The heatmap of HJS distance computed for STN: (A) three-node subgraphs and (B) four-node subgraphs, with blue and red denote the small and large value of HJS, respectively. The number of each row denotes the network name (File S1).
Figure 8
Figure 8. (A) The plot of the normalized frequency of the three-node subgraphs for three pairs of cellular processes with the smallest HJS distance. Color labelling of the cellular processes: cell cycle (orange), cellular senescence (yellow), apoptosis (blue), and focal adhesion (purple). (B) The plot of the normalized frequency distributions of the four-node subgraphs for three pairs of cellular processes with the smallest HJS distance. Color labelling of the cellular processes are: cell cycle (orange), cellular senescence (yellow), apoptosis (blue) and focal adhesion (purple).
Figure 9
Figure 9. The heatmap of HJS distance computed for cellular processes: (a) three-node subgraphs and (b) four-node subgraphs, with light yellow and darker red denote a small and large value of HJS respectively.
The number of each row denotes the network name (File S1).
Figure A1
Figure A1. A comparison of two identification algorithms: mfinder and PatternFinder.
Figure A2
Figure A2. (A) An input network named ‘net’ and (B) the four-node subgraph ‘id_2204’.

Similar articles

Cited by

References

    1. Aparìcio DO, Ribeiro PMP, Silva FMA. Network comparison using directed graphlets. 2015. 1511.01964
    1. Arakelyan A, Nersisyan L. KEGGParser: parsing and editing KEGG pathway maps in Matlab. Bioinformatics. 2013;29(4):518–519. doi: 10.1093/bioinformatics/bts730. - DOI - PubMed
    1. Arefin AS, Vimieiro R, Riveros C, Craig H, Moscato P. An information theoretic clustering approach for unveiling authorship affinities in Shakespearean era plays and poems. PLOS ONE. 2014;9(10):e111445. doi: 10.1371/journal.pone.0111445. - DOI - PMC - PubMed
    1. Bagrow JP, Bollt EM. An information-theoretic, all-scales approach to comparing networks. Applied Network Science. 2019;4:1–15. doi: 10.1007/s41109-018-0108-x. - DOI
    1. Burack WR, Shaw AS. Signal transduction: hanging on a scaffold. Current Opinion in Cell Biology. 2000;12(2):211–216. doi: 10.1016/S0955-0674(99)00078-2. - DOI - PubMed

Publication types