Impacts of Covid-19 interventions on air quality: evidence from Brazilian metropolitan regions
- PMID: 35529589
- PMCID: PMC9063257
- DOI: 10.1007/s13762-022-04189-6
Impacts of Covid-19 interventions on air quality: evidence from Brazilian metropolitan regions
Abstract
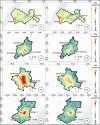
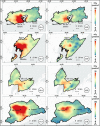
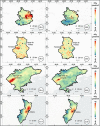
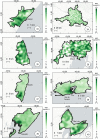
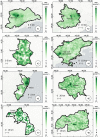
The Covid-19 pandemic has negatively disrupted the way our economy and society functions. Nonetheless, there have also been some positive externalities of the pandemic on the environment. This paper aims to evaluate the concentration of nitrogen dioxide in Brazilian metropolitan regions after the policies adopted to confront Covid-19. In terms of methodological approach, the study employs cross-sectional quantitative analyses to compare the period of 36 days, i.e., 12 March to 16 April-before (in 2019) and after (in 2020) the pandemic declaration. The data were obtained from the Sentinel 5-P low-Earth polar satellite concerning Brazilian metropolitan regions (n = 24). Thorough spatial and statistical analyses were undertaken to identify the pre- and during pandemic nitrogen dioxide concentrations. Complementarily, Spearman's correlation test was performed with variables that impact air quality. The study results a fall in nitrogen dioxide concentration levels in 21 of the 24 metropolitan regions which was observed. The Spearman's correlation coefficient between the nitrogen dioxide variation and the vehicle density was 0.485, at a significance level of 0.05. With these findings in mind, the paper advocates that while the pandemic has a significant negative consequence on the health of population globally, a series of measures that result in a new social organization directly interfere in the reduction of air pollution that contributes to the quality of the air we breathe.
Keywords: Air quality; Brazil; Climate change; Covid-19; Nitrogen dioxide; Urban policy.
© The Author(s) 2022.
Conflict of interest statement
Conflict of interestThe authors declare that there are no conflicts of interest regarding the publication of this manuscript.
Figures





Similar articles
-
The impact of the congestion charging scheme on air quality in London. Part 1. Emissions modeling and analysis of air pollution measurements.Res Rep Health Eff Inst. 2011 Apr;(155):5-71. Res Rep Health Eff Inst. 2011. PMID: 21830496
-
Spatiotemporal analysis of COVID-19, air pollution, climate, and meteorological conditions in a metropolitan region of Iran.Environ Sci Pollut Res Int. 2022 Apr;29(17):24911-24924. doi: 10.1007/s11356-021-17535-x. Epub 2021 Nov 26. Environ Sci Pollut Res Int. 2022. PMID: 34826084 Free PMC article.
-
The impact of COVID-19 lockdowns on surface urban heat island changes and air-quality improvements across 21 major cities in the Middle East.Environ Pollut. 2021 Nov 1;288:117802. doi: 10.1016/j.envpol.2021.117802. Epub 2021 Jul 16. Environ Pollut. 2021. PMID: 34284210 Free PMC article.
-
Recent advances in satellite mapping of global air quality: evidences during COVID-19 pandemic.Environ Sustain (Singap). 2021;4(3):469-487. doi: 10.1007/s42398-021-00166-w. Epub 2021 Mar 29. Environ Sustain (Singap). 2021. PMID: 38624663 Free PMC article. Review.
-
The Minderoo-Monaco Commission on Plastics and Human Health.Ann Glob Health. 2023 Mar 21;89(1):23. doi: 10.5334/aogh.4056. eCollection 2023. Ann Glob Health. 2023. PMID: 36969097 Free PMC article. Review.
References
-
- Aldieri L, Carlucci F, Vinci CP, Yigitcanlar T. Environmental innovation, knowledge spillovers and policy implications: a systematic review of the economic effects literature. J Clean Prod. 2019;239:118051. doi: 10.1016/j.jclepro.2019.118051. - DOI
-
- Arbolino R, Carlucci F, De Simone L, Ioppolo G, Yigitcanlar T. The policy diffusion of environmental performance in the European countries. Ecol Indic. 2018;89:130–138. doi: 10.1016/j.ecolind.2018.01.062. - DOI
-
- Barbieri DM, Lou B, Passavanti M, Hui C, Lessa DA, et al. Survey data regarding perceived air quality in Australia, Brazil, China, Ghana, India, Iran, Italy, Norway, South Africa, United States before and during Covid-19 restrictions. Data Br. 2020;32:2352–3409. doi: 10.1016/j.dib.2020.106169. - DOI - PMC - PubMed
-
- Barry D, Hoyne S. Sustainable measurement indicators to assess impacts of climate change: implications for new green deal era. Curr Opin Environ Sci Health. 2021;22:100259. doi: 10.1016/j.coesh.2021.100259. - DOI
LinkOut - more resources
Full Text Sources
Miscellaneous
