. 2019 Sep 12;9(49):28746-28753.
doi: 10.1039/c9ra05514b. eCollection 2019 Sep 9.

Enhanced stability of an intrinsically disordered protein against proteolytic cleavage through interactions with silver nanoparticles

Affiliations

Enhanced stability of an intrinsically disordered protein against proteolytic cleavage through interactions with silver nanoparticles

Shahid A Malik et al. RSC Adv. .

Abstract

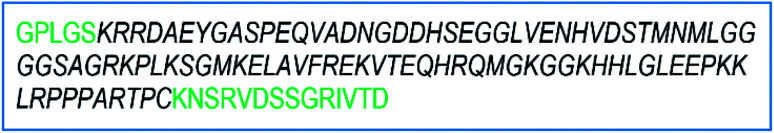
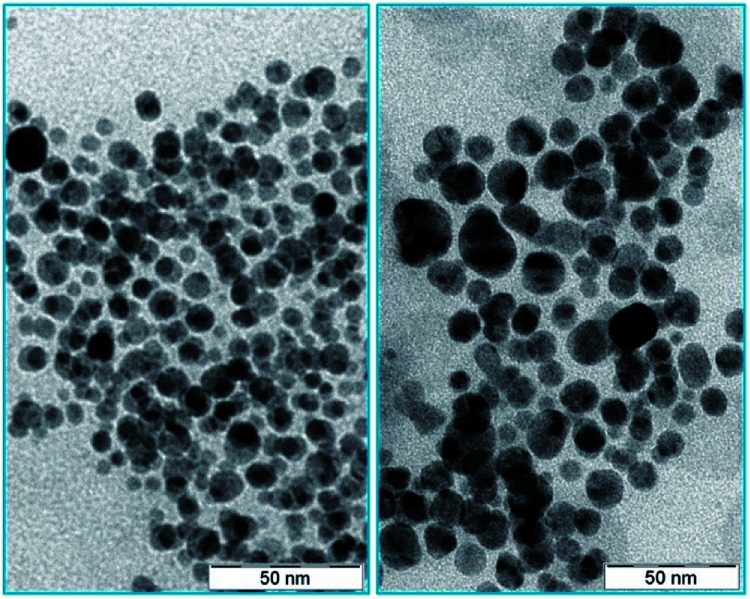
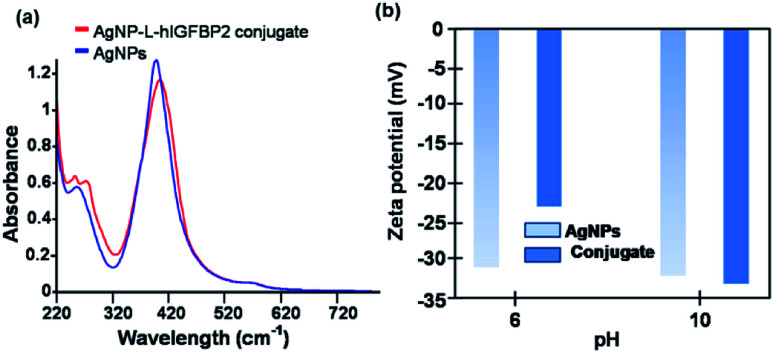
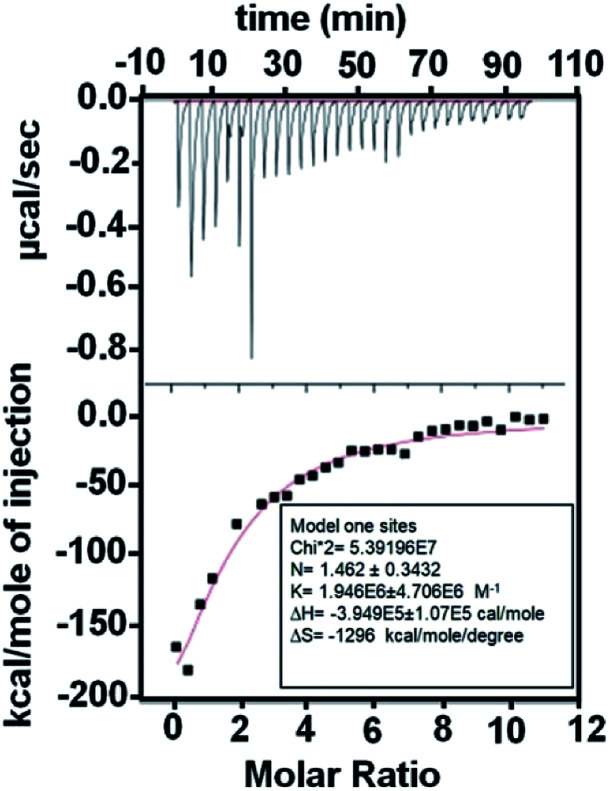
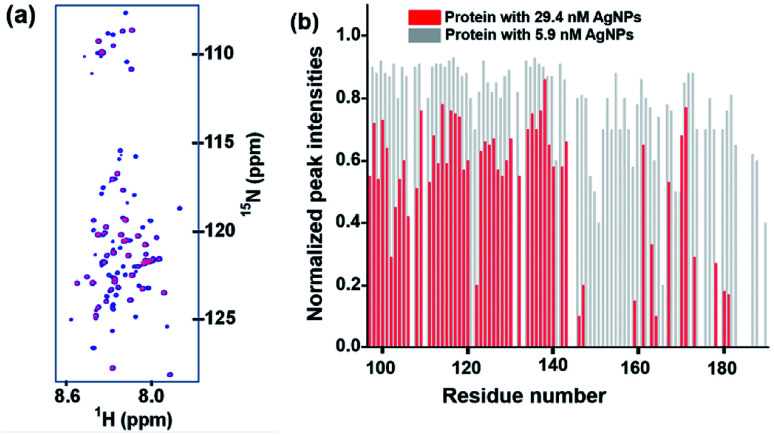
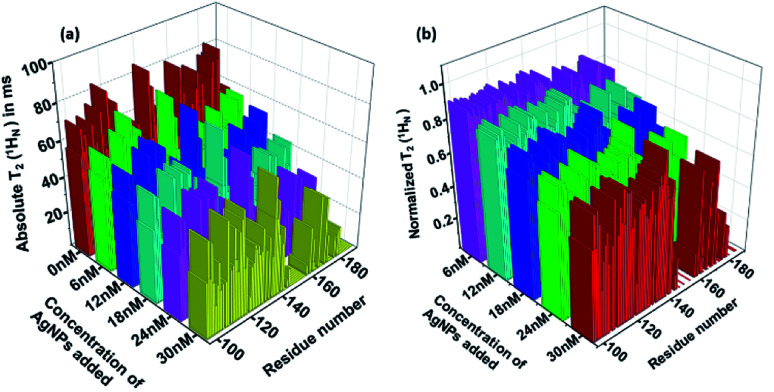
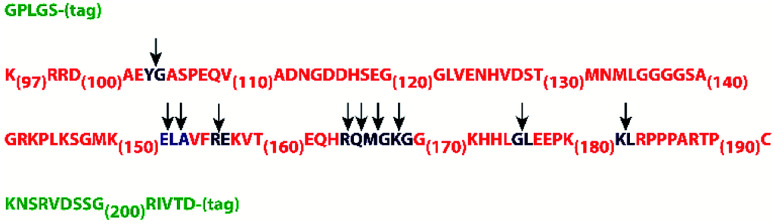
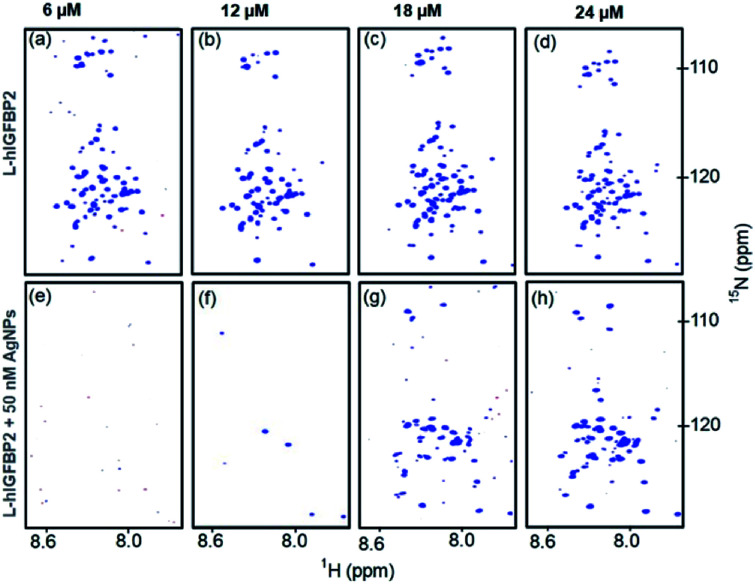
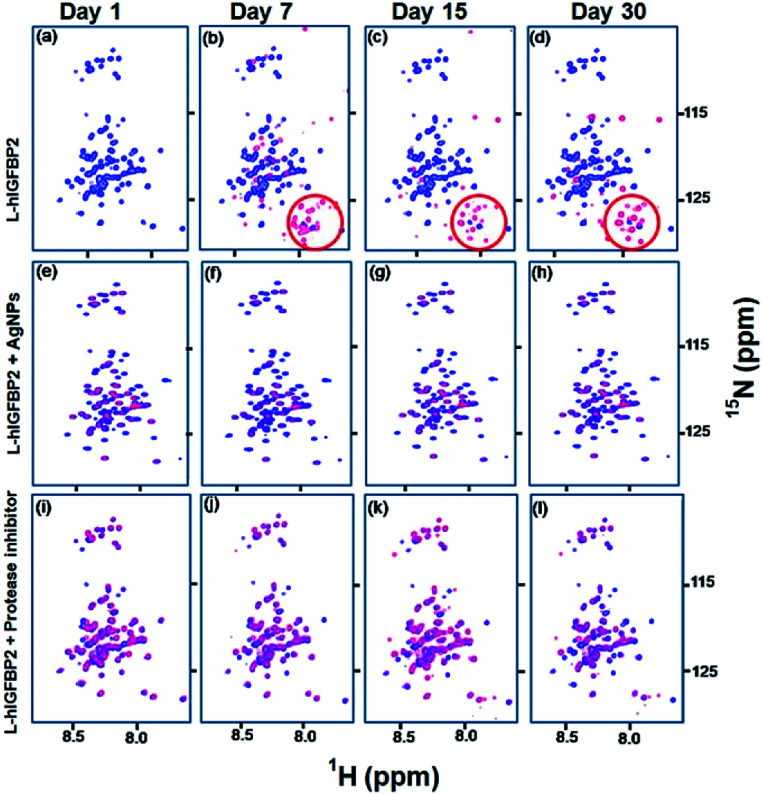
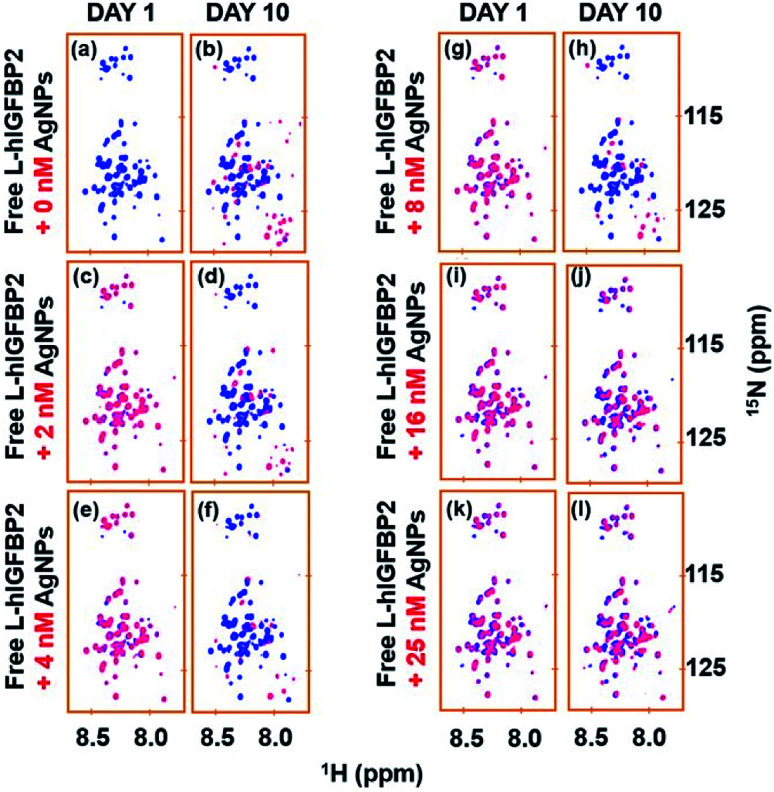
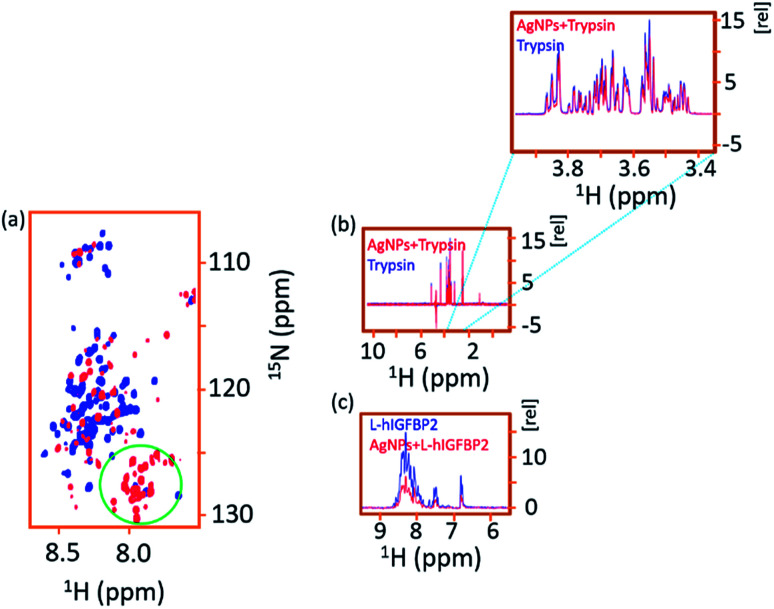
Intrinsically disordered proteins (IDPs), being sensitive to proteolytic degradation both in vitro and in vivo, can be stabilized by the interactions with various binding partners. Here, we show for the first time that silver nanoparticles (AgNPs) have the ability to enhance the half-life of an IDP, thereby rendering it stable for a month against proteolytic degradation. The conjugate of the unstructured linker domain of human insulin-like growth factor binding protein-2 (L-hIGFBP2) with 10 nm citrate-capped AgNPs was studied using two-dimensional NMR spectroscopy and other biophysical techniques. Our studies reveal the extent and nature of residue-specific interactions of the IDP with AgNPs. These interactions mask proteolysis-prone sites of the IDP and stabilize it. This study opens new avenues for the design of appropriate nanoparticles targeting IDPs and for storage, stabilization and delivery of IDPs into cells in a stable form.


Conflict of interest statement

There are no conflicts to declare.

Figures

Scheme 1
Scheme 1. A schematic representation of the amino acid sequence of the L-hIGFBP2 with the additional tag regions coloured in green.
Fig. 1
Fig. 1. TEM images of AgNPs (left) and AgNP–LhIGFBP2 conjugate (right).
Fig. 2
Fig. 2. (a) UV-Vis spectra and (b) zeta potential of AgNPs and AgNP–LhIGFBP2 conjugate.
Fig. 3
Fig. 3. ITC data for the AgNP–LhIGFBP2 interaction.
Fig. 4
Fig. 4. (a) An overlay of 2D [15N, 1H] HSQC spectra of L-hIGFBP2 in free form (blue) and upon addition of AgNPs (red). (b) The relative intensity of peaks of each residue in the 2D [15N, 1H] HSQC spectrum of AgNP–LhIGFBP2 complex. The intensities have been normalized for each residue with respect to its intensity in the free protein. The residue specific assignment of the protein has been described earlier.
Fig. 5
Fig. 5. (a) The absolute T2(1HN) and (b) relative normalized T2(1HN) of each residue calculated from the 2D [15N, 1H] HSQC spectrum using the two-point method (see text) for AgNP–LhIGFBP2 complex at different indicated additions of AgNP.
Fig. 6
Fig. 6. Amino acid sequence of L-hIGFBP2. The residues coloured in green are those which are incorporated within the sequence during the cloning process and the arrows represent the proteolytic sites in the sequence.
Fig. 7
Fig. 7. Reverse titrations. (a–d) 2D [15N, 1H] HSQC spectra of free L-hIGFBP2(top row) at different concentrations of protein (as indicated on the top) and (e–h) 2D [15N, 1H] HSQC spectra of AgNP–LhIGFBP2 conjugate containing 50 nM AgNPs (bottom row) at the same protein concentrations as for the free protein.
Fig. 8
Fig. 8. Stability studies of L-hIGFBP2: (a–d) shows the overlay of 2D [15N, 1H] HSQC spectra of free L-hIGFBP2 (blue) with that of the protein sample at different time intervals (red). The encircled part shows the degradation peaks appearing with time; (e–h) overlay of 2D [15N, 1H] HSQC spectra of free L-hIGFBP2 (blue) with that of the protein in presence of 30 nM AgNPs (red) (see also Fig. 4); (i–l) show the overlay of the spectra of free L-hIGFBP2 (blue) with that of the protein in presence of the protease inhibitor cocktail (red) at different intervals of time (indicated on the top).
Fig. 9
Fig. 9. Overlay of 2D [15N, 1H] HSQC spectra of free L-hIGFBP2 (blue) with that of the protein samples at different concentration of AgNPs (red) on Day 1 and Day 10. The different concentrations of AgNP used in (a)–(l) are indicated on the left of each set.
Fig. 10
Fig. 10. (a) Overlay of 2D [15N, 1H] HSQC spectra of free L-hIGFBP2–AgNP conjugate (blue) with that in presence of trypsin (red). The green circled region shows the appearance of the degradation peaks upon the addition of the trypsin. (b) Overlay of the 1D 1H NMR spectra of free trypsin (blue) with that in presence of AgNPs (red) indicating the protease does not interact with AgNPs. (c) As a comparison to indicate the extent of interaction, the spectrum of L-hIGFBP2 (blue) is shown overlaid with that in presence of AgNPs. Due to the protein–AgNP interactions there is a fall in intensity of the protein spectrum as quantified in Fig. 4.

Similar articles

Cited by

References

    1. Bertrand N. Grenier P. Mahmoudi M. Lima E. M. Appel E. A. Dormont F. Lim J. M. Karnik R. Langer R. Farokhzad O. C. Nat. Commun. 2017;8:777. doi: 10.1038/s41467-017-00600-w. - DOI - PMC - PubMed
    1. Vilanova O. Mittag J. J. Kelly P. M. Milani S. Dawson K. A. Rädler J. O. Franzese G. ACS Nano. 2016;10:10842–10850. doi: 10.1021/acsnano.6b04858. - DOI - PMC - PubMed
    1. Cedervall T. Lynch I. Lindman S. Berggard T. Thulin E. Nilsson H. Dawson K. A. Linse S. Proc. Natl. Acad. Sci. U.S.A. 2007;104:2050–2055. doi: 10.1073/pnas.0608582104. - DOI - PMC - PubMed
    1. Kinnear C. Moore T. L. Rodriguez-Lorenzo L. Rothen-Rutishauser B. Petri-Fink A. Chem. Rev. 2017;117:11476–11521. doi: 10.1021/acs.chemrev.7b00194. - DOI - PubMed
    1. Qie Y. Yuan H. Von Roemeling C. A. Chen Y. Liu X. Shih K. D. Knight J. A. Tun H. W. Wharen R. E. Jiang W. Kim B. Y. S. Sci. Rep. 2016;6:1–11. doi: 10.1038/s41598-016-0001-8. - DOI - PMC - PubMed