. 2022 May;16(2):101295.
doi: 10.1016/j.joi.2022.101295. Epub 2022 May 5.

Further divided gender gaps in research productivity and collaboration during the COVID-19 pandemic: Evidence from coronavirus-related literature

Affiliations

Further divided gender gaps in research productivity and collaboration during the COVID-19 pandemic: Evidence from coronavirus-related literature

Meijun Liu et al. J Informetr. 2022 May.

Abstract

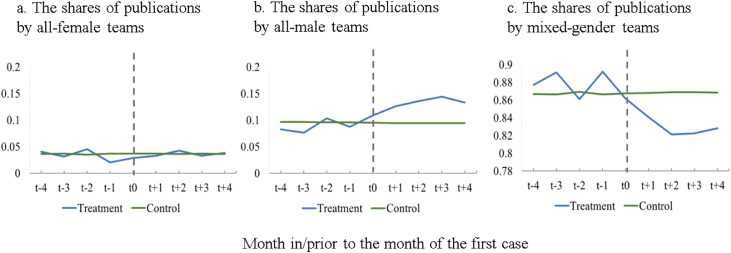
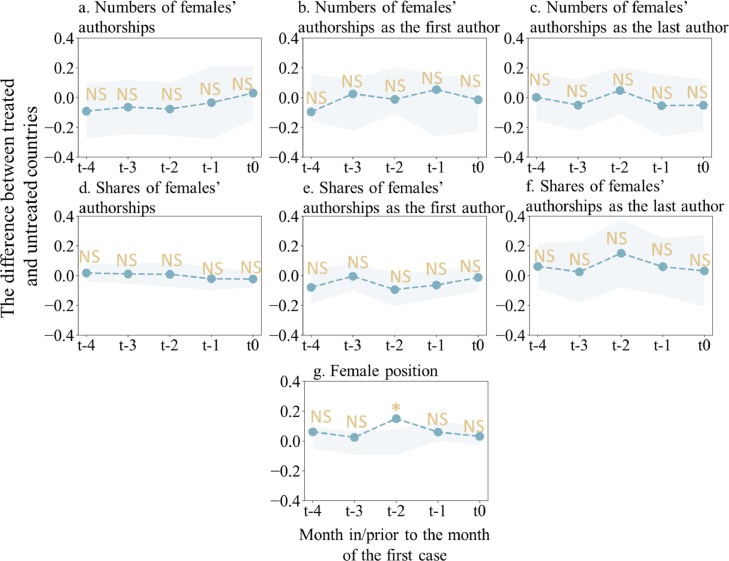
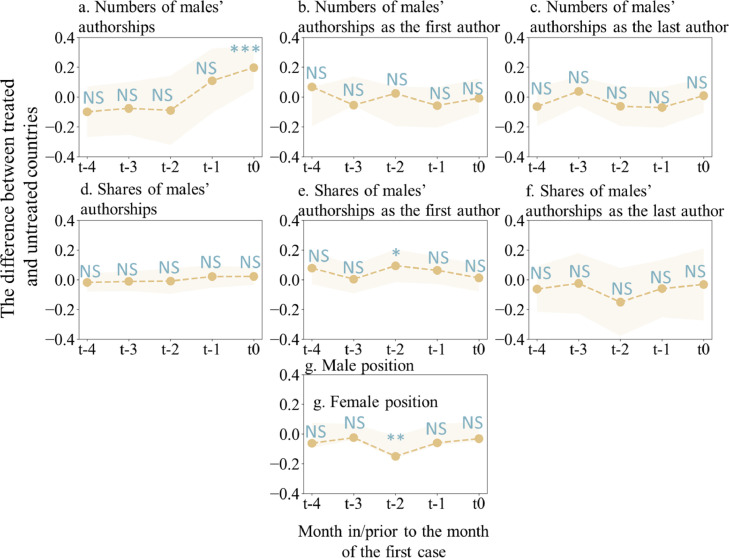
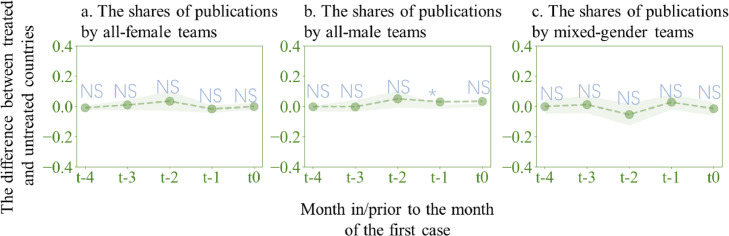
Based on publication data on coronavirus-related fields, this study applies a difference in differences approach to explore the evolution of gender inequalities before and during the COVID-19 pandemic by comparing the differences in the numbers and shares of authorships, leadership in publications, gender composition of collaboration, and scientific impacts. We find that, during the pandemic: (1) females' leadership in publications as the first author was negatively affected; (2) although both females and males published more papers relative to the pre-pandemic period, the gender gaps in the share of authorships have been strengthened due to the larger increase in males' authorships; (3) the share of publications by mixed-gender collaboration declined; (4) papers by teams in which females play a key role were less cited in the pre-pandemic period, and this citation disadvantage was exacerbated during the pandemic; and (5) gender inequalities regarding authorships and collaboration were enhanced in the initial stage of COVID-19, widened with the increasing severity of COVID-19, and returned to the pre-pandemic level in September 2020. This study shows that females' lower participation in teams as major contributors and less collaboration with their male colleagues also reflect their underrepresentation in science in the pandemic period. This investigation significantly deepens our understanding of how the pandemic influenced academia, based on which science policies and gender policy changes are proposed to mitigate the gender gaps.

Keywords: COVID-19; Gender inequality; Mixed-gender collaboration; Scientific collaboration; Scientific impacts.


Figures

Fig 1
Fig. 1
The distribution of treated countries and untreated countries by month. In and after March 2020, all sampled countries were exposed to COVID-19 and thus were treated countries. The Y-axis indicates the number of countries. The X-axis means the month in which the first COVID-19 case has been confirmed in a country.
Fig 2
Fig. 2
The way to aggregate paper-level variables to country-level variables.
Fig 3
Fig. 3
The evolution of the dependent variables with regard to females’ authorships of the treatment groups and control groups. The Y-axis indicates the mean of the dependent variables; t-n/t+n indicate n months prior to/after the month of the first COVID-19 case, and t0 refers to the month of the first COVID-19 case; the dashed gray lines indicate t0.
Fig 4
Fig. 4
The evolution of the dependent variables with regard to males’ authorships of the treatment groups and control groups. The Y-axis indicates the mean of the dependent variables; t-n/t+n indicate n months prior to/after the month of the first COVID-19 case, and t0 refers to the month of the first COVID-19 case; the dashed gray lines indicate t0.
Fig 5
Fig. 5
The evolution of the dependent variables with regard to gender composition of collaboration of the treatment groups and control groups. The Y-axis indicates the mean of the dependent variables; t-n/t+n indicate n months prior to/after the month of the first COVID-19 case, and t0 refers to the month of the first COVID-19 case; the dashed gray lines indicate t0.
Fig 6
Fig. 6
The difference between treatment groups and control groups in dependent variables regarding females’ authorships in and before the month of the first COVID-19 case. The shaded area represents ± 1.96 * std. error of each point estimate; t-n indicate n months prior to the month of the first COVID-19 case, and t0 refers to the month of the first COVID-19 case; the coefficient means the difference between treated countries and untreated countries in dependent variables; ***, **, and * represent significance at the 1, 5, and 10% levels and NS stands for not significant.
Fig 7
Fig. 7
The difference between treatment groups and control groups in dependent variables regarding males’ authorships in and before the month of the first COVID-19 case. The shaded area represents ± 1.96 * std. error of each point estimate; t-n indicate n months prior to the month of the first COVID-19 case, and t0 refers to the month of the first COVID-19 case; the coefficient means the difference between treated countries and untreated countries in dependent variables; ***, **, and * represent significance at the 1, 5, and 10% levels and NS stands for not significant.
Fig 8
Fig. 8
The difference between treatment groups and control groups in dependent variables regarding the share of publications by the three types of teams in and before the month of the first COVID-19 case. The shaded area represents ± 1.96 * std. error of each point estimate; t-n indicate n months prior to the month of the first COVID-19 case, and t0 refers to the month of the first COVID-19 case; the coefficient means the difference between treated countries and untreated countries in dependent variables; ***, **, and * represent significance at the 1, 5, and 10% levels and NS stands for not significant.
Fig 9
Fig. 9
The top 12 countries the three groups of CORD authors belong to.
Fig 10
Fig. 10
Evolution of dependent variables for the 50 sampled countries before and during COVID-19. The dashed lines indicate the month of the global first COVID-19 case, i.e., December 2019.
Fig 11
Fig. 11
The relationship between COVID-19, and females’ authorships and males’ authorships in teams, and the shares of publications by three types of teams. ***, **, and * represent significance at the 1, 5, and 10% levels and NS stands for not significant.
Fig 12
Fig. 12
The relationship between gender composition of teams and citations papers received. ***, **, and * represent significance at the 1, 5, and 10% levels and NS stands for not significant.

Similar articles

Cited by

References

    1. Abramo G., D'Angelo C.A., Murgia G. Gender differences in research collaboration. Journal of Informetrics. 2013;7(4):811–822.
    1. Adams-Prassl A., Boneva T., Golin M., Rauh C. Inequality in the impact of the coronavirus shock: Evidence from real time surveys. Journal of Public Economics. 2020;189(13183) doi: 10.1016/J.JPUBECO.2020.104245. - DOI
    1. Agrawal A.K. The impact of investor protection law on corporate policy and performance: Evidence from the blue sky laws. Journal of Financial Economics. 2013;107(2):417–435.
    1. Alstadsæter A., Bratsberg B., Eielsen G., Kopczuk W., Markussen S., Raaum O., et al. Evidence from norway. NBER working papers. National Bureau of Economic Research; 2020. The first weeks of the coronavirus crisis: Who got hit, when and why?https://www.nber.org/system/files/working_papers/w27131/w27131.pdf Retrieved from.
    1. Amano-Patiño, N., Faraglia, E., Giannitsarou, C., & Hasna, Z. (2020). Who is doing new research in the time of COVID-19? Not the female economists. Publishing and Measuring Success in Economics, 13.

LinkOut - more resources