. 2022 Apr 20:13:865845.
doi: 10.3389/fimmu.2022.865845. eCollection 2022.

Identifying Immunological and Clinical Predictors of COVID-19 Severity and Sequelae by Mathematical Modeling

Affiliations

Identifying Immunological and Clinical Predictors of COVID-19 Severity and Sequelae by Mathematical Modeling

Noha M Elemam et al. Front Immunol. .

Abstract

Since its emergence as a pandemic in March 2020, coronavirus disease (COVID-19) outcome has been explored via several predictive models, using specific clinical or biochemical parameters. In the current study, we developed an integrative non-linear predictive model of COVID-19 outcome, using clinical, biochemical, immunological, and radiological data of patients with different disease severities. Initially, the immunological signature of the disease was investigated through transcriptomics analysis of nasopharyngeal swab samples of patients with different COVID-19 severity versus control subjects (exploratory cohort, n=61), identifying significant differential expression of several cytokines. Accordingly, 24 cytokines were validated using a multiplex assay in the serum of COVID-19 patients and control subjects (validation cohort, n=77). Predictors of severity were Interleukin (IL)-10, Programmed Death-Ligand-1 (PDL-1), Tumor necrosis factors-α, absolute neutrophil count, C-reactive protein, lactate dehydrogenase, blood urea nitrogen, and ferritin; with high predictive efficacy (AUC=0.93 and 0.98 using ROC analysis of the predictive capacity of cytokines and biochemical markers, respectively). Increased IL-6 and granzyme B were found to predict liver injury in COVID-19 patients, whereas interferon-gamma (IFN-γ), IL-1 receptor-a (IL-1Ra) and PD-L1 were predictors of remarkable radiological findings. The model revealed consistent elevation of IL-15 and IL-10 in severe cases. Combining basic biochemical and radiological investigations with a limited number of curated cytokines will likely attain accurate predictive value in COVID-19. The model-derived cytokines highlight critical pathways in the pathophysiology of the COVID-19 with insight towards potential therapeutic targets. Our modeling methodology can be implemented using new datasets to identify key players and predict outcomes in new variants of COVID-19.

Keywords: Aritficial Intelligence; COVID-19; Machine Learning; RNA seq; ROC analysis; multiplex; transcriptomics.


Conflict of interest statement

The authors declare that the research was conducted in the absence of any commercial or financial relationships that could be construed as a potential conflict of interest.

Figures

Figure 1
Figure 1
Pathways Enrichment is the nasopharyngeal swab samples of moderate and severe COVID-19 patients. Functional clustering and pathway analysis of the significantly upregulated genes in the nasopharyngeal swab samples collected from (A) moderate and (B) severe COVID-19 patients in comparison to healthy patients. DEGs were identified using DESeq2 algorithm; the genes were filtered according to adjusted p-value of <0.05 and fold change >2 or <0.5. The functional clustering analysis was performed using Metascape; p-value cut-off for pathways inclusion was <0.01.
Figure 2
Figure 2
Transcriptomics Analysis of nasopharyngeal swab samples and whole blood samples from COVID-19 patients. (A) Gene expression of cytokines and inflammatory mediators from the nasopharyngeal swap RNA-seq data compared across the different severity groups of COVID-19 cases (asymptomatic, mild, moderate, and severe) in reference to the non-COVID-19 control group. The data represented as log 2 normalized expression, where the normalized was performed using DESeq2 normalization approach across all the examined samples. (B) Gene expression of cytokines and inflammatory mediators from the whole blood RNA-seq dataset, compared across the different severity groups of COVID-19 cases (asymptomatic, mild, complicated, and critical) in reference to the non-COVID-19 control group. The data represented as log 2 normalized expression. * represents p-value < 0.05; ** represents p-value < 0.01; *** represents p-value < 0.001; analyzed using one-way ANOVA with post hoc Tukey’s multiple comparisons test.
Figure 3
Figure 3
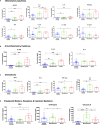
Cytokine assessment in healthy control subjects (n =40), mild-moderate COVID-19 (n= 20) and severe COVID-19 (n=17) patients. (A) Inflammatory, (B) anti-inflammatory cytokines, (C) chemokines, and (D) checkpoint markers, receptors and cytotoxic mediators were assessed in mild-moderate and severe COVID-19 patients and their levels compared to healthy controls. Data is expressed as mean ± standard error of mean (SEM). *p<0.05, ** p<0.01, ***p<0.001, and **** p<0.0001.
Figure 4
Figure 4
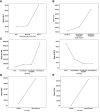
Key driver predictors identified from Multivariate ANOVA with Bonferroni’s stringent multiple testing for (A) disease severity, (B) the requirement for oxygen support, (C) Radiological findings, and (D, E) abnormal liver function indicated by (D) ALT and (E) AST. Means of the predictors’ levels presented as a function of the target variables categories.
Figure 5
Figure 5
(A) Heat map representation of the unsupervised hierarchical clustering and (B) Principal Component Analysis (PCA) plot representation of the k-means clustering analysis of cytokines protein expression in the blood samples of COVID-19 patients of different degrees of severity (3 mild, 17 moderate, and 17 severe). ROC analysis of the predictive capacity of the cytokines (AUC=0.93 ± 0.037, 95% CI=0.86-1, p<0.0001). ROC analysis of the predictive capacity of the biochemical markers (AUC=0.98 ± 0.02, 95% CI=0.94-1, p<0.0001), identified using the mathematical models to stratify COVID-19 patients according to disease severity.
Figure 6
Figure 6
Graphical Abstract of the work flow and the main results.

Similar articles

Cited by

References

    1. Fajgenbaum DC, June CH. Cytokine Storm. N Engl J Med (2020) 383(23):2255–73. doi: 10.1056/NEJMra2026131 - DOI - PMC - PubMed
    1. Xu Z-S, Shu T, Kang L, Wu D, Zhou X, Liao B-W, et al. . Temporal Profiling of Plasma Cytokines, Chemokines and Growth Factors From Mild, Severe and Fatal COVID-19 Patients. Signal Transduct Targeted Ther (2020) 5(1):100. doi: 10.1038/s41392-020-0211-1 - DOI - PMC - PubMed
    1. Guo J, Wang S, Xia H, Shi D, Chen Y, Zheng S, et al. . Cytokine Signature Associated With Disease Severity in COVID-19. Front Immunol (2021) 12:681516. doi: 10.3389/fimmu.2021.681516 - DOI - PMC - PubMed
    1. Ramatillah DL, Gan SH, Pratiwy I, Syed Sulaiman SA, Jaber AAS, Jusnita N, et al. . Impact of Cytokine Storm on Severity of COVID-19 Disease in a Private Hospital in West Jakarta Prior to Vaccination. PloS One (2022) 17(1):e0262438-e. doi: 10.1371/journal.pone.0262438 - DOI - PMC - PubMed
    1. Furlow B. COVACTA Trial Raises Questions About Tocilizumab’s Benefit in COVID-19. Lancet Rheumatol (2020) 2(10):e592. doi: 10.1016/S2665-9913(20)30313-1 - DOI - PMC - PubMed

Publication types