. 2022 Jan 19;3(2):100301.
doi: 10.1016/j.xplc.2022.100301. eCollection 2022 Mar 14.

Structural analysis of receptor-like kinase SOBIR1 reveals mechanisms that regulate its phosphorylation-dependent activation

Affiliations

Structural analysis of receptor-like kinase SOBIR1 reveals mechanisms that regulate its phosphorylation-dependent activation

Xue Wei et al. Plant Commun. .

Abstract

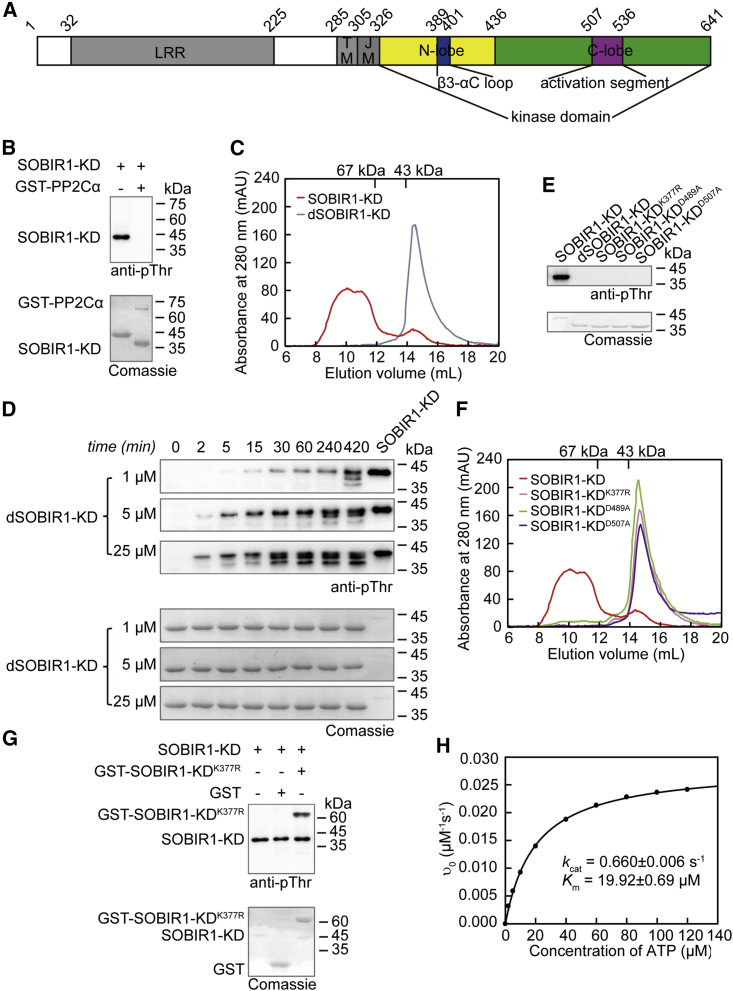
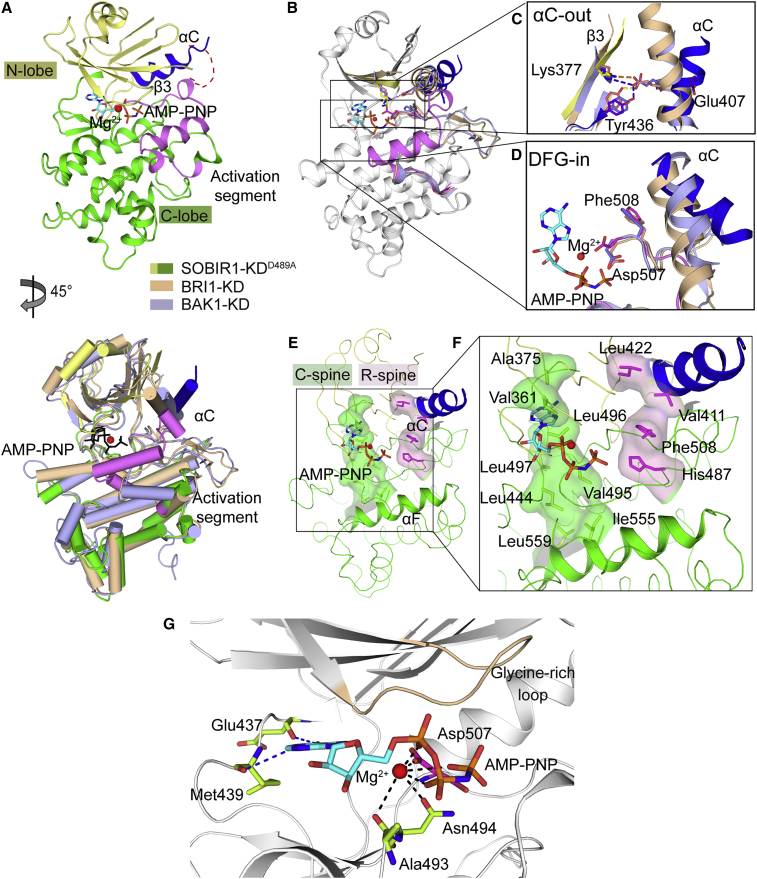
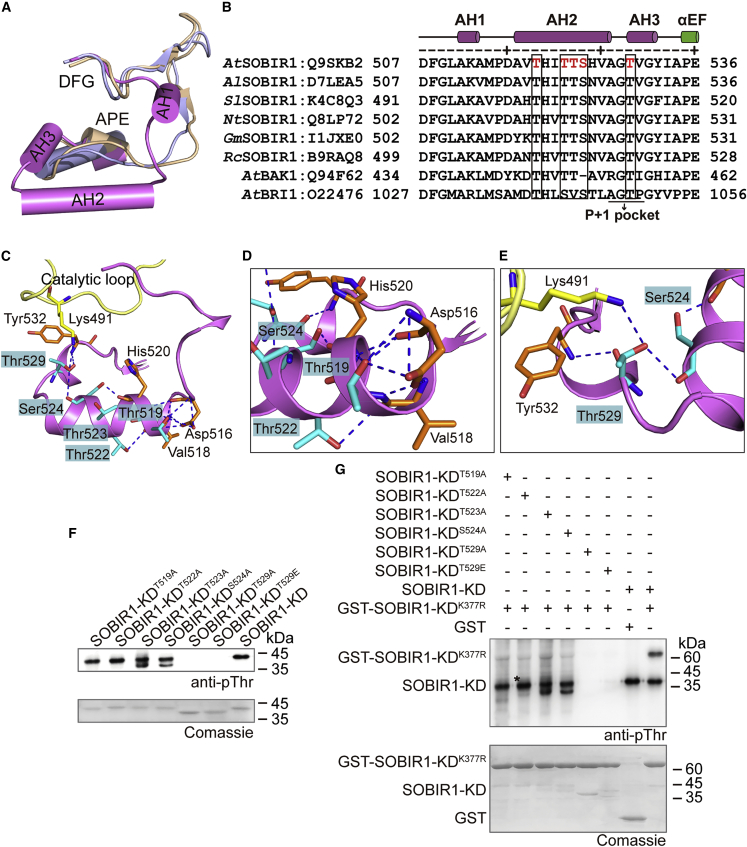
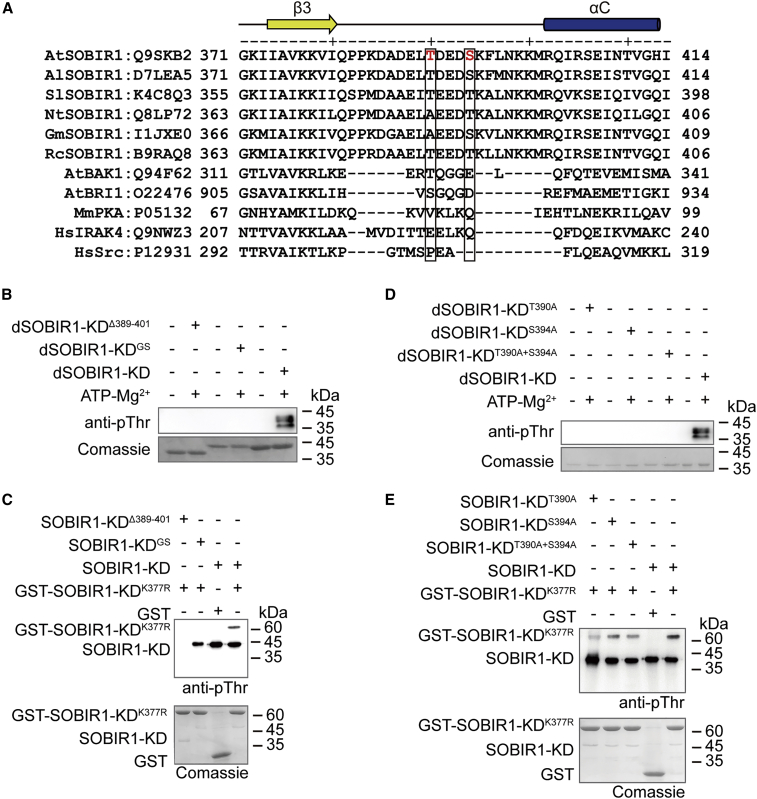
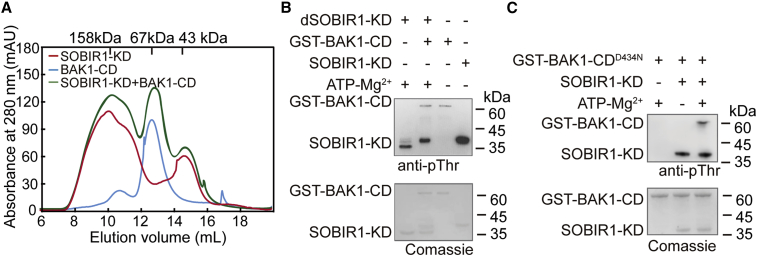
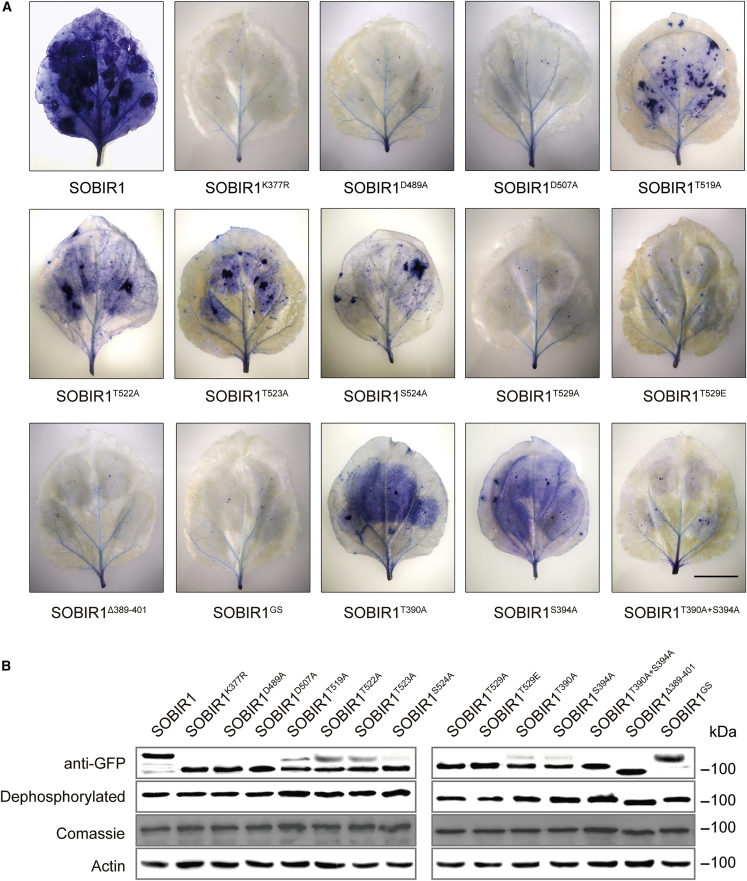
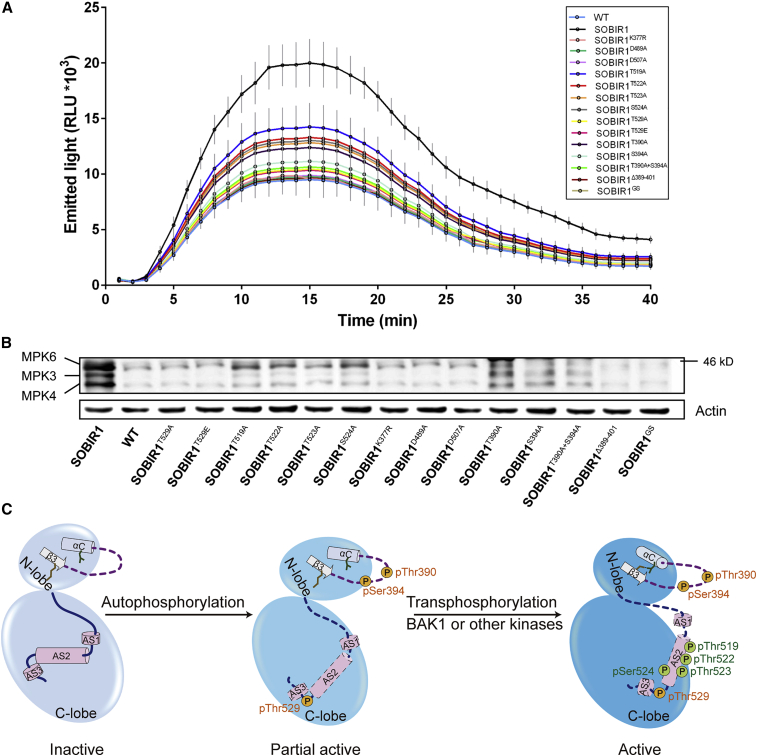
Plant leucine-rich repeat (LRR) receptor-like kinases (RLKs) and LRR receptor-like proteins (RLPs) comprise a large family of cell surface receptors that play critical roles in signal perception and transduction. Both LRR-RLKs and LRR-RLPs rely on regulatory LRR-RLKs to initiate downstream signaling pathways. BRASSINOSTEROID INSENSITIVE 1-ASSOCIATED KINASE 1/SOMATIC EMBRYOGENESIS RECEPTOR KINASE 3 (BAK1/SERK3) and SUPPRESSOR OF BIR1-1 (SOBIR1) are important and extensively studied regulatory LRR-RLKs with distinct functions. Although the regulatory mechanism of BAK1 activation has been studied in detail, the activation mechanism of SOBIR1 remains poorly understood. Here, the crystal structures of the catalytically inactive kinase domain of SOBIR1 (SOBIR1-KD) from Arabidopsis thaliana were determined in complexes with AMP-PNP and Mg2+. The results show that SOBIR1-KD contains a uniquely long β3-αC loop and adopts an Src-like inactive conformation with an unusual architecture at the activation segment, which comprises three helices. Biochemical studies revealed that SOBIR1 is transphosphorylated by BAK1 following its autophosphorylation via an intermolecular mechanism, and the phosphorylation of Thr529 in the activation segment and the β3-αC loop are critical for SOBIR1 phosphorylation. Further functional analysis confirmed the importance of Thr529 and the β3-αC loop for the SOBIR1-induced cell death response in Nicotiana benthamiana. Taken together, these findings provide a structural basis for the regulatory mechanism of SOBIR1 and reveal the important elements and phosphorylation events in the special stepwise activation of SOBIR1-KD, the first such processes found in regulatory LRR-RLKs.

Keywords: LRR-RLK; SOBIR1; autophosphorylation; crystal structure; stepwise activation; unusual architecture.


Figures

Figure 1
Figure 1
Biochemical properties of SOBIR1-KD (A) Schematic diagram of AtSOBIR1 (Swiss-Prot ID: Q9SKB2). LRR domain (shown in gray); TM domain (shown in gray); juxtamembrane (JM) domain (shown in gray); N-lobe, N-terminal lobe (shown in yellow); C-lobe, C-terminal lobe (shown in green). The β3-αC loop and the activation segment are presented in blue and magenta, respectively. (B) Phosphorylation states of the recombinant wild-type and PP2Cα-dephosphorylated SOBIR1-KD analyzed with a general anti-phospho-Thr antibody. The reaction mixture contained 10 μM SOBIR1-KD and 1 μM GST-PP2Cα. (C) Determination of oligomerization states via SEC at a concentration of approximately 20 μM. Wild-type SOBIR1-KD eluted as a multimer, whereas the elution volume for the PP2Cα-dephosphorylated SOBIR1-KD corresponded to an apparent molecular mass of 36–40 kDa, which is consistent with the calculated monomeric molecular mass of 36 kDa. Elution volumes of the protein standards are indicated. (D) Time-course analysis of SOBIR1-KD intermolecular autophosphorylation. Specifically, 1, 5, and 25 μM PP2Cα-dephosphorylated SOBIR1-KD samples were incubated with 1 mM ATP and 10 mM Mg2+ for the indicated period. (E) Phosphorylation states of wild-type SOBIR1-KD, PP2Cα-dephosphorylated SOBIR1-KD, and the kinase-dead mutants SOBIR1-KDK377R, SOBIR1-KDD489A, and SOBIR1-KDD507A. (F) Determination of oligomerization states via SEC at a concentration of approximately 20 μM. Wild-type SOBIR1-KD eluted as a multimer, whereas the elution volumes for kinase-dead mutants, SOBIR1-KDK377R, SOBIR1-KDD489A, and SOBIR1-KDD507A corresponded to an apparent molecular mass of 36–40 kDa, which is consistent with the calculated monomeric molecular mass of 36 kDa. Elution volumes of the protein standards are indicated. (G) Western blotting analysis of the transphosphorylation of SOBIR1-KDK377R by wild-type SOBIR1-KD. The reaction mixture contained 10 μM GST-SOBIR1-KDK377R and 1 μM SOBIR1-KD. As a negative control, GST was incubated with wild-type SOBIR1-KD, and its phosphorylation signal was undetectable. (H) Effects of ATP concentration on the initial velocity of the SOBIR1-KD-catalyzed reaction. The reaction mixture contained 50 nM wild-type SOBIR1-KD and 2, 5, 10, 20, 40, 60, 80, 100, or 120 μM ATP. The solid line represents the best-fitting result according to the Michaelis-Menten equation, with kcat and Km values of 0.660 ± 0.006 s−1 and 19.92 ± 0.69 μM, respectively.
Figure 2
Figure 2
Overall structure of SOBIR1-KDD489A complexed with the non-hydrolyzable ATP analog AMP-PNP (A) Two views of the SOBIR1-KDD489A ribbon structure (45° rotation around a vertical axis). The SOBIR1-KDD489A color scheme is the same as that in the schematic diagram in Figure 1A. The bound AMP-PNP is presented as an orange stick, whereas Mg2+ is indicated by a red sphere. The disordered β3-αC loop is presented as a red dashed line. The same SOBIR1-KDD489A color scheme is used in the following figures, unless otherwise indicated. A structural comparison between SOBIR1-KD and BRI1-CD (PDB: 5LPY, in wheat) and BAK1-CD (PDB: 3UIM, in light blue) is presented in the right panel. The same BRI1-CD and BAK1-CD color scheme is used in the following figures, unless otherwise indicated. The AMP-PNP and Mg2+ in SOBIR1-KDD489A are presented as a black stick and a red sphere, respectively. The AMP-PNP and ions in BRI1-CD and BAK1-CD are not shown. (B) Comparison between SOBIR1-KD and BRI1-CD and BAK1-CD after superimposing their active sites. The AMP-PNP and Mg2+ in SOBIR1-KDD489A are presented as an orange stick and a red sphere, respectively. The AMP-PNP and ions in BRI1-CD and BAK1-CD are not shown. (C and D) Close-up views of the active sites with αC-out (C) and DFG-in (D). The essential residues are presented as sticks. Specifically, Lys377 in SOBIR1-KD corresponds to Lys911 in BRI1-CD and Lys317 in BAK1-CD; Glu407 in SOBIR1-KD corresponds to Glu927 in BRI1-CD and Glu334 in BAK1-CD; Tyr436 in SOBIR1-KD corresponds to Tyr956 in BRI1-CD and Tyr363 in BAK1-CD. The hydrogen bonds and salt bridges in BRI1-CD and BAK1-CD are presented as orange and blue dashed lines, respectively. (E and F) C-spine and R-spine in the SOBIR1-KD-AMP-PNP-Mg2+ complex. For clarity, the αC and αF helices are depicted in cartoon form. The C-spine and R-spine are presented in green and magenta, respectively (E). Residues forming the C-spine and R-spine in the SOBIR1-KD-AMP-PNP-Mg2+ complex. The C-spine, comprising Val361, Ala375, Leu496, Val495, Leu497, Leu444, Leu555, and Leu559, is indicated by lemon sticks. The AMP-PNP associated with Val361, Ala375, and Leu496 is presented as an orange stick. The R-spine, consisting of Phe508, His487, Val411, and Leu422, is indicated by magenta sticks (F). (G) View of the nucleotide-binding pocket of SOBIR1-KD occupied by AMP-PNP and a single Mg2+. The nucleotides and the nucleotide-interacting residues are presented as cyan and lemon sticks, respectively, whereas Mg2+ is indicated by a red sphere. Hydrogen bonds for the interaction with AMP-PNP and Mg2+ are presented in blue or black dashed lines.
Figure 3
Figure 3
Analyses of the phosphorylation sites in the activation segment of SOBIR1-KD (A) Comparison between the SOBIR1-KD activation segment and the BRI1 and BAK1 structures. SOBIR1, BRI1, and BAK1 are presented in magenta, beige, and light blue, respectively. (B) Sequence alignment of the activation segments of SOBIR1 orthologs from different species as well as AtBAK1 and AtBRI1. The Swiss-Prot ID is provided after each protein name. The secondary structure elements of SOBIR1-KD are indicated above the sequences. Phosphorylation sites identified in AtSOBIR1-KD are highlighted in red. Conserved phosphorylation sites in the kinases are indicated in a black box. The P+1 pocket is labeled accordingly. At, A. thaliana; Al, Arabidopsis lyrata; Sl, S. lycopersicum; Nt, Nicotiana tabacum; Gm, Glycine max; Rc, Ricinus communis. (C–E) View of the interaction networks of Thr519, Thr522, Ser524, and Thr529 in the SOBIR1-KD activation segment. The activation segment is presented in magenta, whereas the catalytic loop is in yellow. The phosphorylation sites identified by LC-MS/MS are labeled and presented in cyan, and the interacting residues are highlighted in orange (in the activation segment) or yellow (in the catalytic loop). Hydrogen bonds are presented as blue dashed lines. Detailed interactions of Thr519, Thr522, Ser524 (D), and Thr529 (E) are presented. (F) Phosphorylation states of the activation segments of the SOBIR1-KD mutants. (G) Western blot analysis of the transphosphorylation of SOBIR1-KDK377R by the SOBIR1-KD mutants. The reaction mixture contained 10 μM GST-SOBIR1-KDK377R and 1 μM SOBIR1-KD mutants. As a negative control, GST was incubated with wild-type SOBIR1-KD, and its phosphorylation signal was undetectable. All proteins in this assay were recombinantly expressed in E. coli. Asterisk (∗) represents a nonspecific band.
Figure 4
Figure 4
The β3-αC loop of SOBIR1-KD is important for SOBIR1 autophosphorylation (A) Sequence alignment of the β3-αC loop of SOBIR1 orthologs from different species and other kinases. The Swiss-Prot ID is provided after each protein name. The secondary structure elements of SOBIR1-KD are indicated above the sequences. Phosphorylation sites identified in AtSOBIR1-KD are highlighted in red. At, A. thaliana; Al, A. lyrata; Sl, S. lycopersicum; Nt, N. tabacum; Gm, G. max; Rc, R. communis; Mm, Mus musculus; Hs, Homo sapiens. (B) Autophosphorylation of PP2Cα-dephosphorylated SOBIR1-KDΔ389-401 and SOBIR1-KDGS. Specifically, 25 μM PP2Cα-dephosphorylated proteins were incubated in the presence or absence of 1 mM ATP and 10 mM Mg2+ for 1 h. (C) Western blotting analysis of the transphosphorylation of SOBIR1-KDK377R by the SOBIR1-KD mutants. The reaction mixture contained 10 μM GST-SOBIR1-KDK377R and 1 μM SOBIR1-KD mutants. As a negative control, GST was incubated with wild-type SOBIR1-KD, and its phosphorylation signal was undetectable. (D) Autophosphorylation of PP2Cα-dephosphorylated SOBIR1-KDT390A, SOBIR1-KDS394A, and SOBIR1-KDT390A+S394A. Specifically, 25 μM PP2Cα-dephosphorylated proteins were incubated in the presence or absence of 1 mM ATP and 10 mM Mg2+ for 1 h. Reactions were terminated by boiling in 2× loading buffer, and samples were then analyzed by SDS-PAGE and western blotting. (E) Western blotting analysis of the transphosphorylation of SOBIR1-KDK377R by the SOBIR1-KD mutants. The reaction mixture contained 10 μM GST-SOBIR1-KDK377R and 1 μM SOBIR1-KD mutants. As a negative control, GST was incubated with wild-type SOBIR1-KD, and its phosphorylation signal was undetectable.
Figure 5
Figure 5
Reciprocal phosphorylation between SOBIR1 and BAK1 (A) Determination of the oligomerization states of SOBIR1-KD, BAK1-CD, and SOBIR1-KD incubated with BAK1-CD via SEC. The reaction mixture contained 30 μM SOBIR1-KD and 10 μM GST-BAK1-CD. Elution volumes of the protein standards are indicated. (B) Western blotting analysis of the transphosphorylation of PP2Cα-dephosphorylated SOBIR1-KD by wild-type BAK1-CD. The reaction mixture contained 10 μM dSOBIR1-KD and 1 μM GST-BAK1-CD. (C) Western blotting analysis of the transphosphorylation of BAK1-CDD434N by wild-type SOBIR1-KD. The reaction mixture contained 10 μM GST-BAK1-CDD434N and 1 μM SOBIR1-KD.
Figure 6
Figure 6
Trypan blue staining of SOBIR1 variants expressed in N. benthamiana (A)AtSOBIR1 and various mutants fused to C-terminally enhanced green fluorescent protein were transiently expressed in N. benthamiana by Agrobacterium-mediated transient expression (agroinfiltrations). Pictures of representative leaves stained with trypan blue exhibit levels of cell death. All assays were performed three times, and a representative photograph is shown. Scale bar, 2 cm. (B) All infiltrated N. benthamiana leaves were collected after phenotype analysis, mixed with 2× loading buffer (v/v), and boiled at 95°C for 15 min. Expression levels of all proteins were then checked by western blotting with anti-GFP antibody.
Figure 7
Figure 7
Analysis of ROS production and MAPK activation mediated by SOBIR1 and its mutant variants using transient expression assays in N. benthamiana (A and B) flg22-induced ROS burst in N. benthamiana expressing SOBIR1 and its mutant variants. AtSOBIR1 and all mutant variants were transiently expressed in leaves of N. benthamiana by agroinfiltration. After 2 days, oxidative burst and MAPK activation were induced by treatment with 300 nM flg22. ROS production over time was measured by a luminol-based assay after flg22 treatment (A). flg22-induced MAPK activation was measured by immunoblotting with anti-ERK 15 min after flg22 treatment (B). Error bars, ±SD of six replicates. Wild-type represents N. benthamiana without SOBIR1 expression and was used as a negative control. The actin level was used as the loading control. All experiments were performed in triplicate with similar results. (C) Model of SOBIR1-KD stepwise activation. Inactive SOBIR1 is not phosphorylated. The β3-αC loop is disordered and the Lys-Glu salt bridge is broken because of the outward-facing αC helix (αC-out). The activation segment uniquely forms three helices without any phosphorylated sites (left). Ligand recognition induces conformational changes to SOBIR1, leading to SOBIR1 autophosphorylation. In addition, Thr390 and Ser394 in the βC-αC loop and Thr529 in the activation segment are phosphorylated during this process, and SOBIR1 is partially active (middle). BAK1 or other kinases then transphosphorylate SOBIR1 at Thr519, Thr522, Thr523, and Ser524 to fully activate SOBIR1. During the activation, these phosphorylation events re-position the helices within the activation segment and enable the αC helix to swing inward toward the ATP-binding site (right). Finally, the SOBIR1-KD adopts a fully active conformation. Specifically, the activation segment is extended with phosphorylated sites to provide a platform for protein substrate binding and the induction of downstream signaling.

Similar articles

Cited by

References

    1. Adams P.D., Afonine P.V., Bunkoczi G., Chen V.B., Davis I.W., Echols N., Headd J.J., Hung L.W., Kapral G.J., Grosse-Kunstleve R.W., et al. PHENIX: a comprehensive Python-based system for macromolecular structure solution. Acta Crystallogr. D Biol. Crystallogr. 2010;66:213–221. - PMC - PubMed
    1. Albert I., Bohm H., Albert M., Feiler C.E., Imkampe J., Wallmeroth N., Brancato C., Raaymakers T.M., Oome S., Zhang H., et al. An RLP23-SOBIR1-BAK1 complex mediates NLP-triggered immunity. Nat. Plants. 2015;1:15140. - PubMed
    1. Albert I., Zhang L., Bemm H., Nurnberger T. Structure-function analysis of immune receptor AtRLP23 with its ligand nlp20 and coreceptors AtSOBIR1 and AtBAK1. Mol. Plant Microbe Interact. 2019;32:1038–1046. - PubMed
    1. Aquino B., Counago R.M., Verza N., Ferreira L.M., Massirer K.B., Gileadi O., Arruda P.F. Structural characterization of maize SIRK1 kinase domain reveals an unusual architecture of the activation segment. Front. Plant Sci. 2017;8:852. - PMC - PubMed
    1. Bastidas A.C., Deal M.S., Steichen J.M., Guo Y., Wu J., Taylor S.S. Phosphoryl transfer by protein kinase A is captured in a crystal lattice. J. Am. Chem. Soc. 2013;135:4788–4798. - PMC - PubMed

Publication types

MeSH terms