. 2022 Mar;12(3):1416-1431.
doi: 10.1016/j.apsb.2021.12.001. Epub 2021 Dec 6.

Co-delivery of photosensitizer and diclofenac through sequentially responsive bilirubin nanocarriers for combating hypoxic tumors

Affiliations

Co-delivery of photosensitizer and diclofenac through sequentially responsive bilirubin nanocarriers for combating hypoxic tumors

Yang Zhou et al. Acta Pharm Sin B. 2022 Mar.

Abstract

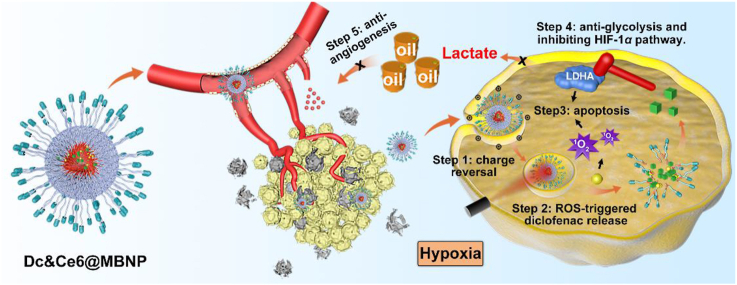
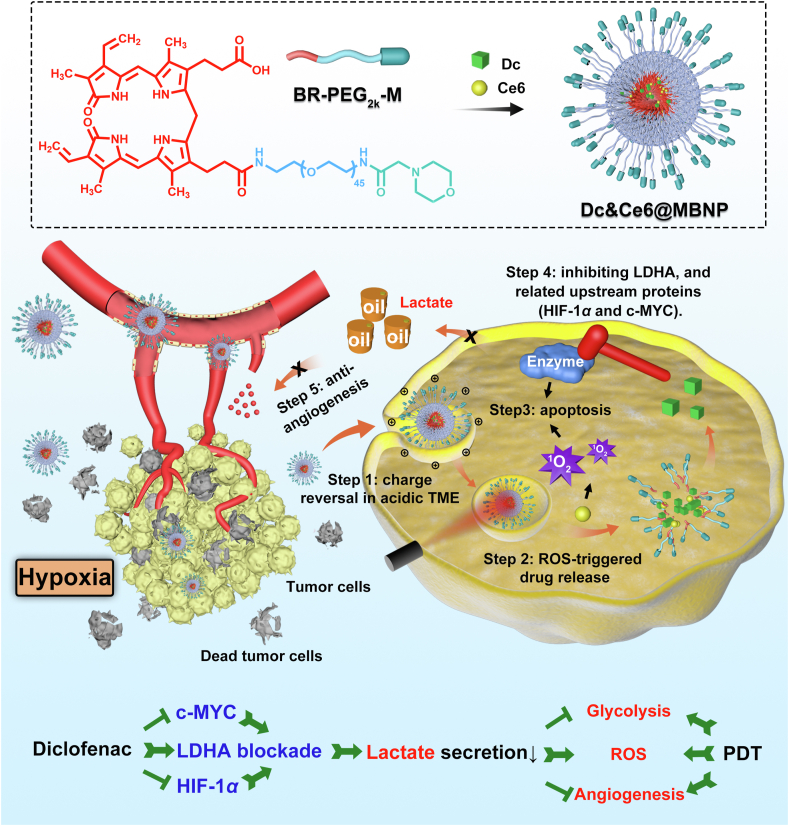
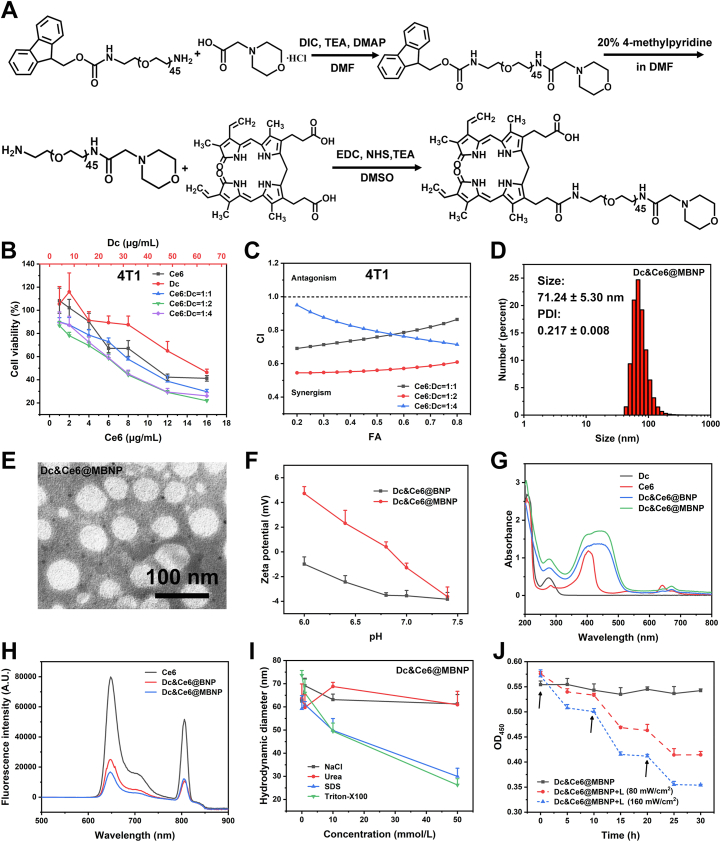
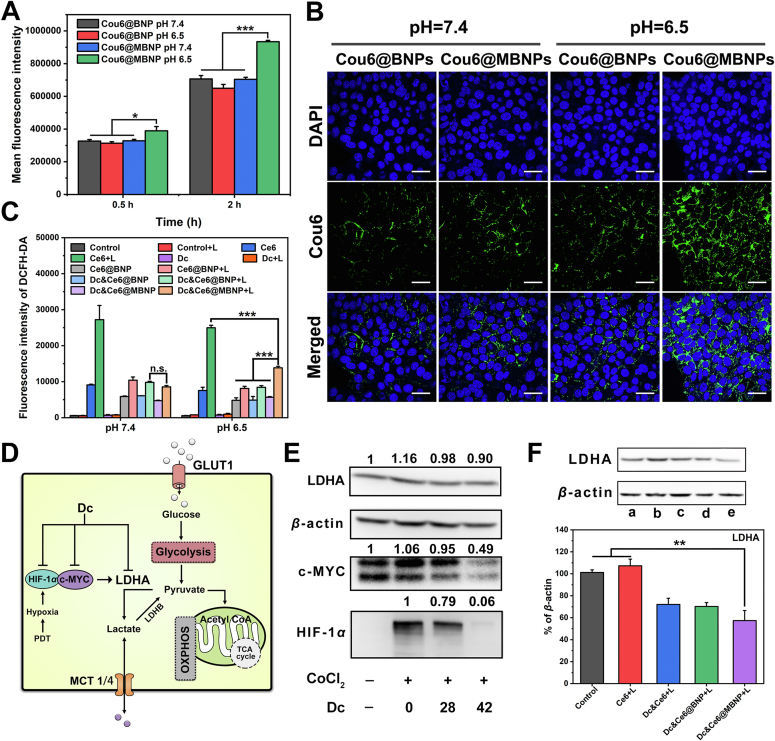
Considering that photodynamic therapy (PDT)-induced oxygen consumption and microvascular damage could exacerbate hypoxia to drive more glycolysis and angiogenesis, a novel approach to potentiate PDT and overcome the resistances of hypoxia is avidly needed. Herein, morpholine-modified PEGylated bilirubin was proposed to co-deliver chlorin e6, a photosensitizer, and diclofenac (Dc). In acidic milieu, the presence of morpholine could enable the nanocarriers to selectively accumulate in tumor cells, while PDT-generated reactive oxidative species (ROS) resulted in the collapse of bilirubin nanoparticles and rapid release of Dc. Combining with Dc showed a higher rate of apoptosis over PDT alone and simultaneously triggered a domino effect, including blocking the activity and expression of lactate dehydrogenase A (LDHA), interfering with lactate secretion, suppressing the activation of various angiogenic factors and thus obviating hypoxia-induced resistance-glycolysis and angiogenesis. In addition, inhibition of hypoxia-inducible factor-1α (HIF-1α) by Dc alleviated hypoxia-induced resistance. This study offered a sequentially responsive platform to achieve sufficient tumor enrichment, on-demand drug release and superior anti-tumor outcomes in vitro and in vivo.

Keywords: Bilirubin nanoparticles; Charge reversal; Diclofenac; HIF-1α inhibition; Hypoxia; LDHA inhibition; Photodynamic therapy; ROS-responsive drug release.


Figures

Image 1
Graphical abstract
Figure 1
Figure 1
Schematic illustration of the composition of Dc&Ce6@MBNP and its synergistic anti-cancer mechanism.
Figure 2
Figure 2
Characterizations of Dc&Ce6@MBNP. (A) Synthesis route of M-PEG2K-BR. (B) In vitro cytotoxicity of free Ce6 and Dc on 4T1 cells. (C) CI value simulated from (B) using CalcuSyn software. (D) Size distribution and (E) typical TEM image of Dc&Ce6@MBNP. (F) Changes of zeta potentials of BNP and MBNP in PBS at different pH values from 6.0 to 7.4 (n = 3, mean ± SD). (G) UV−VIS absorption spectra of free Dc, free Ce6 and NPs in PBS (pH = 7.4). (H) Fluorescence spectra of free Ce6 and NPs in PBS (pH = 7.4). (I) Hydrodynamic diameters of Dc&Ce6@MBNP upon addition of NaCl, urea, SDS and Triton X-100 (n = 3). (J) Changes in OD450 of Dc&Ce6@MBNP following treatments with different circles of laser irradiation (n = 3). Black arrows correspond to 2-min irradiation here.
Figure 3
Figure 3
Cellular uptake, ROS generation and lactate modulation in vitro. (A) Flow cytometry results of endocytosis of Cou6@BNP and Cou6@MBNP at pH 7.4 and 6.5 for 0.5 and 2 h (n = 3, mean ± SD, ∗P < 0.05, ∗∗P < 0.01, ∗∗∗P < 0.001). (B) Confocal images of the cellular uptake of Cou6@BNP and Cou6@MBNP at pH 7.4 and 6.5 for 2 h. Blue indicates the cell nucleus. Green indicates Cou6. Scale bars represent 50 μm. (C) ROS generation in various formulations at cell level measured by flow cytometry. (D) Schematic illustration of mechanism of synergistic hypoxia-targeted photodynamic therapy through regulating LDHA. (E) Western blotting analysis of HIF-1α, c-MYC and LDHA expression treated with CoCl2 and different concentrations of Dc in 4T1 cells at pH 7.4 for 24 h. (F) Western blotting and semi-quantitative analysis of LDHA expression in 4T1 cells treated with different formulations upon irradiation (80 mW/cm2, 1 min) at pH 6.5 for 36 h (n = 3, mean ± SD, ∗P < 0.05, ∗∗P < 0.01, ∗∗∗P < 0.001). The a–e in (F) represent control, Ce6+L, Dc&Ce6+L, Dc&Ce6@BNP + L and Dc&Ce6@MBNP + L.
Figure 4
Figure 4
In vitro cytotoxicity assays. (A) Calcein-AM/PI double staining of cells at pH 6.5 after different treatments. Scale bars represent 100 μm (laser: 650 nm, 80 mW/cm2, 1 min). (B) 4T1 cells viability treated with different formulations at pH 6.5 for 24 h, measured by MTT assay (laser: 650 nm, 80 mW/cm2, 20 s). (C) The IC50 of Dc&Ce6@BNP + L and Dc&Ce6@MBNP + L at pH 7.4 and 6.5 (n = 3, mean ± SD, ∗P < 0.05, ∗∗P < 0.01, ∗∗∗P < 0.001; n.s., not significant). (D) Quantitative comparison and (E) apoptosis analysis of cells at pH 6.5 after different treatments by flow cytometry (laser: 650 nm, 80 mW/cm2, 1 min; n = 3, mean ± SD, ∗P < 0.05, ∗∗P < 0.01, ∗∗∗P < 0.001).
Figure 5
Figure 5
In vivo biodistribution of nanocarriers. (A) In vivo imaging of DiD-loaded formulations in 4T1 tumor-bearing mice at different times post administration. Tumor sites are marked by red circles. (B) Ex vivo imaging of isolated tumors and organs from mice after 24 h. (C) Semi-quantification of fluorescence intensity (n = 3, mean ± SD, ∗P < 0.05, ∗∗P < 0.01, ∗∗∗P < 0.001). (D) Fluorescent distribution of Free DiD, DiD@BNP and DiD@MBNP in the frozen sections of tumors. Blue indicates the cell nucleus. Red indicates DiD. Green indicates CD31. Scale bars are 100 μm.
Figure 6
Figure 6
In vivo anti-tumor performance of different formulations. (A) Body weight and (C) 4T1 tumor growth curves of the mice after different treatment. (B) Photographs and (D) average weights of the isolated tumors on Day 20 (n = 6, mean ± SD, ∗P < 0.05, ∗∗P < 0.01, ∗∗∗P < 0.001). (E) H&E and (F) TUNEL staining of the corresponding tumor sections. Scale bars (H&E) are 20 μm; scale bars (TUNEL) are 100 μm. The a–h in (B), (D), (E) and (F) represent PBS, Ce6+L, Dc, Dc&Ce6+L, Dc&Ce6@BNP, Dc&Ce6@BNP + L, Dc&Ce6@MBNP and Dc&Ce6@MBNP + L. (G) Western blotting analysis of HIF-1α protein expression from tumor tissues obtained after different treatments and the corresponding semi-quantitative results (n = 3, mean ± SD, ∗P < 0.05, ∗∗P < 0.01, ∗∗∗P < 0.001).
Figure 7
Figure 7
Lactate modulation-enabled TME alteration. (A) Western blotting analysis of LDHA and angiogenesis-related protein expression from tumor tissues obtained after different treatments. The a–e in (A) represent PBS, Ce6+L, Dc&Ce6+L, Dc&Ce6@BNP + L and Dc&Ce6@MBNP + L. (B) and (C) Semi-quantitative analysis of the ratio of LDHA and CD31 expressions to β-actin expression using ImageJ (n = 3, mean ± SD, ∗∗P < 0.01, ∗∗∗P < 0.001). (D) IF staining of LDHA and (F) IHC staining of CD31 in tumor sections. Scale bars (LDHA) represent 10 μm; Scale bars (CD31) represent 20 μm. (E) The concentrations of lactate in tumor tissues (n = 3, mean ± SD, ∗∗P < 0.01, ∗∗∗P < 0.001; n.s., not significant). The a–h in (D) and (F) correspond to PBS, Ce6+L, Dc, Dc&Ce6+L, Dc&Ce6@BNP, Dc&Ce6@BNP + L, Dc&Ce6@MBNP and Dc&Ce6@MBNP + L.

Similar articles

Cited by

References

    1. Fan W.P., Huang P., Chen X.Y. Overcoming the Achilles' heel of photodynamic therapy. Chem Soc Rev. 2016;45:6488–6519. - PubMed
    1. Xie J.L., Wang Y.W., Choi W.S., Jangili P., Ge Y.Q., Xu Y.J., et al. Overcoming barriers in photodynamic therapy harnessing nano-formulation strategies. Chem Soc Rev. 2021;50:9152–9201. - PubMed
    1. Schito L., Semenza G.L. Hypoxia-inducible factors: master regulators of cancer progression. Trends Cancer. 2016;2:758–770. - PubMed
    1. Denko N.C. Hypoxia, HIF1 and glucose metabolism in the solid tumour. Nat Rev Cancer. 2008;8:705–713. - PubMed
    1. Nakazawa M.S., Keith B., Simon M.C. Oxygen availability and metabolic adaptations. Nat Rev Cancer. 2016;16:663–673. - PMC - PubMed

LinkOut - more resources