. 2022 Mar;12(3):1225-1239.
doi: 10.1016/j.apsb.2021.10.021. Epub 2021 Oct 26.

WSB1 regulates c-Myc expression through β-catenin signaling and forms a feedforward circuit

Affiliations

WSB1 regulates c-Myc expression through β-catenin signaling and forms a feedforward circuit

Xiaomeng Gao et al. Acta Pharm Sin B. 2022 Mar.

Abstract

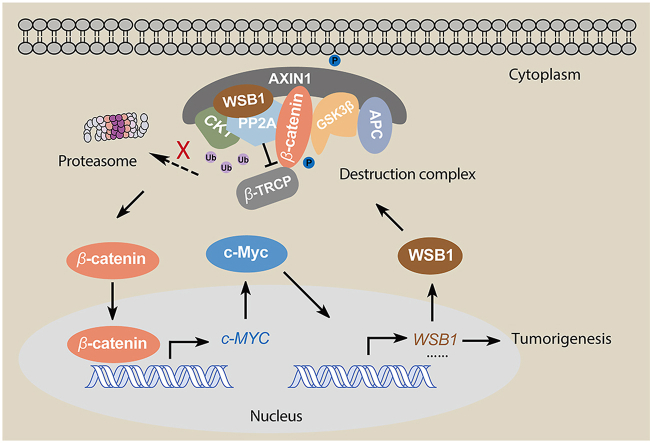
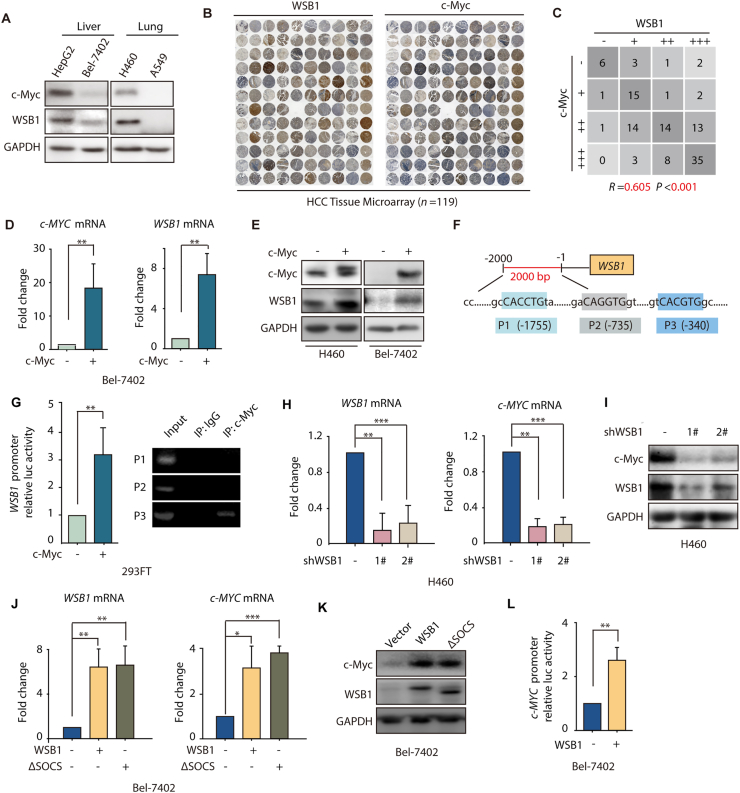
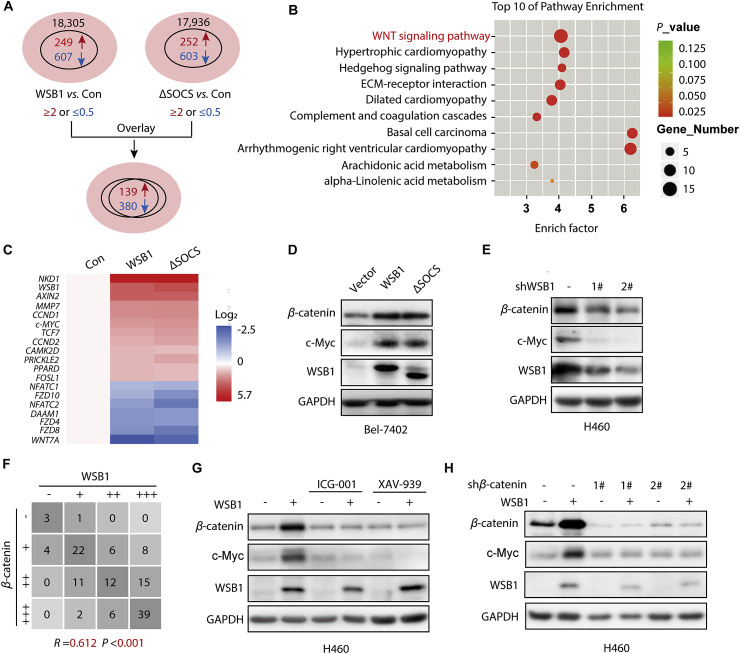
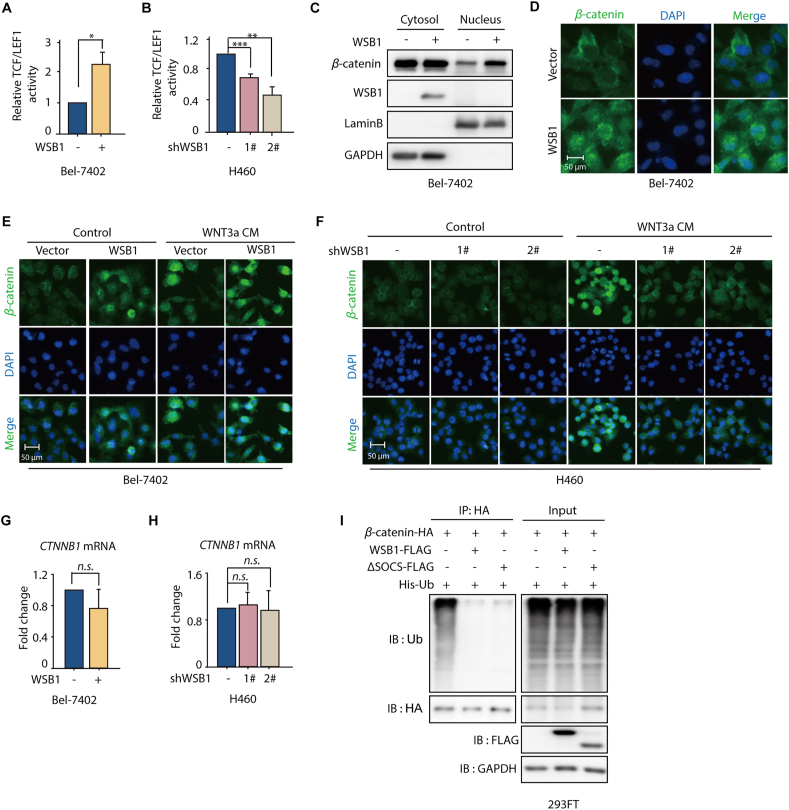
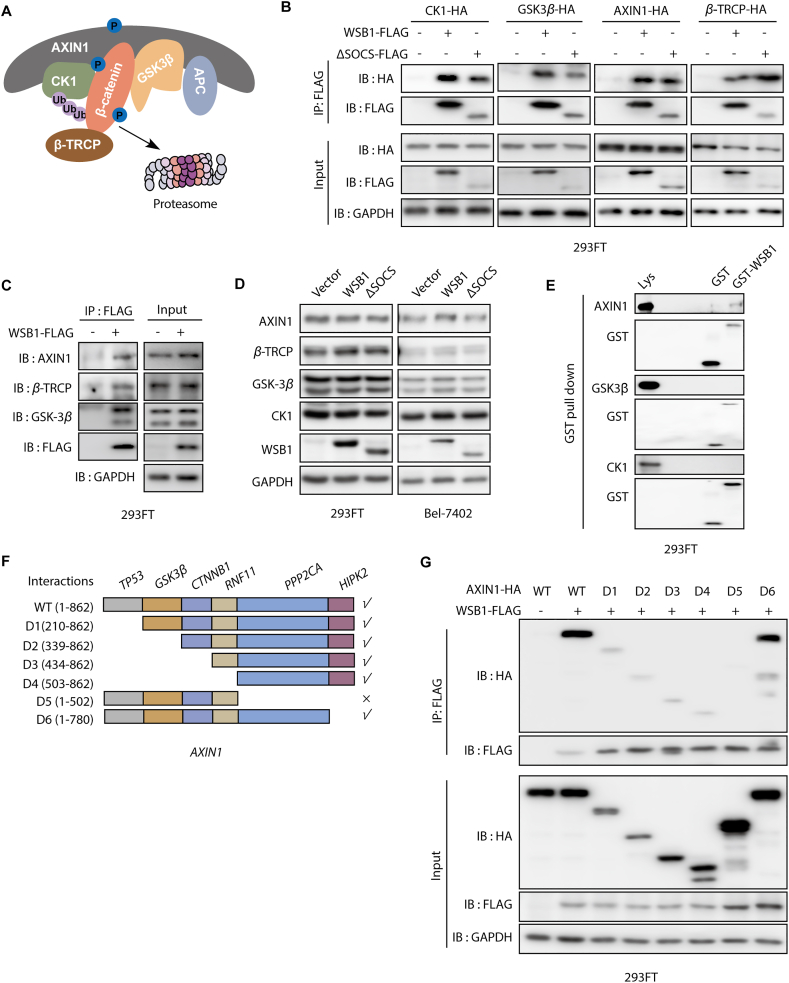
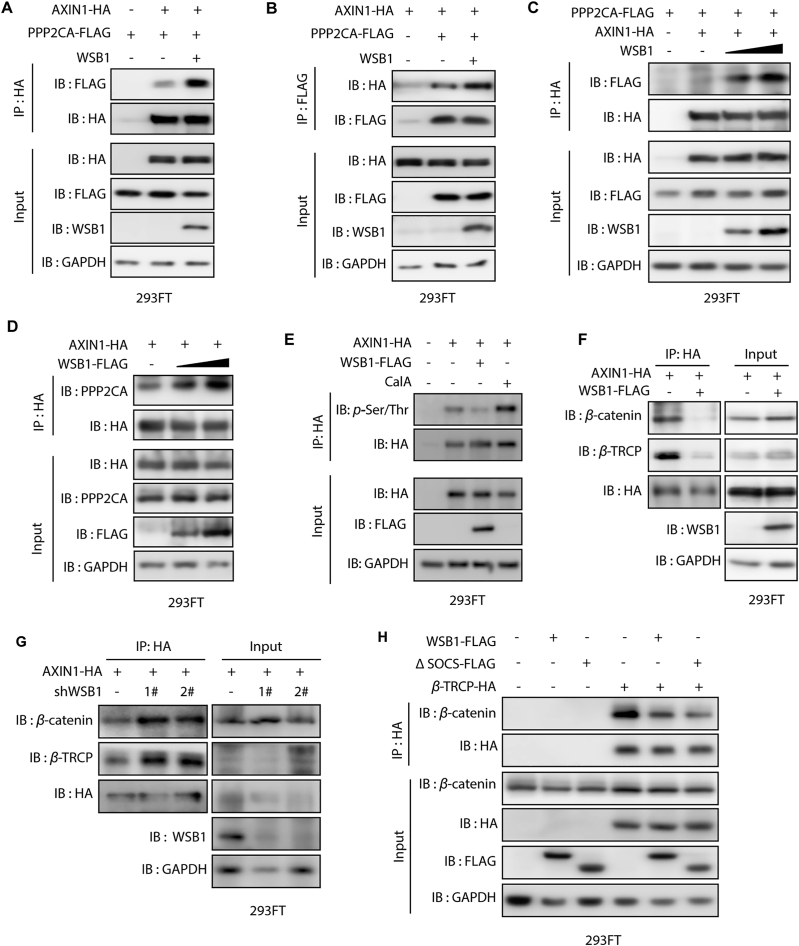
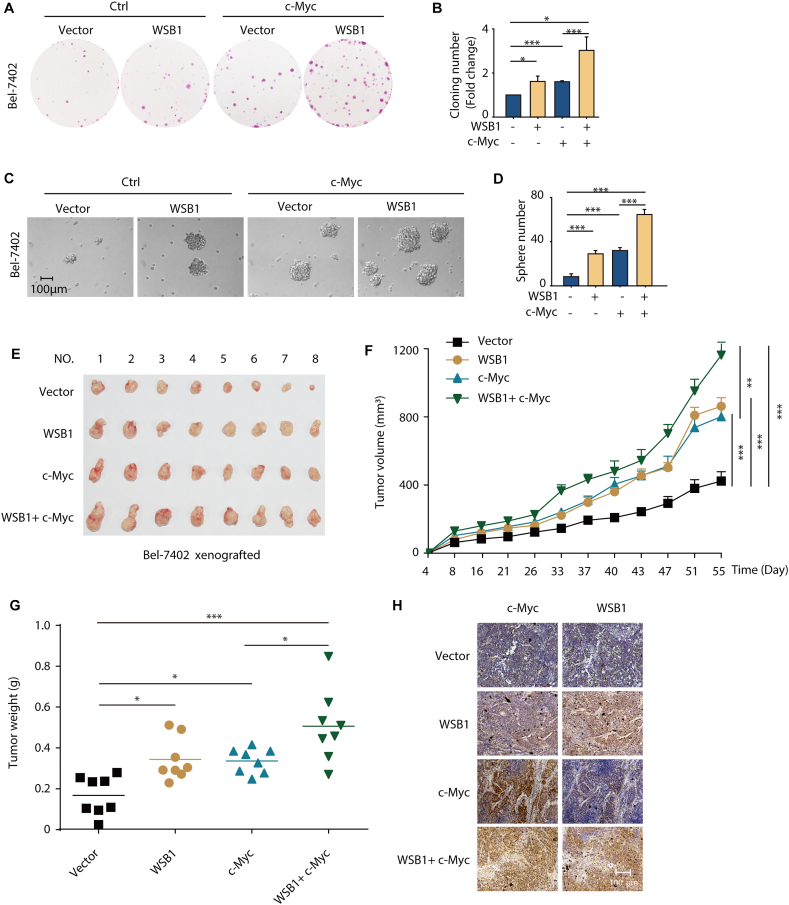
The dysregulation of transcription factors is widely associated with tumorigenesis. As the most well-defined transcription factor in multiple types of cancer, c-Myc can transform cells by transactivating various downstream genes. Given that there is no effective way to directly inhibit c-Myc, c-Myc targeting strategies hold great potential for cancer therapy. In this study, we found that WSB1, which has a highly positive correlation with c-Myc in 10 cancer cell lines and clinical samples, is a direct target gene of c-Myc, and can positively regulate c-Myc expression, which forms a feedforward circuit promoting cancer development. RNA sequencing results from Bel-7402 cells confirmed that WSB1 promoted c-Myc expression through the β-catenin pathway. Mechanistically, WSB1 affected β-catenin destruction complex-PPP2CA assembly and E3 ubiquitin ligase adaptor β-TRCP recruitment, which inhibited the ubiquitination of β-catenin and transactivated c-Myc. Of interest, the effect of WSB1 on c-Myc was independent of its E3 ligase activity. Moreover, overexpressing WSB1 in the Bel-7402 xenograft model could further strengthen the tumor-driven effect of c-Myc overexpression. Thus, our findings revealed a novel mechanism involved in tumorigenesis in which the WSB1/c-Myc feedforward circuit played an essential role, highlighting a potential c-Myc intervention strategy in cancer treatment.

Keywords: ATM, serine-protein kinase ATM; CHIP, chromatin immunoprecipitation; CK1, casein kinase 1; Cancer treatment; EBP2, probable rRNA-processing protein EBP2; ESC complex, elongin B/C-cullin 2/5-SOCS box containing ubiquitin ligase protein complex; Feedback loop; GSK3β, glycogen synthase kinase 3β; HCC, hepatocellular carcinoma; HIF1-α, hypoxia induced factor 1-alpha; IHC, immunohistochemistry; PLK1, serine/threonine-protein kinase PLK1; PP2A, serine/threonine protein phosphatase 2A; PROTAC, proteolysis targeting chimaera; RhoGDI2, Rho GDP dissociation inhibitor 2; TFs, transcription factors; Transcription factors; Tumorigenesis; Ubiquitination-proteasome pathway; WSB1; WSB1, WD repeat and SOCS box containing 1; c-Myc; c-Myc, proto-oncogene c-Myc; eIF4F, eukaryotic translation initiation factor 4F; β-Catenin destruction complex.


Conflict of interest statement

The authors declare no competing financial interest.

Figures

Image 1
Graphical abstract
Figure 1
Figure 1
WSB1 is a target gene of c-Myc and could in turn regulate c-Myc expression. (A) Western blotting of WSB1 and c-Myc expression in different tumor cell lines. (B) IHC staining of WSB1 and c-Myc in hepatocellular carcinoma tissues. (C) Statistical analysis of IHC results of WSB1 and c-Myc in hepatocellular carcinoma tissues (n = 119). (D) Relative mRNA levels of c-MYC and WSB1 in Bel-7402 cells transfected with pCDH-c-Myc plasmid for 48 h. (E) Western blotting of WSB1 and c-Myc in H460 and Bel-7402 cells transfected with pCDH-c-Myc plasmid for 48 h. (F) Schematic representation of the human WSB1 promoter sequence spanning 2.0 kb upstream of the transcriptional start site. P1 (−1755), P2 (–735) and P3 (–340) are predicted potential c-Myc binding sites. (G) 293FT cells were co-transfected with vector or pCDH-c-Myc and pGL4.14-WSB1 promotor for 48 h. Luciferase activity was detected by M5 and normalized by Renilla activity. 293FT cells were transfected with pCDH-c-Myc plasmid for 48 h, anti-IgG and anti-c-Myc antibodies were used in the chromatin ChIP assay. (H) Relative mRNA levels of c-MYC and WSB1 in H460 cells infected with 2 specific lentivirus WSB1 shRNAs for 72 h. (I) Western blotting of WSB1 and c-Myc in H460 cells infected with lentivirus WSB1 shRNA for 72 h. (J) Relative mRNA level of WSB1 and c-MYC in Bel-7402 cells infected with lentivirus pCDH or pCDH-WSB1 or pCDH-ΔSOCS for 72 h. (K) Western blotting of WSB1 and c-Myc in Bel-7402 cells infected with pCDH or pCDH-WSB1 or pCDH-ΔSOCS lentivirus for 72 h. (L) Bel-7402 cells were co-transfected with vector or pCDH-WSB1 and pGL4.14-c-Myc promotor luciferase for 48 h. Luciferase activity was normalized by cell numbers and shown as fold change. Data are represented as mean ± SD, n = 3; statistical significance was determined by Student's t-test. ∗P < 0.05, ∗∗P < 0.01, ∗∗∗P < 0.001 (versus vector group).
Figure 2
Figure 2
WSB1 enhances c-Myc expression through WNT/β-catenin pathway. (A) Bel-7402 cells were transduced with pCDH vector or pCDH-WSB1 or pCDH-ΔSOCS for 72 h. The total RNA was isolated and subsequently performed the RNA-seq. Differential genes (with at least 2-fold change) of WSB1 vs. Control and ΔSOCS vs. Control were overlaid. (B) Differential genes of WSB1 vs. Control and ΔSOCS vs. Control were analyzed by KEGG pathway enrichment analysis and the top 10 pathways were displayed as scatter diagram. (C) Differential genes in WNT/β-catenin signaling pathway are shown as heatmap. (D) Western blotting of β-catenin, WSB1 and c-Myc in Bel-7402 cells infected with lentivirus pCDH-WSB1 for 72 h. (E) Western blotting of β-catenin, WSB1 and c-Myc in H460 cells infected with lentivirus WSB1 shRNAs for 72 h. (F) Statistical analysis of IHC results of WSB1 and β-catenin in hepatocellular carcinoma tissue (n = 119). (G) H460 cells infected with lentivirus vector or lentivirus pCDH WSB1 were treated with β-catenin inhibitors ICG-001 (10 μmol/L) and XAV-939 (10 μmol/L) for 24 h. The protein expression of β-catenin, WSB1 and c-Myc were evaluated by Western blotting. (H) H460 cells overexpressing WSB1 or control cells were infected with lentivirus vector or lentivirus β-catenin shRNA for 72 h. The protein expression of β-catenin, WSB1 and c-Myc were evaluated by Western blotting.
Figure 3
Figure 3
WSB1 promotes β-catenin nucleus translocation and inhibits its ubiquitination. (A) Bel-7402 cells were co-transfected with vector or pCDH-WSB1 and pGL4.14-TCF/LEF1-luciferase for 48 h. Luciferase activity was normalized by cell numbers and shown as fold change. ∗P < 0.05 (versus vector group). (B) H460 cells were transduced with lentivirus WSB1 shRNA followed by transfection with TCF/LEF1-luciferase for 48 h. Luciferase activity was normalized by cell numbers and shown as fold change. ∗∗P < 0.01, ∗∗∗P < 0.001 (versus control group). (C) Bel-7402 cells were infected with lentivirus pCDH Vector or lentivirus pCDH-WSB1 for 72 h and collected for cell fraction (nuclei and cytoplasm) separation. Cellular localization of β-catenin was detected by Western blotting in cell fraction. GAPDH was used as loading control for cytoplasm fraction and lamin B was for nucleus fraction. (D) Immunofluorescence staining of β-catenin in Bel-7402 cells infected with lentivirus pCDH vector or lentivirus pCDH-WSB1. (E) Bel-7402 cells infected with lentivirus pCDH vector or lentivirus pCDH-WSB1 were treated with WNT3a condition medium (WNT3a CM) for 16 h, and stained with β-catenin antibody by immunofluorescence. (F) H460 cells infected with lentivirus vector or lentivirus WSB1 shRNAs were treated with WNT3a condition medium (WNT3a CM) for 16 h, and stained with β-catenin antibody by immunofluorescence. (G) Relative mRNA level of WSB1 and CTNNB1 in Bel-7402 cells infected with lentivirus pCDH-WSB1 or 72 h. (H) Relative mRNA level of WSB1 and CTNNB1 in H460 cells infected with lentivirus WSB1 shRNA for 72 h. (I) 293FT cells were infected with lentivirus pCDH vector or lentivirus pCDH-WSB1 or lentivirus pCDH-ΔSOCS for 72 h. Then the cells were plated and transfected with pCDNA-3.0-β-catenin-HA and His-Ub for 48 h and treated with MG132 (10 μmol/L) for 8 h before collecting cells. Then the cells were lysed and for immunoprecipitated with anti-HA antibody followed by immunoblotting with anti-ubiquitination and anti-HA antibody. Data are represented as mean ± SD, n = 3; statistical significance was determined by Student's t-test. n.s., no significant difference (P > 0.05).
Figure 4
Figure 4
WSB1 interacts with the destruction complex through the scaffold protein AXIN1. (A) Schematic representation of the β-catenin destruction complex. (B) 293FT cells were transfected with β-catenin destruction complex component plasmids (pCDNA-3.0-CK1-HA or pCDNA-3.0-GSK3β-HA or pCDNA-3.0-AXIN1-HA or pCDNA-3.0-β-TRCP-HA) or co-transfected with pCDH-WSB1-FLAG or pCDH-ΔSOCS-FLAG for 48 h. Then the cells were lysed and for immunoprecipitated with anti-FLAG antibody followed by immunoblotting with anti-HA antibody. (C) 293FT cells were transfected with pCDH vector or pCDH-WSB1-FLAG for 48 h. Then the cells were lysed and for immunoprecipitated with anti-FLAG antibody followed by immunoblotting with anti-AXIN1 or anti-β-TRCP or anti-GSK3β or anti-FLAG antibody. (D) Western blotting of AXIN1, β-TRCP, GSK3β and CK1 in 293FT cells and Bel-7402 cells infected with lentivirus pCDH vector or lentivirus pCDH-WSB1 or lentivirus pCDH-ΔSOCS for 72 h. (E) 293FT cells were transfected with pCDNA-3.0-AXIN1-HA or pCDNA-3.0-CK1-HA or pCDNA-3.0-GSK3β-HA for 48 h. The cells were lysed by 4% SDS lysis buffer and then diluted in PBS buffer to make the SDS concentration was 0.1%. GST protein or WSB1-GST fusion protein (5 μg) were incubated with 10 μL GST-seflinose™ resin for 2 h at 4 °C followed by incubating with the lysates overnight at 4 °C and immunoblotting with anti-HA antibody and anti-GST antibody. (F) Schematic representation of AXIN1 domains and a series of AXIN1-HA deletion mutations. (G) 293FT cells were transfected with pCDH-WSB1-FLAG and a series of AXIN1-HA deletion mutations for 48 h. Then the cells were lysed and for immunoprecipitated with anti-FLAG antibody followed by immunoblotting with anti-HA antibody.
Figure 5
Figure 5
WSB1 affects the destruction complex-PPP2CA assembly and the E3 ubiquitin ligase adaptor β-TRCP recruitment. (A) 293FT cells were transfected with pCDNA3.0-PPP2CA-FLAG, or co-transfected with pCDNA3.0-PPP2CA-FLAG and pCDNA3.0-AXIN1-HA or co-transfected with pCDNA3.0-PPP2CA-FLAG, pCDNA3.0-AXIN1-HA and pCDH-WSB1-FLAG for 48 h. Then the cells were lysed and for immunoprecipitated with anti-HA antibody followed by immunoblotting with anti-FLAG antibody. (B) 293FT cells were transfected with pCDNA3.0-AXIN1-HA, or co-transfected with pCDNA3.0-AXIN1-HA and pCDNA3.0-PPP2CA-FLAG or co-transfected with pCDNA3.0-PPP2CA-FLAG, pCDNA3.0-AXIN1-HA and pCDH-WSB1 for 48 h. Then the cells were lysed and for immunoprecipitated with anti-FLAG antibody followed by immunoblotting with anti-HA antibody. (C) 293FT cells were transfected with pCDNA3.0-PPP2CA-FLAG, or co-transfected with pCDNA3.0-PPP2CA-FLAG and pCDNA3.0-AXIN1-HA, or co-transfected with pCDNA3.0-PPP2CA-FLAG, pCDNA3.0-AXIN1-HA and different doses of pCDH-WSB1 (1 or 2 μg) for 48 h. Then the cells were lysed and for immunoprecipitated with anti-HA antibody followed by immunoblotting with anti-FLAG antibody. (D) 293FT cells were transfected with pCDNA3.0-AXIN1-HA, or co-transfected with pCDNA3.0-AXIN1-HA and different doses of pCDH-WSB1-FLAG (1 or 2 μg) for 48 h. Then the cells were lysed and for immunoprecipitated with anti-HA antibody followed by immunoblotting with anti-PPP2CA antibody. (E) 293FT cells were transfected with pCDNA3.0-AXIN1-HA, or co-transfected with pCDNA3.0-AXIN1-HA and pCDH-WSB1-FLAG for 48 h and treated with phosphatase PP1/PP2A inhibitor calyculin A (2 μmol/L) for 1 h before collecting cells. Then the cells were lysed and for immunoprecipitated with anti-HA antibody followed by immunoblotting with anti-p-Ser/Thr antibody. (F) 293FT cells were transfected with pCDNA3.0-AXIN1-HA, or co-transfected with pCDNA3.0-AXIN1-HA and pCDH-WSB1-FLAG for 48 h. Then the cells were lysed and for immunoprecipitated with anti-HA antibody followed by immunoblotting with anti-β-catenin, anti-β-TRCP, anti-WSB1 and anti HA antibody. (G) 293FT cells were infected with lentivirus shRNA vector or lentivirus WSB1 shRNA for 72 h. Then the cells were plated and transfected with pCDNA-3.0-AXIN1-HA for 48 h. Finally, the cells were lysed and for immunoprecipitated with anti-HA antibody followed by immunoblotting with anti-β-catenin, anti-β-TRCP, anti-WSB1 and anti HA antibody. (H) 293FT cells were infected with lentivirus pCDH vector or lentivirus pCDH-WSB1 or lentivirus pCDH-ΔSOCS for 72 h. Then the cells were plated and transfected with pCDHA3.0 vector or pCDNA-3.0-β-TRCP-HA for 48 h. Then the cells were lysed and for immunoprecipitated with anti-HA antibody followed by immunoblotting with anti-β-catenin and anti-HA antibody.
Figure 6
Figure 6
WSB1/c-Myc feedforward circuit participated in the development of cancer. (A) Cloning formation assay was performed in Bel-7402 cells transduced with lentivirus pCDH or pCDH-WSB1 or pCDH-c-Myc or both. Cells were stained with the sulforhodamine B and photographed by E-Gel Imager. (B) Cloning numbers were counted and shown as fold change. ∗P < 0.05, ∗∗∗P < 0.001 (versus vector group). (C) Sphere formation assay was performed in Bel-7402 cells transduced with lentivirus pCDH or pCDH-WSB1 or pCDH-c-Myc or both. Representative photographs were taken by microscope. (D) Statistical analysis of cell colonies. ∗∗∗P < 0.001 (versus vector group). (E) Photographs of tumors from different groups. In the end of the experiment, the M-NSG mice were sacrificed and tumors were dissected, and the tumor formation rate was 8/8 in each group. (F) Analysis of tumor volumes in different groups. ∗∗P < 0.01, ∗∗∗P < 0.001 (versus vector group or c-Myc singly overexpressed group). (G) Analysis of tumor weight in different groups. ∗P < 0.05; ∗∗∗P < 0.001 (versus vector group or c-Myc singly overexpressed group). (H) IHC staining of WSB1 and c-Myc in the tumor tissue. Data are represented as mean ± SD, n = 3 (B, D) or means ± SEM, n = 8 (F, G); statistical significance was determined by Student's t-test.

Similar articles

Cited by

References

    1. Maston G.A., Evans S.K., Green M.R. Transcriptional regulatory elements in the human genome. Annu Rev Genom Hum Genet. 2006;7:29–59. - PubMed
    1. Gonzalez-Nunez V., Rodríguez R.E. In: The neuroscience of cocaine. Preedy V.R., editor. Academic Press; San Diego: 2017. Chapter 12-cocaine and transcription factors; pp. 107–124.
    1. Darnell J.E. Jr. Transcription factors as targets for cancer therapy. Nat Rev Cancer. 2002;2:740–749. - PubMed
    1. Bradner J.E., Hnisz D., Young R.A. Transcriptional addiction in cancer. Cell. 2017;168:629–643. - PMC - PubMed
    1. Dang C.V. c-Myc target genes involved in cell growth, apoptosis, and metabolism. Mol Cell Biol. 1999;19:1–11. - PMC - PubMed