Review
. 2019 Sep 23;9(52):30112-30124.
doi: 10.1039/c9ra05341g.

A methodological review on material growth and synthesis of solar-driven water splitting photoelectrochemical cells

Affiliations
Review

A methodological review on material growth and synthesis of solar-driven water splitting photoelectrochemical cells

Kwangwook Park et al. RSC Adv. .

Abstract

As a renewable and sustainable energy source and an alternative to fossil fuels, solar-driven water splitting with photoelectrochemical (PEC) cell is a promising approach to obtain hydrogen fuel with its near-zero carbon emission pathway by transforming incident sunlight, the most abundant energy source. Because of its importance and future prospects, a number of architectures with their own features have been formed by various synthesis and growth methods. Because the materials themselves are one of the most dominant components, they determine the solar-to-hydrogen efficiency of the PEC cells. Thus, several representative PEC cells were reviewed by categorizing them as per synthesis and/or growth methods such as physical vapor deposition, chemical vapor deposition, electrochemical deposition, etc. This review provides researchers with an overview and acts as a guide for research on solar-driven water splitting PEC cells.


Conflict of interest statement

There are no conflicts to declare.

Figures
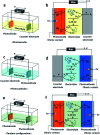
Fig. 1
Fig. 1. Schematics and energy diagram of PEC water splitting cells. (a), (c), and (e) shows schematic of schematics of PEC cell configurations of photoanode, photocathode, and tandem configuration (Z-scheme) PEC cells. (b), (d), and (f) displays their detailed mechanisms in energy band.
Fig. 2
Fig. 2. Reconstructed image from ref. 30. (a) A 45° tilted SEM image of InGaN nanosheets vertically aligned on a Si substrate. Scale bar, 1 μm. (b) Schematic illustration of probing the nanosheets with an arbitrary thickness d. (c) Depiction of the dynamic behaviors of the charge carriers in a single-photon InGaN nanosheet upon photoexcitation. The electron enriched surface (cathode) of the nanosheet is largely decorated with a photo-deposited hydrogen evolution reaction (HER) co-catalyst. (d) Neutral pH overall water splitting on the surfaces of InGaN nanosheets, presented schematically as a top view at the plane (XX′) of the cross-section in (b). ηa and ηc represent the anodic and cathodic over-potentials for the water oxidation and proton reduction reaction, respectively. With the directional (opposite) migration of electrons and holes, redox reactions can be coupled between parallel (cathode and anode) surfaces of vertically aligned adjacent nanosheets. Reprinted with permission from ref. 30. Copyright 2018 Springer Nature.
Fig. 3
Fig. 3. Reconstructed image from ref. 35. (a–e) Cross-sectional electron dispersive spectroscopy (EDS) mapping images of a GaN/Ta3N5 scanning transmission electron microscopy (STEM) image. The scale bar is 100 nm. (f) Cross-sectional STEM image of GaN/Ta3N5. The scale bar is 100 nm. Insets (1) and (2) are selected area diffraction (SAED) patterns acquired from the GaN region and Ta3N5, respectively. Inset (3) is a high-resolution transmission electron microscopy (HRTEM) image with the corresponding fast Fourier transform (FFT) patterns acquired at region A of the GaN/Ta3N5 interface and region B of the Ta3N5. The scale bar is 10 nm. (g) Time-course photocurrent density curves for the CoPi/GaN/Ta3N5 (black) and CoPi/Ta3N5 (pink) photoanodes. Reprinted with permission from ref. 35. Copyright 2017 John Wiley & Sons.
Fig. 4
Fig. 4. Reconstructed image from ref. 38. (a–c) Cross-sectional SEM images of the CdS/CIGS samples with a Ga/(Ga + In) ratio of 0.3, 0.5, and 0.7. Calculated band diagrams for the solid–liquid interfaces of the samples with a Ga/(Ga + In) ratio of 0.3 and 0.5 at an applied potential of VRHE = 0 (d and e) and VRHE = 0.6 (f and g) where RHE represents the reversible hydrogen electrode. Reprinted with permission from ref. 38. Copyright 2018 the Royal Society of Chemistry.
Fig. 5
Fig. 5. Reconstructed image from ref. 41. (a) Theoretically attainable efficiencies are plotted for the ranges of the top and bottom junction band gap energies. The values on the contour lines represent the STH efficiency attainable using the given top and bottom junction band gap energies. The 1.8/1.4 eV bandgap combination of the classical, lattice-matched GaInP/GaAs tandem could achieve a STH efficiency of 15% (black dot); 1.8/1.2 eV could achieve a STH efficiency of 24% (orange dot). (b) 1.8 eV GaInP and 1.2 eV GaInAs have a lattice mismatch around 0.8%. (c) and (d) represents schematics of the PEC cell and TEM image of CGB layer, respectively. Reprinted with permission from ref. 41. Copyright 2018 Springer Nature.
Fig. 6
Fig. 6. Reconstructed image from ref. 42. (a) A schematic diagram of the photoelectrochemical cell. (b) A Photograph and SEM image (inset) of GaN truncated nanocones on a 2-inch sapphire substrate fabricated by a 15 min. Etched SiO2 mask. (c) Three dimensional finite-difference time-domain simulations for the electric field distribution of the planar, cylindrical, truncated cone, and cone. (d) Simulation results of the absorptance/reflectance spectra of planar and truncated cone. (e) Photoelectrochemical measurements of the planar and truncated nanocones. Reprinted with permission from ref. 42. Copyright 2018, American Chemical Society.
Fig. 7
Fig. 7. Reconstructed image from ref. 49. (a) Schematic of the GaInP/GaInAs tandem photoelectrode after functionalization with an interfacial TiO2 thin-film and Rh electrocatalysts. (b) Topography of the Rh-particle-coated crystalline anatase TiO2 layer by SEM and AFM. (c) Reflectivity of the GaInP/GaInAs tandem photoelectrode without ARC (black curve); second reflectivity obtained after anatase TiO2 thin-film deposition (blue) and after photoelectrochemically deposited Rh nanoparticles (yellow). All reflectivity obtained in the air. (d) Output characteristics of the PEC cells displaying effect of anatase-phase TiO2. Reprinted with permission from ref. 49. Copyright 2018, American Chemical Society.
Fig. 8
Fig. 8. Reconstructed image from ref. 58. (a) Scheme of a tandem cell with a hetero-type dual photoelectrode (BiVO4/Fe2O3) and parallel-connected Si solar cells (crystalline Si in parallel connection), (b) artificial leaf (monolithic tandem cell) in action under illumination with real sunlight. Reprinted with permission from ref. 58. Copyright 2016 Springer Nature.
None
Kwangwook Park
None
Yeong Jae Kim
None
Taeho Yoon
None
Young Min Song

Similar articles

Cited by

References

    1. Miller E. L. Energy Environ. Sci. 2015;8:2809. doi: 10.1039/C5EE90047F. - DOI
    1. Service R. F. Science. 2007;315:789. doi: 10.1126/science.315.5813.789. - DOI - PubMed
    1. Thomas H., Armstrong F., Brandon N., David B., Barron A., Durrant J., Guwy A., Kucernak A., Lewis M., Maddy J., Metcalfe I., Porch A., Abbott J., Adderly B., Banares R., Beckmann M., Bowen P., Cowan A., Anadon L. D., Dickens N., Dinsdale R., Dodds P., Hawksworth S., Heckenast Z., Holmes N., Howes J., Hutchings G., Irvine J., Loughhead J., Madden B., Newborough M., Oxburgh R., Philibert C., Salisbury A., Saltmarsh J., Selby M., Taylor C., Trezona R., Wilkinson I., Williams C., Surkovic E., Davies P., Clarke A. and Koppelman B., Options for producing low-carbon hydrogen at scale, Royal Society, 2018
    1. Milne T. A., Elam C. C. and Evans R. J., Hydrogen from Biomass State of the Art and Research Challenges, National Renewable Energy Laboratory, 2002, IEA/H2/TR-02/001
    1. Pagliaro M. Konstandopoulos A. G. Ciriminna R. Palmisano G. Energy Environ. Sci. 2010;3:279. doi: 10.1039/B923793N. - DOI