. 2022 Apr 15;12(4):1511-1534.
eCollection 2022.

Pyroptosis impacts the prognosis and treatment response in gastric cancer via immune system modulation

Affiliations

Pyroptosis impacts the prognosis and treatment response in gastric cancer via immune system modulation

Wanli Yang et al. Am J Cancer Res. .

Abstract

Pyroptosis plays a vital role in the development of cancers; however, its role in regulating immune cell infiltration in tumor microenvironment (TME) and pyroptosis-related molecular subtypes remain unclear. Herein, we comprehensively analyzed the molecular subtypes mediated by the pyroptosis-related genes (PRGs) in gastric cancer (GC). Three pyroptosis patterns were determined with distinct TME cell-infiltrating characteristics and prognosis. Principal component analysis was performed to establish the pyroptosis score. The high pyroptosis score group was featured by increased activated CD4+ T cell infiltration, better prognosis, elevated tumor mutation burden, higher immune and stromal scores, and enhanced response to immunotherapy. However, the low pyroptosis score group was characterized by poorer survival, decreased immune infiltration, and glycerolipid and histidine metabolism pathways. Additionally, high pyroptosis score was confirmed as an independent favorable prognostic factor for overall survival. Three cohorts designed to analyze the response to immunotherapy verified that patients with higher pyroptosis score showed treatment benefit. In summary, our study demonstrated that pyroptosis regulates the complex TME. Assessing the pyroptosis patterns will advance our understanding on TME features and tumor immunology and provide the rationale for designing personalized immunotherapy strategies.

Keywords: Pyroptosis; gastric cancer; immunotherapy; prognosis; tumor microenvironment.


Conflict of interest statement

None.

Figures
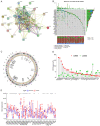
Figure 1
Figure 1
The landscape of genetic and expression variation of PRGs in GC. A. PPI network of 33 PRGs. B. Genetic alterations of 33 PRGs with a frequency of 27.02% in 117 of 433 GC patients from TCGA-STAD cohort. Each column represents an individual patient. C. The location of CNV alteration of 33 PRGs on chromosomes using the data from TCGA-STAD cohort. D. The CNV mutation frequency of 33 PRGs in TCGA-STAD cohort. The column height represents the alteration frequency. The deletion frequency, green dot; The amplification frequency, red dot. E. The expression levels of 33 PRGs between the normal tissues and GC tissues. Normal tissues, blue; Tumor tissues, red. The asterisks represent the statistical p-value (*P<0.05; **P<0.01; ***P<0.001).
Figure 2
Figure 2
Characteristics of pyroptosis-related molecular patterns. A. The interaction network of PRGs in GC. The size of circle represents the effects of PRGs on the clinical outcome of GC patients (P<0.0001, P<0.001, P<0.01, P<0.05 and P<1, Cox test). Green dots in the circle, favorable factors of prognosis. Purple dots in the circle, unfavorable factors of prognosis; B. PCA of the mRNA expression profiles of PRGs confirms the three pyroptosis clusters (blue, pyroptosis Cluster A; yellow, pyroptosis Cluster B; red, pyroptosis Cluster C). C. Survival analyses for the three pyroptosis-related molecular patterns based on 989 GC patients from five cohorts (GSE15459, GSE34942, GSE57303, GSE62254, and TCGA-STAD) including 249 patients in pyroptosis Cluster A, 330 patients in pyroptosis Cluster B, and 410 patients in pyroptosis Cluster C (Log-rank test, P=0.031). D. Heatmap presents the correlation between the three pyroptosis clusters and clinicopathological characteristics of GC patients.
Figure 3
Figure 3
Characteristics of pyroptosis gene clusters. A. Venn diagram presents 346 DEGs among the three pyroptosis clusters. B. The expression levels of PRGs among the three pyroptosis gene clusters. *P<0.05; **P<0.01; ***P<0.001. C. Survival analyses for the pyroptosis gene clusters based on 989 GC patients including 570 patients in pyroptosis gene Cluster A, 270 patients in pyroptosis gene Cluster B, and 149 patients in pyroptosis gene Cluster C (Log-rank test, P<0.01). D. PCA of the mRNA expression profiles of PRGs confirms the pyroptosis gene clusters (blue, gene Cluster A; yellow, gene Cluster B; red, gene Cluster C).
Figure 4
Figure 4
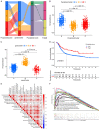
Construction of pyroptosis score system. A. Alluvial diagram shows the distribution of GC patients with different pyroptosis clusters, pyroptosis gene clusters, pyroptosis scores, and survival state. B. Differences in pyroptosis score among three pyroptosis clusters (P<0.001, Kruskal-Wallis test). C. Differences in pyroptosis score among three pyroptosis gene clusters (P<0.001, Kruskal-Wallis test). D. Kaplan-Meier curves for GC patient with high and low pyroptosis score. Log-rank test, P=0.001. E. Correlations between pyroptosis score and different types of immune cells using Spearman analysis. F. GSEA identified several immune-related pathways enriched in the high pyroptosis score group.
Figure 5
Figure 5
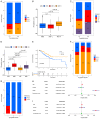
Characteristics of pyroptosis in TCGA molecular subtypes and identification of independent prognostic factors. A, B. Differences in pyroptosis score among different microsatellite subtypes. The Kruskal-Wallis test was used to compare the statistical difference between the three microsatellite subtypes. C, D. Differences in pyroptosis score among different TCGA-STAD molecular subtypes. The Kruskal-Wallis test was conducted to compare the statistical difference between the four TCGA-STAD molecular subtypes. E. Kaplan-Meier curves for GC patients in GS+CIN and MSI+EBV subtypes in the TCGA-STAD cohort. Log rank test, P=0.041. F. The proportion of three pyroptosis clusters in the MSS, MSI-High and MSI-Low subtypes. MSI, microsatellite instability; MSS, microsatellite stable. G. The proportion of three pyroptosis clusters in the EBV-positive and EBV-negative groups. H. Univariate Cox regression analysis of the clinicopathological factors and pyroptosis score in the TCGA-STAD cohort. I. Multivariate Cox regression analysis of the clinicopathological features and pyroptosis score in the TCGA-STAD cohort.
Figure 6
Figure 6
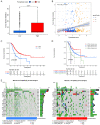
The correlation between the pyroptosis score and somatic variants. A. Difference of TMB level in the high and low pyroptosis score groups. Wilcoxon test, P=0.011. B. Scatterplots presents the positive correlation between pyroptosis score and mutation load in the TCGA-STAD cohort. Spearman correlation analysis, R=0.13, P=0.011. C. Kaplan-Meier curves for GC patients with high and low TMB in the TCGA-STAD cohort. Log rank test, P<0.001. D. Kaplan-Meier curves for GC patients with different TMB status and pyroptosis scores in the TCGA-STAD cohort. Log rank test, P<0.001. E. Mutational landscape of significantly mutated genes in TCGA-STAD cohort stratified by low (left panel, bule) and high pyroptosis score (right panel, red) subgroups. Each column represents an individual GC patient.
Figure 7
Figure 7
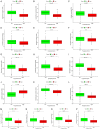
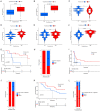
Identification of sensitive chemotherapy drugs based on the pyroptosis score. Box plots depicts the differences in the estimated IC50 levels of Bleomycin (A), Camptothecin (B), Cisplatin (C), Cytarabine (D), Dasatinib (E), Docetaxel (F), Doxorubicin (G), Etoposide (H), Gemcitabine (I), Imatinib (J), Methotrexate (K), Paclitaxel (L), Rapamycin (M), Sunitinib (N), Vinblastine (O), and Vinorelbine (P) between the high and low pyroptosis score groups.
Figure 8
Figure 8
Prediction values of pyroptosis score in immunotherapeutic benefits. (A, B) Difference in PD-1 (A) and PD-L1 (B) expression between high and low pyroptosis score groups (P<0.0001). (C-F) Comparison of IPS between the GC patients with high and low pyroptosis score groups in the CTLA4 negative/positive or PD-1 negative/positive groups. CTLA4_positive or PD1_positive represents anti-CTLA4 or anti-PD-1/PD-L1 therapy, respectively. (G, H) Kaplan-Meier curves (G) and clinical response (H) to anti-PD-1 therapy for patients in high and low pyroptosis score groups from the GSE78220 cohort. (I, J) Kaplan-Meier curves (G) and clinical response (H) to anti-PD-1/PD-L1 therapy for patients in high and low pyroptosis score groups from the GSE135222 cohort. (K, L) Kaplan-Meier curves (K) and clinical response (L) to anti-CTLA4 and anti-PD-1 therapy for patients in high and low pyroptosis score groups from the GSE91061 cohort. CR, Complete Response; PR, Partial Response; SD, Stable Disease; PD, Progressive Disease; DCB, Durable Clinical Benefit; NDB, Non-Durable Benefit; NA, Not Determined.

Similar articles

Cited by

References

    1. Siegel RL, Miller KD, Jemal A. Cancer statistics, 2020. CA Cancer J Clin. 2020;70:7–30. - PubMed
    1. Yang W, Ma J, Zhou W, Cao B, Zhou X, Yang Z, Zhang H, Zhao Q, Fan D, Hong L. Molecular mechanisms and theranostic potential of miRNAs in drug resistance of gastric cancer. Expert Opin Ther Targets. 2017;21:1063–1075. - PubMed
    1. Johnston FM, Beckman M. Updates on management of gastric cancer. Curr Oncol Rep. 2019;21:67. - PubMed
    1. Helmy KY, Patel SA, Nahas GR, Rameshwar P. Cancer immunotherapy: accomplishments to date and future promise. Ther Deliv. 2013;4:1307–1320. - PubMed
    1. Zhuo M, Chi Y, Wang Z. The adverse events associated with combination immunotherapy in cancers: challenges and chances. Asia Pac J Clin Oncol. 2020;16:e154–e159. - PubMed

LinkOut - more resources