. 2022 Apr 22:12:852980.
doi: 10.3389/fonc.2022.852980. eCollection 2022.

Comprehensive Target Screening and Cellular Profiling of the Cancer-Active Compound b-AP15 Indicate Abrogation of Protein Homeostasis and Organelle Dysfunction as the Primary Mechanism of Action

Affiliations

Comprehensive Target Screening and Cellular Profiling of the Cancer-Active Compound b-AP15 Indicate Abrogation of Protein Homeostasis and Organelle Dysfunction as the Primary Mechanism of Action

Johannes Gubat et al. Front Oncol. .

Abstract

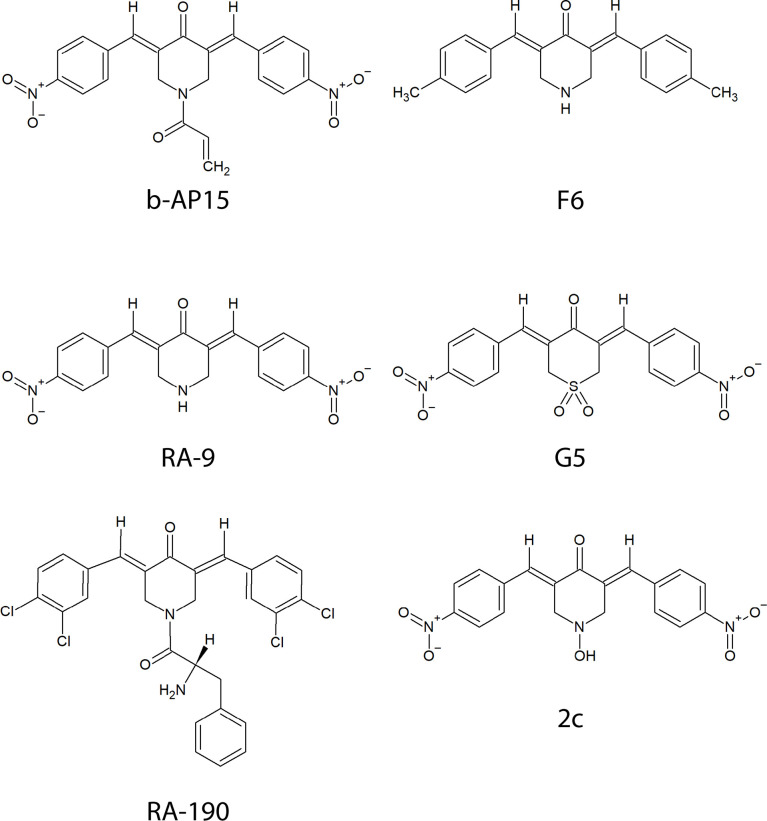
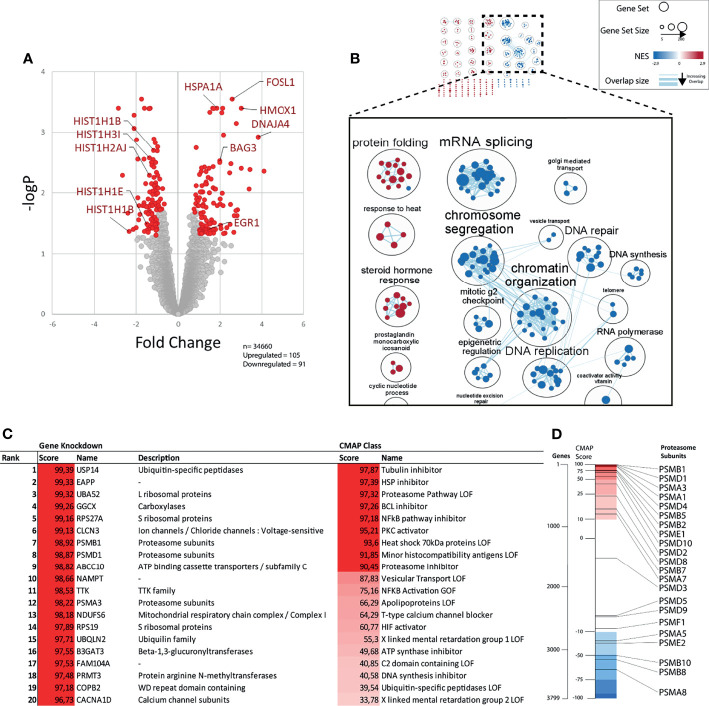
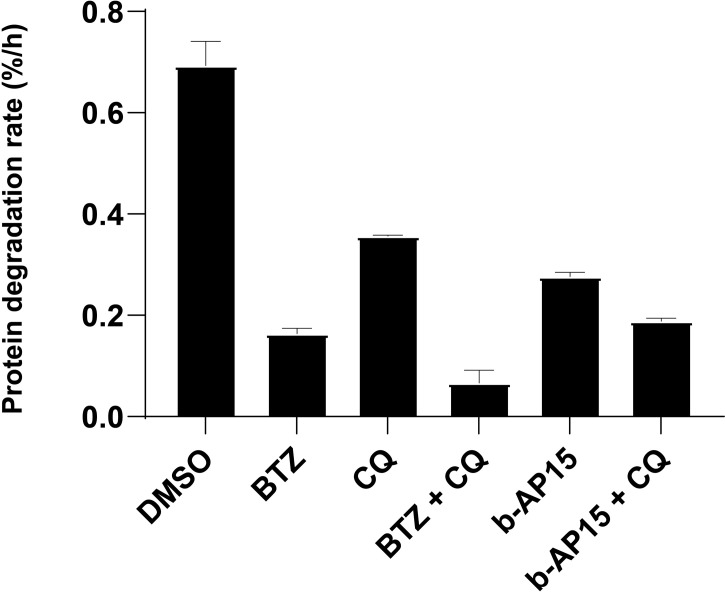
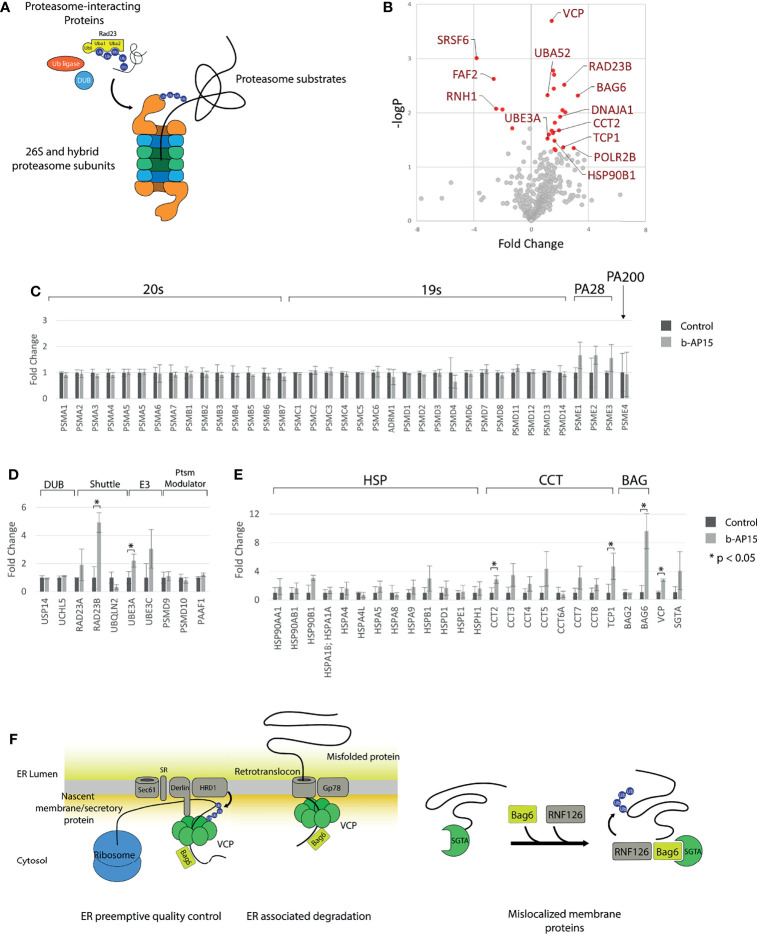
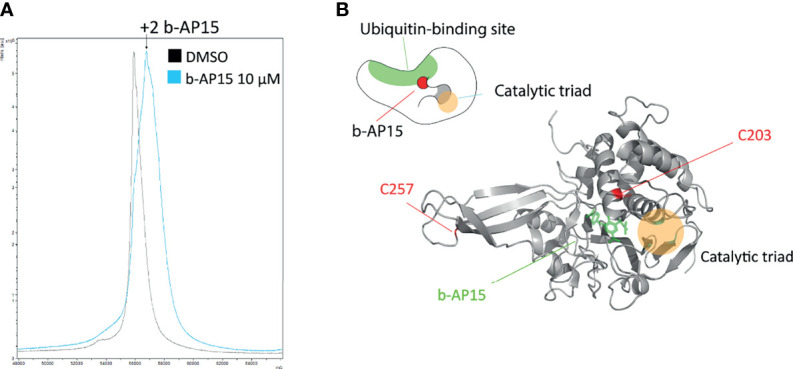
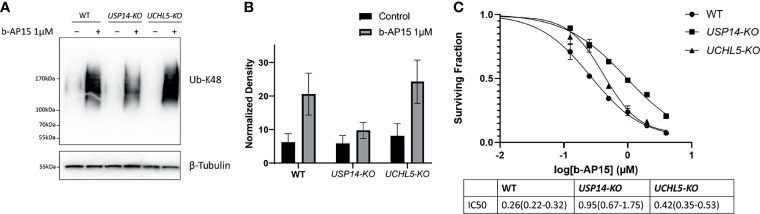
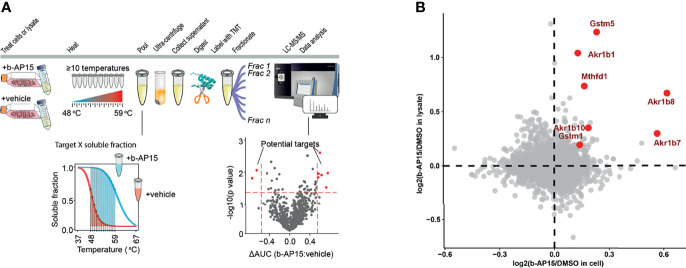
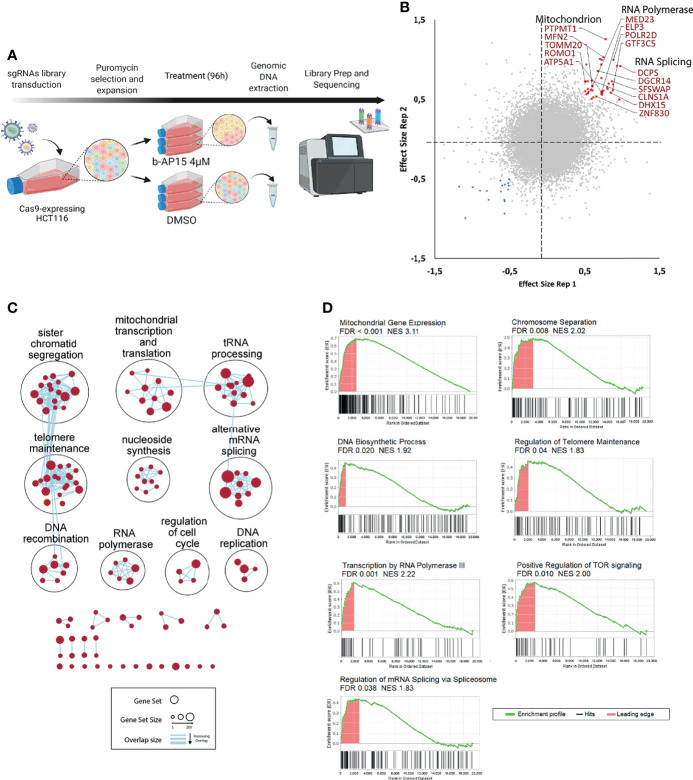
Dienone compounds have been demonstrated to display tumor-selective anti-cancer activity independently of the mutational status of TP53. Previous studies have shown that cell death elicited by this class of compounds is associated with inhibition of the ubiquitin-proteasome system (UPS). Here we extend previous findings by showing that the dienone compound b-AP15 inhibits proteasomal degradation of long-lived proteins. We show that exposure to b-AP15 results in increased association of the chaperones VCP/p97/Cdc48 and BAG6 with proteasomes. Comparisons between the gene expression profile generated by b-AP15 to those elicited by siRNA showed that knock-down of the proteasome-associated deubiquitinase (DUB) USP14 is the closest related to drug response. USP14 is a validated target for b-AP15 and we show that b-AP15 binds covalently to two cysteines, Cys203 and Cys257, in the ubiquitin-binding pocket of the enzyme. Consistent with this, deletion of USP14 resulted in decreased sensitivity to b-AP15. Targeting of USP14 was, however, found to not fully account for the observed proteasome inhibition. In search for additional targets, we utilized genome-wide CRISPR/Cas9 library screening and Proteome Integral Solubility Alteration (PISA) to identify mechanistically essential genes and b-AP15 interacting proteins respectively. Deletion of genes encoding mitochondrial proteins decreased the sensitivity to b-AP15, suggesting that mitochondrial dysfunction is coupled to cell death induced by b-AP15. Enzymes known to be involved in Phase II detoxification such as aldo-ketoreductases and glutathione-S-transferases were identified as b-AP15-targets using PISA. The finding that different exploratory approaches yielded different results may be explained in terms of a "target" not necessarily connected to the "mechanism of action" thus highlighting the importance of a holistic approach in the identification of drug targets. We conclude that b-AP15, and likely also other dienone compounds of the same class, affect protein degradation and proteasome function at more than one level.

Keywords: Michael acceptor; b-AP15; dienone; mitochondrial dysfunction; proteasome inhibitor; target screening.


Conflict of interest statement

The authors declare that the research was conducted in the absence of any commercial or financial relationships that could be construed as a potential conflict of interest.

Figures

Figure 1
Figure 1
Chemical structures of compounds containing a bioactive 1,5-diaryl-3-oxo-1,4-pentadienyl pharmacophore described in the text.
Figure 2
Figure 2
Gene expression profile after b-AP15 treatment. MCF7 cells were treated for 6h with either 1µM of b-AP15 or DMSO. Relative change in gene expression was obtained through microarray analysis. (A) Of the 34660 probes, 196 were differentially expressed. 105 were upregulated and 91 were downregulated in the relative to the control (adjusted p value < 0.05; more than 2-fold up or down regulated; n=3). Each point represents a probe. Immediate early genes (EGR1, FOSL1), HMOX1, chaperones (HSPA1A, BAG3, DNAJA4), and downregulated histones are shown. (B) Network analysis of enriched gene sets. Enriched gene sets (FDR < 0.05) were clustered based on their degree of overlap (number of similar genes). Gene sets overrepresented in upregulated genes have a positive NES (red) and downregulated genes have negative NES (blue). The top figure shows all the clusters. The magnified set at the bottom shows the select related clusters (C) The top differentially expressed genes were analyzed using the connectivity map (CMap) to find gene knockdowns or CMap classes in the CMap database that have a similar gene expression signature. Scores >90 are considered significant. (D) Bars show the position of curated gene knockdown signatures (black lines) relative to all 3799 gene knockdown signatures (spectrum) in the CMap database. Positive scores (red region) represent the correlated and negative scores (blue region) represents the inversely correlated knock-down gene signatures.
Figure 3
Figure 3
b-AP15 inhibits proteasomal degradation. Degradation of long-lived proteins. HCT116 cells were pulse-labeled with 3H-Phenylalanine and treated with the indicated drug or drug combination. The protein degradation rate is calculated from the acid-soluble radioactivity released into the media over 4 hours. The concentrations used are as follows: b-AP15 - 1µM, bortezomib (BTZ) - 1µM, chloroquine (CQ) – 40µM. Bars represent the mean of four replicates +/- SD; n=4. Pairwise comparisons except for BTZ vs b-AP15 + CQ (p = 0.77) are all significantly different (p < 0.05).
Figure 4
Figure 4
Quantification of proteasome and proteasome-associated proteins. Proteasomes and proteasome-associated proteins were affinity purified from HEK293-Bio-Rpn11 treated with either DMSO or 1µM b-AP15 and processed for LC-MS/MS and label-free quantification. (A) Types of proteins pulled down with HBTH-tagged proteasomes (B) 653 of the 757 identified proteins could be quantified. Cutoff values for significantly different proteins are logFCs > 1 or < and p-value < 0.05 (C) Relative amounts of 20S core particle and the 19S core particle. PA28 subunits are collectively increased with b-AP15 treatment (paired t-test p = 0.002) (D) Relative amounts of proteasome interacting proteins are largely unchanged. The levels of the Uba-Ubl protein RAD23B and the E3 ligase UBE3A is increased with b-AP15 treatment. (E) Heat shock proteins and components of the TRiC/CCT complex are collectively increased (paired t-test p < 0.002 for both). (F) VCP, BAG6 and SGTA relay protein substrates to the proteasome in the different protein quality control processes. b-AP15 treatment results in stalling of the proteasome and co-purification of these proteins. *p < 0.05.
Figure 5
Figure 5
b-AP15 binds USP14. Recombinant USP14 was exposed to 10µM b-AP15 or DMSO for 1 hour and subjected to mass spectrometry to identify binding sites. (A) MALDI-TOF mass spectrum Peak from b-AP15-treated sample shows a mass shift of roughly 810 Da corresponding to 2 molecules of b-AP15. LC-MS/MS shows b-AP15 modifications on Cys203 and Cys257 ( Supplementary Figure 2 ) (B) Docking study of b-AP15 on crystal structure of USP14 (2ayo) reveals that b-AP15 docks on between the ubiquitin binding surface and the crevice that leads to the catalytic triad. Top drawing is a representation of b-AP15-bound USP14.
Figure 6
Figure 6
b-AP15 cytotoxicity is partially mediated by USP14. (A) Parental HCT116, USP14-KO, and UCHL5-KO were exposed to either b-AP15(1µM) or DMSO for 8 hours. Whole cell lysates were obtained and probed for K48 polyubiquitin or β-tubulin (B) K48 polyubiquitin smears normalized to the corresponding β-tubulin bands. Each bar is the average normalized density from three independent samples +/- SD. The differences between b-AP15 and DMSO groups across all cell-types are not statistically significant (C) The sensitivity of parental and mutant cell lines to b-AP15 was studied using the MTT assay. Points represent the mean of four replicates +/- SD. The estimated and 95% confidence interval for the IC50s are listed in the table below the plot.
Figure 7
Figure 7
PISA analysis. (A) Schematic representation for PISA in living cells and cell lysate. B16-F10 cells or native lysate is treated with b-AP15 or vehicle (DMSO) and 10 aliquots are obtained. Each aliquot is heated to a specific temperature for 3 min. The aliquots corresponding to different temperature points are then pooled and centrifuged to collect the soluble fractions. The collected pools are then digested with trypsin, labeled with TMT and fractionated to extend the proteome coverage. The fractions are then subjected to LC-MS/MS and data is extracted and analyzed. The comparison of soluble fractions (area under the curve or AUC) for each protein in the presence and absence of the compound will highlight the drug targets. (B) The overlay of protein solubility in living cells vs. cell lysate highlights the proteins that are more soluble in the presence of b-AP15, indicating that they directly bind to the compound. P-values were calculated using a paired Student’s t-test (n=4). The highlighted proteins (red) have a p<0.05 in both living cell and lysate experiments.
Figure 8
Figure 8
CRISPR-Cas9 loss-of-function screening. (A) Schematic representation of the strategy for the CRISPR dropout screen. Cas9-expressing HCT116 cells were transduced with an sgRNA library targeting 19,364 protein-coding genes. Transduced cells were selected using puromycin. The cells are then expanded, split into two groups and treated with either b-AP15 or DMSO for 96 hours. After the treatment, genomic DNA is extracted and sequenced. (B) Correlation plot for two replicates. Red points represent guides that were enriched (>0.5 effect size) and blue points are the guides that were depleted (<-0.5 effect size) in the b-AP15-treated vs control cells in duplicate samples. Effect size is the log 2 of the ratio of normalized read counts for the sgRNA in the b-AP15-treated vs control cells. Guides present in enriched gene sets (mitochondrial genes, RNA polymerase components, and genes involved in RNA splicing) are labeled. (C) Network analysis of enriched gene sets. Gene set enrichment analysis was done on the sgRNAs ranked from the most enriched (targeting genes that confer sensitivity) to the most depleted (targeting genes that confer resistance). All gene sets with FDR < 0.1 were clustered based on their degree of overlap or similarity in genes. No gene sets were significantly overrepresented for depleted sgRNAs. (D) Enrichment of representative gene sets from the identified gene set clusters. The bar below the enrichment plot show the order of genes belonging to the gene set (hits) in the list of sgRNAs ranked from the most enriched (left) to the most depleted (right). Leading edge are the hits that contribute most to the gene set enrichment score.

Similar articles

Cited by

References

    1. Zhang X, Linder S, Bazzaro M. Drug Development Targeting the Ubiquitin-Proteasome System (UPS) for the Treatment of Human Cancers. Cancers (2020) 12(4):902. doi: 10.3390/cancers12040902 - DOI - PMC - PubMed
    1. LaPlante G, Zhang W. Targeting the Ubiquitin-Proteasome System for Cancer Therapeutics by Small-Molecule Inhibitors. Cancers (2021) 13(12):3079. doi: 10.3390/cancers13123079 - DOI - PMC - PubMed
    1. Berndtsson M, Beaujouin M, Rickardson L, Havelka AM, Larsson R, Westman J, et al. . Induction of the Lysosomal Apoptosis Pathway by Inhibitors of the Ubiquitin-Proteasome System. Int J Cancer (2009) 124(6):1463–9. doi: 10.1002/ijc.24004 - DOI - PubMed
    1. Mullally JE, Fitzpatrick FA. Pharmacophore Model for Novel Inhibitors of Ubiquitin Isopeptidases That Induce P53-Independent Cell Death. Mol Pharmacol (2002) 62(2):351–8. doi: 10.1124/mol.62.2.351 - DOI - PubMed
    1. D’Arcy P, Brnjic S, Olofsson MH, Fryknäs M, Lindsten K, De Cesare M, et al. . Inhibition of Proteasome Deubiquitinating Activity as a New Cancer Therapy. Nat Med (2011) 17:1636. doi: 10.1038/nm.2536 - DOI - PubMed