. 2022 Apr 22:12:818437.
doi: 10.3389/fonc.2022.818437. eCollection 2022.

Intrinsic Differences in Spatiotemporal Organization and Stromal Cell Interactions Between Isogenic Lung Cancer Cells of Epithelial and Mesenchymal Phenotypes Revealed by High-Dimensional Single-Cell Analysis of Heterotypic 3D Spheroid Models

Affiliations

Intrinsic Differences in Spatiotemporal Organization and Stromal Cell Interactions Between Isogenic Lung Cancer Cells of Epithelial and Mesenchymal Phenotypes Revealed by High-Dimensional Single-Cell Analysis of Heterotypic 3D Spheroid Models

Maria L Lotsberg et al. Front Oncol. .

Abstract

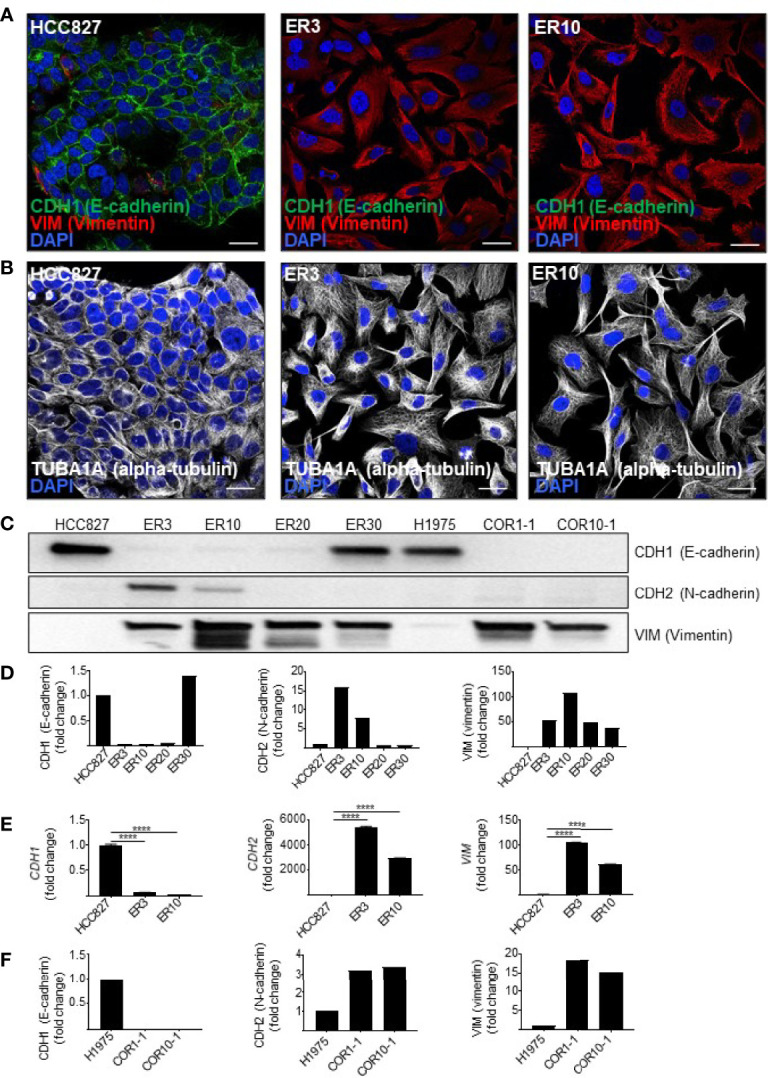
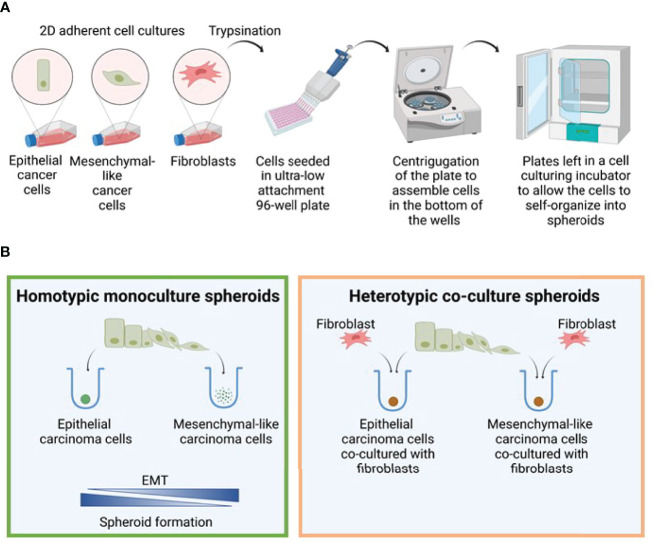
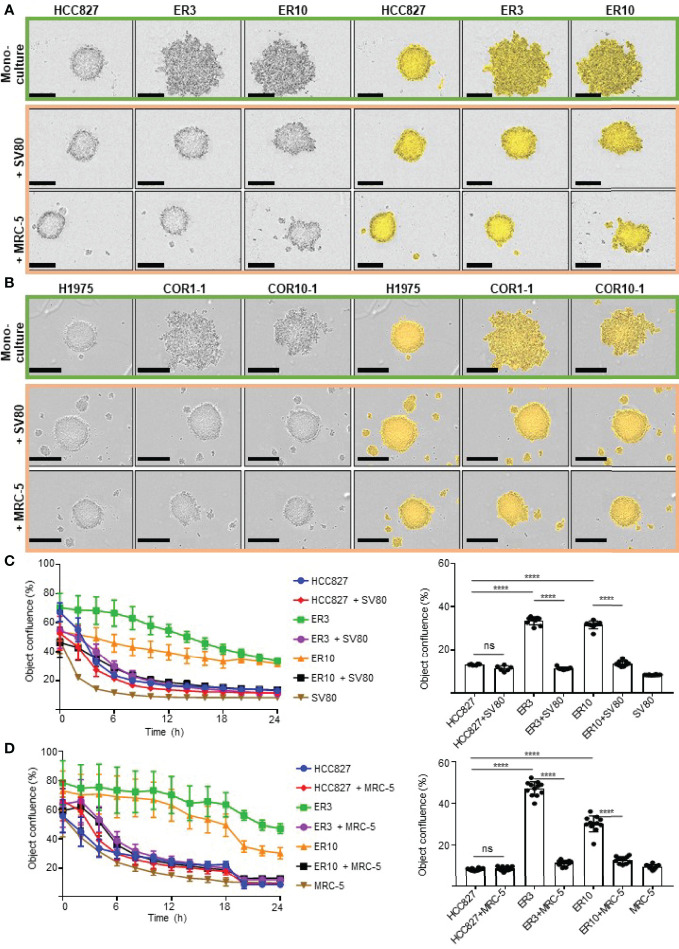
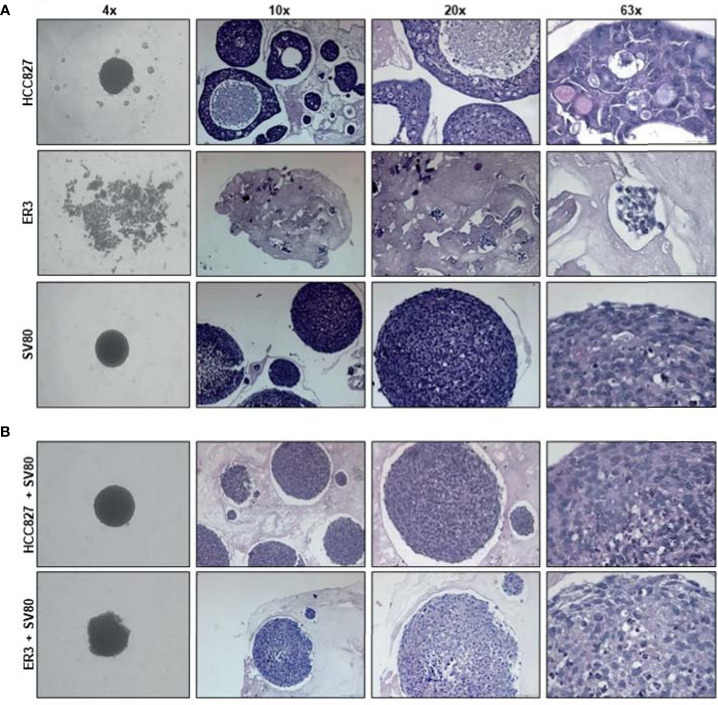
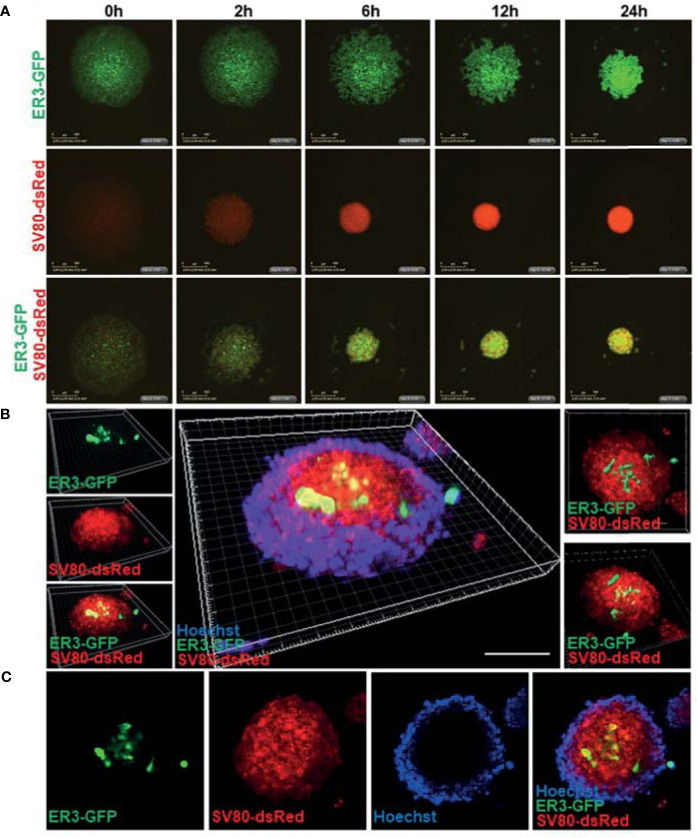
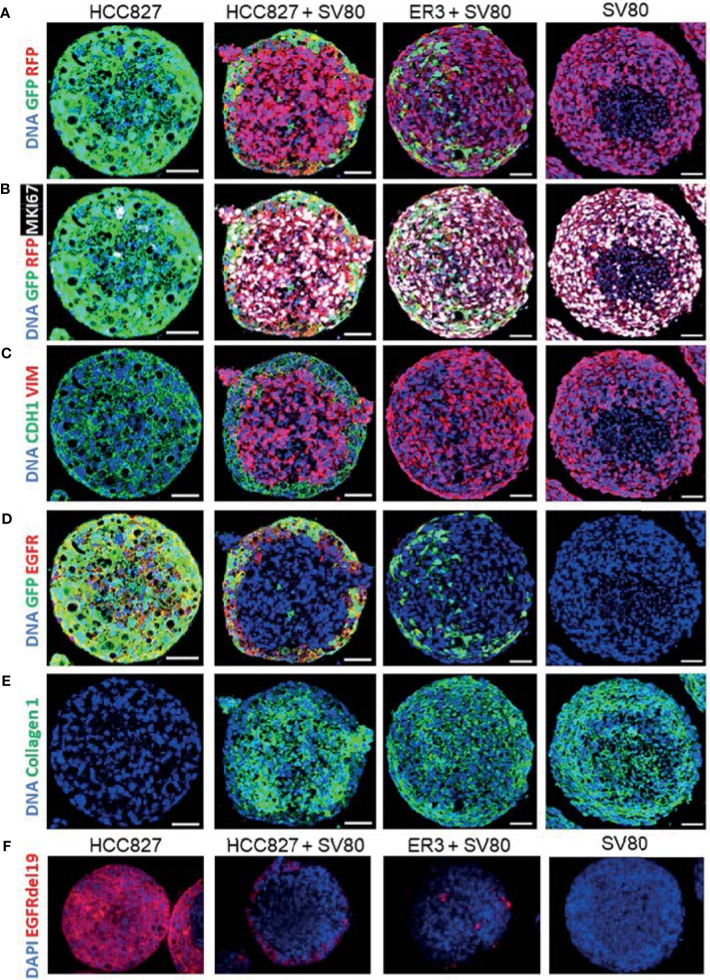
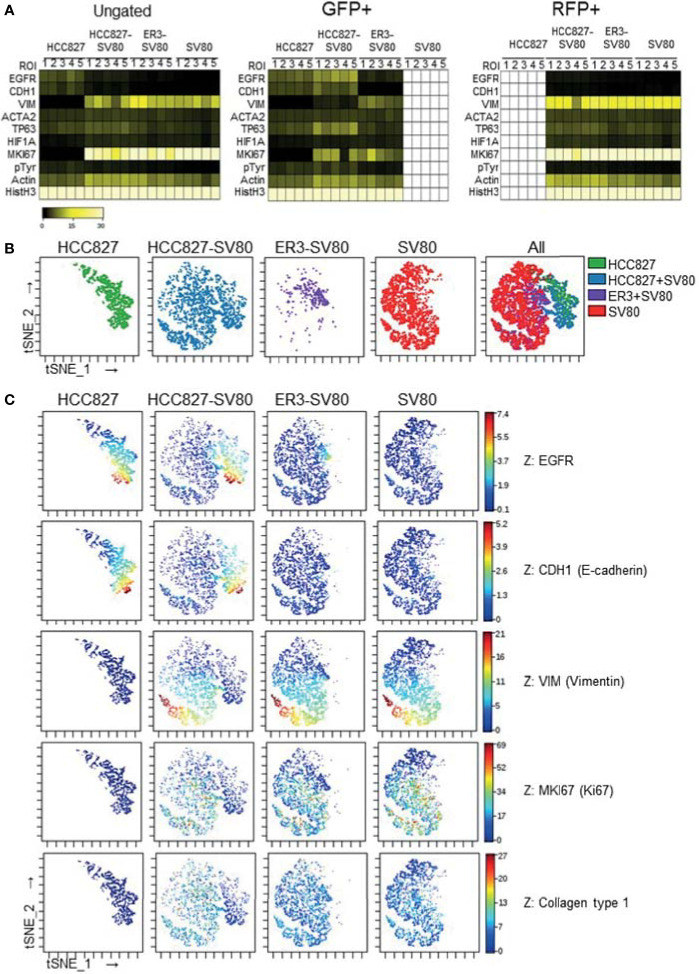
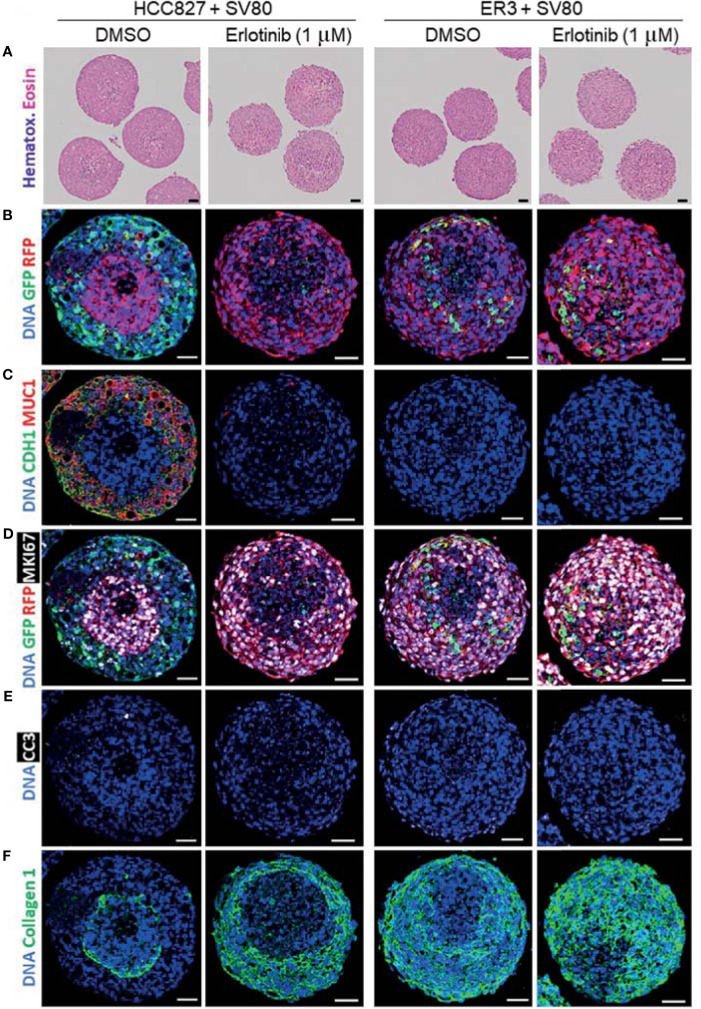
The lack of inadequate preclinical models remains a limitation for cancer drug development and is a primary contributor to anti-cancer drug failures in clinical trials. Heterotypic multicellular spheroids are three-dimensional (3D) spherical structures generated by self-assembly from aggregates of two or more cell types. Compared to traditional monolayer cell culture models, the organization of cells into a 3D tissue-like structure favors relevant physiological conditions with chemical and physical gradients as well as cell-cell and cell-extracellular matrix (ECM) interactions that recapitulate many of the hallmarks of cancer in situ. Epidermal growth factor receptor (EGFR) mutations are prevalent in non-small cell lung cancer (NSCLC), yet various mechanisms of acquired resistance, including epithelial-to-mesenchymal transition (EMT), limit the clinical benefit of EGFR tyrosine kinase inhibitors (EGFRi). Improved preclinical models that incorporate the complexity induced by epithelial-to-mesenchymal plasticity (EMP) are urgently needed to advance new therapeutics for clinical NSCLC management. This study was designed to provide a thorough characterization of multicellular spheroids of isogenic cancer cells of various phenotypes and demonstrate proof-of-principle for the applicability of the presented spheroid model to evaluate the impact of cancer cell phenotype in drug screening experiments through high-dimensional and spatially resolved imaging mass cytometry (IMC) analyses. First, we developed and characterized 3D homotypic and heterotypic spheroid models comprising EGFRi-sensitive or EGFRi-resistant NSCLC cells. We observed that the degree of EMT correlated with the spheroid generation efficiency in monocultures. In-depth characterization of the multicellular heterotypic spheroids using immunohistochemistry and high-dimensional single-cell analyses by IMC revealed intrinsic differences between epithelial and mesenchymal-like cancer cells with respect to self-sorting, spatiotemporal organization, and stromal cell interactions when co-cultured with fibroblasts. While the carcinoma cells harboring an epithelial phenotype self-organized into a barrier sheet surrounding the fibroblasts, mesenchymal-like carcinoma cells localized to the central hypoxic and collagen-rich areas of the compact heterotypic spheroids. Further, deep-learning-based single-cell segmentation of IMC images and application of dimensionality reduction algorithms allowed a detailed visualization and multiparametric analysis of marker expression across the different cell subsets. We observed a high level of heterogeneity in the expression of EMT markers in both the carcinoma cell populations and the fibroblasts. Our study supports further application of these models in pre-clinical drug testing combined with complementary high-dimensional single-cell analyses, which in turn can advance our understanding of the impact of cancer-stroma interactions and epithelial phenotypic plasticity on innate and acquired therapy resistance in NSCLC.

Keywords: drug resistance; erlotinib-resistance; heterotypic 3D models; imaging mass cytometry; in vitro cell culture models; non-small cell lung cancer (NSCLC); tumor microenvironment.


Conflict of interest statement

Author AR was employed by BerGenBio. The remaining authors declare that the research was conducted in the absence of any commercial or financial relationships that could be construed as a potential conflict of interest.

Figures

Figure 1
Figure 1
Resistance to first- and second-generation EGFR inhibitors is associated with features of EMT. (A) Immunocytochemistry of HCC827 parental cells and the erlotinib-resistant clones ER3 and ER10 for the epithelial marker CDH1 (E-cadherin) and the mesenchymal marker VIM (vimentin) to examine markers of epithelial plasticity upon acquired drug resistance. Counterstain by DAPI. Scalebar = 30 μm. (B) TUBA1A (alpha-tubulin) immunocytochemistry of the cells described in (A) were applied to reveal the phenotypic shift in cell morphology. Counterstain by DAPI. Scalebar = 30 μm. (C) Western blots were prepared with lysates from the HCC827 parental cells and the erlotinib-resistant clones ER3, ER10, ER20, and ER30 H1975 parental cells and the clones COR1-1 and COR10-1 resistant to the second-generation EGFR inhibitor rociletinib. Immunodetection of epithelial marker CDH1 (E-cadherin) (135 kDa), mesenchymal markers CDH2 (N-cadherin) (135 kDa), VIM (vimentin) (54 kDa). Western blot analysis was repeated n = 3 times, and a representative experiment is presented in the figure. (D) Quantification of the western blot presented in (C) normalized against total protein presented in Supplementary Figure 1A (VIM and CDH1) and B (CDH2). Fold change values for the resistant clones ER3 and ER10 relative to their parental cell line HCC827 (E) Expression of transcripts encoding CDH1, CDH2, VIM, assessed by RT-qPCR on cDNA prepared from HCC827 parental, ER3, and ER10 cells. RT-qPCR analyses were repeated n = 3 times, and representative results from one experiment with n = 3 technical replicates are presented in the figure as mean fold change +/- SD calculated by the 2–ΔΔCt method. Two-way ANOVA followed by Tukey’s multiple comparison test comparing ER3 and ER10 against the parental cell line showed that for all genes, the gene expression of all genes in both ER3 and ER10 were significantly different from the parental cells (P < 0.0001). (F) Quantification of the western blot presented in (C) normalized against total protein presented in Supplementary Figure 1A (VIM and CDH1) and B (CDH2). Fold change values for the resistant clones COR1-1 and COR10-1 relative to their parental cell line H1975. ****P ≤ 0.0001.
Figure 2
Figure 2
Spheroid formation model. (A) Model figure depicting the generation of 3D monoculture spheroids in round bottom ultra-low attachment plates. (B) The efficiency of spheroid formation is closely linked to the degree of EMT, and the epithelial cells generated spheroids in monoculture much more efficiently than the mesenchymal cells. In contrast, both epithelial and mesenchymal phenotypes were able to form spheroids when co-cultured with fibroblasts. Figure created with biorender.com.
Figure 3
Figure 3
Monitoring cell aggregation and 3D spheroid formation ability in real time using the IncuCyte live cell imaging system. (A) The lung adenocarcinoma cell line HCC827 and erlotinib-resistant sub-clones of this cell line (ER3, ER10) were cultured as homotypic spheroids (upper panel) and in combination with lung fibroblast cell lines SV80 (middle panel) or MRC-5 (lower panel). Images were obtained with the IncuCyte live cell imaging system 24 h after seeding in the ultra-low attachment (3D) 96-well plates. The IncuCyte confluence mask (yellow) was generated for the quantification shown in (C, D). (B) The NSCLC cell line H1975 and rociletinib-resistant sub-clones (COR1-1 and COR10-1) were cultured as homotypic spheroids (upper panel) or in combination with lung fibroblast cell lines SV80 (middle panel) or MRC-5 (lower panel). Images were obtained with the IncuCyte live cell imaging system 24 h after seeding in the ultra-low attachment (3D) 96-well plates. Spheroid formation efficiency was measured by quantification of the object confluence measured by the IncuCyte Zoom microscope and software-generated confluence mask (yellow) in HCC827, ER3, or ER10 cell monocultured spheroids or as heterotypic co-culture spheroids together with (C) SV80 or (D) MRC-5. Object confluence over the 24 h time-course and the values for the 24 h endpoint is given. Spheroid formation assays were repeated at least three times, and representative results from one experiment with n = 6-10 technical replicates are presented as mean +/- SD. One-way ANOVA followed by Tukey’s multiple comparisons test was performed to calculate statistical differences in object confluence at 24 h. ****P ≤ 0.0001. ns, not significant.
Figure 4
Figure 4
Histological characteristics of homotypic and heterotypic co-culture spheroids. (A) Monoculture spheroids of HCC827 parental cells, the erlotinib-resistant clone ER3, and the fibroblast cell line SV80 were cultured for seven days in ultra-low attachment plates before fixation, paraffin embedding, and sectioning. Spheroids are stained with hematoxylin and eosin (H&E). ER3 cells formed only loosely attached clusters of cells captured in a thrombin gel before paraffin embedding. (B) Heterotypic co-culture spheroids consisting of SV80 fibroblasts and HCC827 parental or ER3 cells in a 2:1 ratio. Spheroids were cultured for seven days in ultra-low attachment plates before fixation, paraffin embedding, and sectioning. Spheroids are stained with H&E. The light pink matrix surrounding the loosely attached cell clusters of ER cells, and the spheroids is the serum-thrombin clot used to cast the spheroids. Magnification is indicated.
Figure 5
Figure 5
Real-time spheroid formation and compound penetration in the 3D heterotypic co-culture spheroids made of fluorescent transgene expressing cells. (A) HCC827 ER3 cells and SV80 fibroblast cells were stably transduced by lentiviral particles harboring the GFP and dsRed transgene, respectively. Transduced cells were subsequently sorted by FACS to obtain a population of cells with a uniform transgene expression. 3D spheroid formation was studied by time-lapse imaging using the IncuCyte system. Images were obtained every 2 h using 4x objective. Representative images from the 0-24 h time interval are shown for homotypic ER3 and SV80 cells, as well as the ER3 and SV80 heterotypic spheroids. Scalebar = 500 μm. (B) The illustration shows a 3D heterotypic co-culture spheroid of HCC827ER3 (GFP) and SV80 (dsRed) counterstained by Hoechst (blue). Images obtained by Zeiss confocal microscope. Z-stack depth = 71.77 µm. Reconstruction by IMARIS software. Scale bar: 100 µm. (C) ER3 and SV80 heterotypic spheroids were stained for 7 days with Hoechst to visualize the penetration of drugs of comparable size.
Figure 6
Figure 6
Characterization of spheroids using immunohistochemistry with fluorescent detection and imaging mass cytometry. HCC827-GFP monoculture, HCC827-GFP + SV80-dsRed co-culture, ER3-GFP + SV80-dsRed co-culture, and SV80-dsRed monoculture spheroids were stained with an imaging mass cytometry panel of 14 heavy metal-tagged antibodies ( Table 3 ). For each condition, five ROIs containing a single spheroid were ablated by a Hyperion imaging mass cytometer (Fluidigm, Inc.). Representative ROIs are displayed showing (A) GFP and RFP, (B) GFP, RFP and MKI67 (Ki67), (C) CDH1 (E-cadherin), and VIM (Vimentin), (D) GFP and EGFR, (E) and Collagen 1. DNA staining displayed in all images is a combination of Iridium intercalator stain (Ir191 and Ir193) and Histone H3. Images were pseudo-colored in MCD viewer software (Fluidigm) to enable visualization of multiple channels per ROI, and for each channel the minimum and maximum intensity display settings are manually set to be kept constant between the samples. Scalebar = 50 µm (F) Immunohistochemistry staining with the EGFRdel19 mutation-specific antibody and AF647 fluorescence tagged secondary antibody together with DAPI counterstain. Fluorescent images were taken with a Zeiss Collibri7 fluorescence microscope.
Figure 7
Figure 7
In-depth analysis of imaging mass cytometry single-cell data from mono- and co-culture spheroids. (A) Single-cell expression data obtained from segmentation of the imaging mass cytometry experiment are displayed as a heatmap of the ungated (left), GFP+ (middle) and RFP+ (right) populations. Single-cell data was first generated as the mean pixel intensity for each cell, and the median intensity of all cells within a given population is displayed in the heatmaps. (B) The tSNE algorithm was applied on the ungated population based upon expression of the three markers EGFR, CDH1 (E-cadherin), and VIM (vimentin). viSNE plots displaying the distribution of cells from the different samples. (C) Marker expression of EGFR, CDH1 (E-cadherin), VIM (vimentin), MKI67 (Ki67), and Collagen type 1 displayed on the viSNE plots.
Figure 8
Figure 8
Characterization of erlotinib-treated heterotypic spheroids using H&E staining and imaging mass cytometry. (A) H&E-stained sections of heterotypic HCC827-GFP + SV80-dsRed co-culture, ER3-GFP + SV80-dsRed co-culture spheroids. (B–F) Paraffin sections of vehicle (DMSO) and erlotinib- treated heterotypic HCC827-GFP + SV80-dsRed co-culture, ER3-GFP + SV80-dsRed co-culture spheroids were stained with an imaging mass cytometry panel of 19 heavy metal-tagged antibodies ( Table 3 ). For each condition, five ROIs containing a single spheroid were ablated by a Hyperion imaging mass cytometer (Fluidigm, Inc.). Representative ROIs are displayed showing: (B) GFP and RFP, (C) epithelial marker CDH1 (E-cadherin) and MUC1 (Mucin1/CD227), (D) GFP, RFP and proliferation marker MKI67 (Ki67), (E) apoptosis marker Cleaved caspase 3 (CC3), and (F) Collagen 1. DNA staining by Iridium intercalator stain (Ir191 and Ir193). Images were pseudo-colored in MCD viewer software (Fluidigm) to enable visualization of multiple channels per ROI, and for each channel the minimum and maximum intensity display settings are kept constant between the samples. Scalebar = 50 µm.
Figure 9
Figure 9
In-depth analysis of imaging mass cytometry data from erlotinib treated spheroids. Absolute cell counts for HCC827+SV80 and ER3+SV80 heterotypic spheroids treated with either vehicle control (DMSO) or erlotinib, respectively. Absolute cell counts for (A) GFP+ cells (cancer cells), and (B) RFP+ cells (fibroblasts) is shown. Individual values represent median expression of each ROIs, and the mean +/-SD is plotted. Statistical significance in absolute cell counts were calculated in cytobank using the Mann-Whithey U-test (C) The diameter of erlotinib treated versus vehicle control (DMSO) treated spheroids measured by quantifying H&E-stained images using the measuring tool in Fiji. Mean diameter +/- SD for each condition is shown, and the statistics is performed in GraphPad Prism using the Mann-Whithey U-test. (D–F) Median expression of proliferation marker MKI67 (Ki67) in the nuclei of the RFP+ population (D). Median expression of ACTA2 (αSMA) (E), and PDGFRB (PDGFRβ) (F) in the RFP+ (fibroblast) populations of HCC827+SV80 and ER3+SV80 heterotypic spheroids treated with either erlotinib or vehicle (DMSO) control. Individual values represent median expression for each ROIs, and the mean +/- SD is plotted. Statistical significance in channel expression were calculated in cytobank using the Mann-Whithey U-test (G–I) Distance to border measurements displayed as Violin plots for the (G) ungated (all) population, (H) GFP+ population, and (I) RFP+ population. (J) The tSNE algorithm was applied on the ungated population based upon expression of the markers EGFR, CDH1 (E-cadherin), VIM (vimentin), MET (c-Met), pan-cytokeratin, GFP and RFP. viSNE plots displaying the distribution of cells from the different samples. NS = P > 0.05, *P ≤ 0.05, **P ≤ 0.01.

Similar articles

Cited by

References

    1. Sung H, Ferlay J, Siegel RL, Laversanne M, Soerjomataram I, Jemal A, et al. . Global Cancer Statistics 2020: GLOBOCAN Estimates of Incidence and Mortality Worldwide for 36 Cancers in 185 Countries. CA Cancer J Clin (2021) 71(3):209–49. doi: 10.3322/caac.21660 - DOI - PubMed
    1. Asao T, Takahashi F, Takahashi K. Resistance to Molecularly Targeted Therapy in Non-Small-Cell Lung Cancer. Respir Investig (2019) 57(1):20–6. doi: 10.1016/j.resinv.2018.09.001 - DOI - PubMed
    1. Rosell R, Bivona TG, Karachaliou N. Genetics and Biomarkers in Personalisation of Lung Cancer Treatment. Lancet (2013) 382(9893):720–31. doi: 10.1016/S0140-6736(13)61715-8 - DOI - PubMed
    1. Røsland GV, Engelsen AST. Novel Points of Attack for Targeted Cancer Therapy. Basic Clin Pharmacol Toxicol (2015) 116(1):9–18. doi: 10.1111/bcpt.12313 - DOI - PMC - PubMed
    1. Lotsberg ML, Rayford A, Thiery JP, Belleggia G, Peters SD, Lorens JB, et al. . Decoding Cancer’s Camouflage: Epithelial-Mesenchymal Plasticity in Resistance to Immune Checkpoint Blockade. Cancer Drug Resist (2020) 3:832–53. doi: 10.20517/cdr.2020.41 - DOI - PMC - PubMed