. 2022 Apr 5;12(7):e4379.
doi: 10.21769/BioProtoc.4379.

Stimulus-induced Robust Narrow-band Gamma Oscillations in Human EEG Using Cartesian Gratings

Affiliations

Stimulus-induced Robust Narrow-band Gamma Oscillations in Human EEG Using Cartesian Gratings

Dinavahi V P S Murty et al. Bio Protoc. .

Abstract

Stimulus-induced narrow-band gamma oscillations (20-70 Hz) are induced in the visual areas of the brain when particular visual stimuli, such as bars, gratings, or full-screen hue, are shown to the subject. Such oscillations are modulated by higher cognitive functions, like attention, and working memory, and have been shown to be abnormal in certain neuropsychiatric disorders, such as schizophrenia, autism, and Alzheimer's disease. However, although electroencephalogram (EEG) remains one of the most non-invasive, inexpensive, and accessible methods to record brain signals, some studies have failed to observe discernable gamma oscillations in human EEG. In this manuscript, we have described in detail a protocol to elicit robust gamma oscillations in human EEG. We believe that our protocol could help in developing non-invasive gamma-based biomarkers in human EEG, for the early detection of neuropsychiatric disorders.

Keywords: Artifact rejection; EEG; Gamma; Stimulus-induced gamma.


Conflict of interest statement

Competing interestsThe authors declare no competing financial interests.

Figures

Figure 1.
Figure 1.. Figure showing EEG setup in the subject area with and without the subject.
Video 1.
Video 1.. Video showing example gratings and example trials.
Each trial began with the appearance of a fixation point at the centre of the stimulus presentation screen. Within a trial, a series of gratings were presented (2 to 3 per trial) for 800 ms, with an interstimulus interval of 700 ms. Gratings were achromatic sinusoidal Cartesian gratings, whose spatial frequency was randomly chosen from 1, 2, and 4 cpd. The orientation of the gratings was randomly chosen from 0°, 45°, 90°, and 135°. The fixation point was presented on the screen throughout the trial, and disappeared at the end of the trial.
Video 2.
Video 2.. Video of a subject performing the task.
Subjects had to fixate on the fixation point throughout the trial. The trial was aborted if they broke fixation during the trial. After the trial ended or aborted, they were allowed to rest their eyes by breaking fixation, but keeping their head stable. Sounds were played through in-built speakers on iMac (the stimulus presentation computer) that alerted the subjects at the start of the trial, as well as when the trial ended, or when they broke fixation during the trial.
Figure 2.
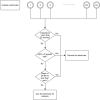
Figure 2.. Flowchart for separating bad repeats for each unipolar electrode.
Figure 3.
Figure 3.. Flowchart for creating a common set of bad repeats across all analyzable unipolar electrodes.
Figure 4.
Figure 4.. Flowchart for discarding bad unipolar electrodes.
Figure 5.
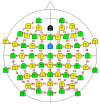
Figure 5.. Schematic showing bipolar montage.
The colored electrodes are physical electrodes placed on the scalp, as per the International 10-10 System (Easycap GmbH, Germany). These electrodes are referenced online to FCz (unipolar reference scheme). Ground is at AFz. Data from adjacent physical electrodes are referenced offline with respect to each other (bipolar reference scheme). Bipolar electrodes are shown in red. Each bipolar electrode is virtually placed in between the two constituent unipolar electrodes. We analyzed 112 such electrodes in our studies.
Figure 6.
Figure 6.. Spectra and spectrograms in an example subject.
a) Plot showing raw PSD (left axis) in the stimulus (black solid line) and baseline (black dashed line) periods, averaged across nine bipolar electrodes (PO3-P1, PO3-P3, POz-PO3, PO4-P2, PO4-P4, Poz-PO4, Oz-Poz, Oz-O1, and Oz-O2), and expressed on a log10 scale. On the axis on the right side, the change in PSD (solid blue line) from stimulus to baseline periods is shown on a dB scale. Slow gamma (20–34 Hz) and fast gamma (36–66 Hz) bands are shown in vertical violet and orange lines respectively. b) A plot showing raw (top panel) and change in power time-frequency spectrograms (bottom panel), for the same data as in a. Gamma bands are shown in solid white (slow gamma), and dashed (fast gamma) lines. Vertical black dashed lines indicate the time when stimulus was presented to the subjects (0–0.8 s), whereas red vertical dashed lines indicate the stimulus period considered for spectral analysis (0.25–0.75 s).

References

    1. Amir A.,Headley D. B.,Lee S. C.,Haufler D. and Pare D.(2018).Vigilance-Associated Gamma Oscillations Coordinate the Ensemble Activity of Basolateral Amygdala Neurons.Neuron 97(3):656-669 e657. - PMC - PubMed
    1. An K. M.,Ikeda T.,Yoshimura Y.,Hasegawa C.,Saito D. N.,Kumazaki H.,Hirosawa T.,Minabe Y. and Kikuchi M.(2018).Altered Gamma Oscillations during Motor Control in Children with Autism Spectrum Disorder.J Neurosci 38(36):7878-7886. - PMC - PubMed
    1. Buzsáki G. and Wang X. J.(2012).Mechanisms of gamma oscillations.Annu Rev Neurosci 35:203-225. - PMC - PubMed
    1. Chalk M.,Herrero J. L.,Gieselmann M. A.,Delicato L. S.,Gotthardt S. and Thiele A.(2010).Attention reduces stimulus-driven gamma frequency oscillations and spike field coherence in V1. Neuron 66(1):114-125. - PMC - PubMed
    1. Colgin L. L.,Denninger T.,Fyhn M.,Hafting T.,Bonnevie T.,Jensen O.,Moser M. B. and Moser E. I.(2009).Frequency of gamma oscillations routes flow of information in the hippocampus.Nature 462(7271):353-357. - PubMed

LinkOut - more resources