. 2022 May 3;2(3):391-404.
doi: 10.21873/cdp.10122. eCollection 2022 May-Jun.

ZAP70 Activation Compensates for Loss of Class IA PI3K Isoforms Through Activation of the JAK-STAT3 Pathway

Affiliations

ZAP70 Activation Compensates for Loss of Class IA PI3K Isoforms Through Activation of the JAK-STAT3 Pathway

Melike Demir et al. Cancer Diagn Progn. .

Abstract

Background/aim: Tyrosine kinases have crucial functions in cell signaling and proliferation. The phosphatidylinositol 3-kinase (PI3K) pathway is frequently deregulated in human cancer and is an essential regulator of cellular proliferation. We aimed to determine which tyrosine kinases contribute to resistance elicited by PI3K silencing and inhibition.

Materials and methods: To mimic catalytic inactivation of p110α/β, specific p110α (BYL719) and p110β (KIN193) inhibitors were used in addition to genetic knock-out in in vitro assays. Cell viability was assessed using crystal violet staining, whereas cellular transformation ability was analyzed by soft-agar growth assays.

Results: Activated zeta chain of T-cell receptor-associated protein kinase 70 (ZAP70) generated resistance to PI3K inhibition. This resistance was via activation of the Janus kinase/signal transducer and activator of transcription 3 (JAK/STAT3) axis. We demonstrated that activated ZAP70 has a high transforming capability associated with the formation of malignant phenotype in untransformed cells and has the potential to be a tumor-initiating factor in cancer cells.

Conclusion: ZAP70 may be a potent driver of proliferation and transformation in untransformed cells and is implicated in resistance to PI3K inhibitors in cancer cells.

Keywords: PI3K; ZAP70; cell signaling; growth resistance; tyrosine kinases.


Conflict of interest statement

The Authors declare no competing conflicts of interest.

Figures

Figure 1
Figure 1. Screening of ETS variant transcription factor 6 dimerization domain (TEL)-tyrosine kinase library. A: The TEL-tagged, activated tyrosine kinases were expressed in mouse embryonic fibroblasts (MEFs). Cells were then treated with Cre-expressing adenoviruses (Ade-Cre). Crystal violet assays were performed and relative cell growth for each pool was calculated. MEFs were transfected with green fluorescent protein (GFP) as a negative control and myristoylated AKT serine/threonine kinase 1 (MYR-AKT1) acted as a positive control. LacZ-expressing MEFs were used as a control for adenoviral infection. The data are the mean±standard deviation from experimental triplicates. B: Immunoblot analysis of tyrosine kinase pool 9 including neurotrophic receptor tyrosine kinase 3 (NTRK3), zeta chain of T-cell receptor-associated protein kinase 70 (ZAP70), protein tyrosine kinase 6 (PTK6) and protein tyrosine kinase 2 beta (PTK2B) expression in MEFs by using M2-Flag and phospho-tyrosine primary antibodies (4G10 clone). C: p110α/β Knockout upon Ade-Cre treatment in pool 9-expressing MEFs. Western blot analysis showed the knockout efficiency in these cells using primary antibodies for p110α and p110β.
Figure 2
Figure 2. Impact of activated zeta chain of T-cell receptor-associated protein kinase 70 (ZAP70) on proliferation of mouse embryonic fibroblasts (MEFs). A: Crystal violet growth assay was conducted for MEFs that express ZAP70, neurotrophic receptor tyrosine kinase 3 (NTRK3), protein tyrosine kinase 6 (PTK6), protein tyrosine kinase 2 beta (PTK2B) and pool 9. Cells were fixed and stained 2, 4 and 6 days after initial seeding. WT: Wild-type. B: Western blot analysis was conducted to confirm the protein expression of individual activated tyrosine kinases in MEFs using M2-FLAG primary antibody. Glyceraldehyde-3-phosphate dehydrogenase (GAPDH) was used as a loading control. C: Crystal violet growth assays showing growth rate of MEFs that expressed activated ZAP70, PTK6, and myristoylated serine/threonine kinase 1 (MYR-AKT1) as positive control and pBabe Neo WT MEFs as negative control. Data shown are the mean±standard deviation (SD), of three independent experiments analyzed by using two-way analysis of variance. ***Significantly different from pBabe Neo WT at p<0.0001. D: Immunoblots showing p110α/β expression in knockout MEFs. The p110α/β knockout efficiency was detected using primary antibodies to p110α and p110β. E: Crystal violet growth assay was conducted for adenovirus/Cre recombinase (Ad/Cre)-treated MEFs expressing activated ZAP70, PTK6, MYR-AKT1 or pBabe Neo. Data shown are the mean±SD of three independent experiments analysed by using two-way analysis of variance. ***Significantly different from pBabe Neo WT at p<0.0001. F: MEFs expressing activated tyrosine kinase were treated with phosphatidylinositol 3-kinase (PI3K)-p110α-specific inhibitor Alpelisib (BYL) with/without PI3K-p110β-specific inhibitor KIN193 (KIN). Crystal violet absorbance at 595 nm was measured. Data shown are the mean±SD of three independent experiments analysed using paired t-test. Significantly different from pBabe Neo WT at: *p<0.05 and **p<0.001 G: Soft-agar assay was conducted using activated ZAP70 and mutant H-Ras-expressing MEFs. Microscopy images show cells that were able to grow in an anchorage-independent manner. The graphs depict the number of visible colonies in triplicate experiments. Data shown are the mean±standard error of the mean. H: Western blot analysis was performed to detect activated signaling pathways in ZAP70-overexpressing MEFs using antibodies against phospho-specific signal transducer and activator of transcription 3 (pSTAT3-Tyr705), total STAT3, p-S6K p70 (Thr389), total S6, phospho-specific mitogen-activated protein kinase 3/1 (pERK1/2-Thr202/Tyr204), phospho-AKT serine/threonine kinase 1 (p-AKT-Ser473) and MYC proto-oncogene (MYC). MYR-AKT1 expression was used as a positive control for PI3K pathway activation.
Figure 3
Figure 3. Detection of zeta chain of T-cell receptor-associated protein kinase 70 (ZAP70) expression in different cell lines. A: Western blot analysis showing an endogenous ZAP70 expression. The size difference between positive controls was caused by the ETS variant transcription factor 6 (ETV6/TEL) tag for ZAP70 expression in T47D cells. B: ZAP70 phosphorylation in different cell lines. Asterisks indicate the position of endogenous ZAP70. Glyceraldehyde-3-phosphate dehydrogenase (GAPDH) was used as a loading control.
Figure 4
Figure 4. Investigation of the function of zeta chain of T-cell receptor-associated protein kinase 70 (ZAP70) expression in non-transformed epithelial cell lines. A: The immunoblots showing ETS variant transcription factor 6 (TEL)-ZAP70 expression in MCF10A and RPE1-hTERT cells using M2-FLAG antibody. B: Western blot analysis was performed to detect activated signaling pathways with antibodies against phospho-specific signal transducer and activator of transcription 3 (pSTAT3-Tyr705), total STAT3, p-S6K p70 (Thr389), p-S6 (Ser235/236), phospho-specific mitogenactivated protein kinase 3/1 (pERK1/2-Thr202/Tyr204), phospho-AKT serine/threonine kinase 1 (p-AKT-Ser473) and MYC. Glyceraldehyde-3-phosphate dehydrogenase (GAPDH) was used as a loading control. C: Crystal violet growth assay analysis showing growth inhibition of depicted RPE1-hTERT lines upon treatment with p110α- (BYL719) and p110β (KIN193)-specific inhibitors. Data shown are the mean±standard deviation, of triplicate independent experiments and analysed using two-way analysis of variance. **Significantly different from pBabe Neo WT at p<0.001. D: In the same RPE1-hTERT cells, soft-agar growth assays were performed, and representative images are shown on the left. The graph on the right depicts the number of visible colonies Data shown are the mean±standard error of the mean in three independent experiments.
Figure 5
Figure 5. Zeta chain of T-cell receptor-associated protein kinase 70 (ZAP70) alterations found in cBioPortal for the US National Cancer Institute (NCI)-60 cancer cell line studies. Based on these studies, ZAP70 amplification occurs highly in renal cell carcinomas. CNS: Copy-number alteration.
Figure 6
Figure 6. Zeta chain of T-cell receptor-associated protein kinase 70 (ZAP70) mRNA expression in tumor and normal tissue in different cancer types from The Cancer Genome Atlas (TCGA). The data were obtained from the University of Alabama Cancer Database (UALCAN). The yellow boxes indicate significantly elevated ZAP70 mRNA expression in solid tumor tissues compared to matched normal tissues. Error bars represent standard deviation. BLCA: Bladder urothelial carcinoma; BRCA: breast invasive carcinoma; COAD: colon adenocarcinoma; ESCA: esophageal carcinoma; CESC: cervical squamous cell carcinoma and endocervical adenocarcinoma; HNSC: head and neck squamous carcinoma; KICH: kidney chromophobe; KIRC: kidney renal clear -cell carcinoma; KIRP: kidney renal papillary cell carcinoma; LIHC: liver hepatocellular carcinoma; LUAD: lung adenocarcinoma; LUSC: lung squamous cell carcinoma; PAAD: pancreatic adenocarcinoma; PCPG: pheochromocytoma and paraganglioma; PRAD: prostate adenocarcinoma; READ: rectal adenocarcinoma; SARC: sarcoma; SKCM: skin cutaneous melanoma; STAD: stomach adenocarcinoma; UCEC: uterine corpus endometrial carcinoma; THCA: thyroid carcinoma; THYM: thymoma.
Figure 7
Figure 7. Kaplan–Meier graphs depicting overall survival according to expression of zeta chain of T-cell receptor-associated protein kinase 70 (ZAP70) in patients with gastric cancer using KM Plotter database for mRNA gene chip data (2104032_at) (A) and with renal clear-cell carcinoma (B), uveal melanoma (C) and low-grade glioma (D) via GEPIA2.
Figure 8
Figure 8. Kaplan–Meier survival graphs depicting survival according to expression of zeta chain of T-cell receptor-associated protein kinase 70 (ZAP70) in patients with gastric and ovarian cancer using KM Plot database for mRNA gene chip data (2104032_at). Overall survival of patients with stage 2 (A) and stage 3 (B) gastric cancer. Progression-free survival of patients with grade 1+2 ovarian cancer treated with paclitaxel/cisplatin (C).
Figure 9
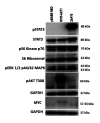
Figure 9. Zeta chain of T-cell receptor-associated protein kinase 70 (ZAP70) overexpression in HEK293T cells. Western blot analysis was performed to detect ETS variant transcription factor 6 (TEL)-ZAP70-mediated activation of downstream signaling components with antibodies against phospho-specific signal transducer and activator of transcription 3 (pSTAT3-Tyr705), total STAT3, p-S6K p70 (Thr389), pS6 (Ser235/236), phospho-specific mitogen-activated protein kinase 3/1 (p-ERK1/2-Thr202/Tyr204), phospho-AKT serine/threonine kinase 1 (pAKT-Thr308) and MYC proto-oncogene (MYC). Glyceraldehyde-3-phosphate dehydrogenase (GAPDH) was used as a loading control. MYR-AKT1 was used as positive control for phosphatidylinositol 3-kinase pathway activation.

Similar articles

Cited by

References

    1. Kondapalli L, Soltani K, Lacouture ME. The promise of molecular targeted therapies: protein kinase inhibitors in the treatment of cutaneous malignancies. J Am Acad Dermatol. 2005;53(2):291–302. doi: 10.1016/j.jaad.2005.02.011. - DOI - PubMed
    1. Hunter T. Protein kinase classification. Methods Enzymol. 1991;200:3–37. doi: 10.1016/0076-6879(91)00125-g. - DOI - PubMed
    1. Krause DS, Van Etten RA. Tyrosine kinases as targets for cancer therapy. N Engl J Med. 2005;353(2):172–187. doi: 10.1056/NEJMra044389. - DOI - PubMed
    1. Liu P, Cheng H, Roberts TM, Zhao JJ. Targeting the phosphoinositide 3-kinase pathway in cancer. Nat Rev Drug Discov. 2009;8(8):627–644. doi: 10.1038/nrd2926. - DOI - PMC - PubMed
    1. Vivanco I, Sawyers CL. The phosphatidylinositol 3-Kinase AKT pathway in human cancer. Nat Rev Cancer. 2002;2(7):489–501. doi: 10.1038/nrc839. - DOI - PubMed