. 2019 Oct 29;9(60):34964-34971.
doi: 10.1039/c9ra07011g. eCollection 2019 Oct 28.

BRET based dual-colour (visible/near-infrared) molecular imaging using a quantum dot/EGFP-luciferase conjugate

Affiliations

BRET based dual-colour (visible/near-infrared) molecular imaging using a quantum dot/EGFP-luciferase conjugate

Setsuko Tsuboi et al. RSC Adv. .

Abstract

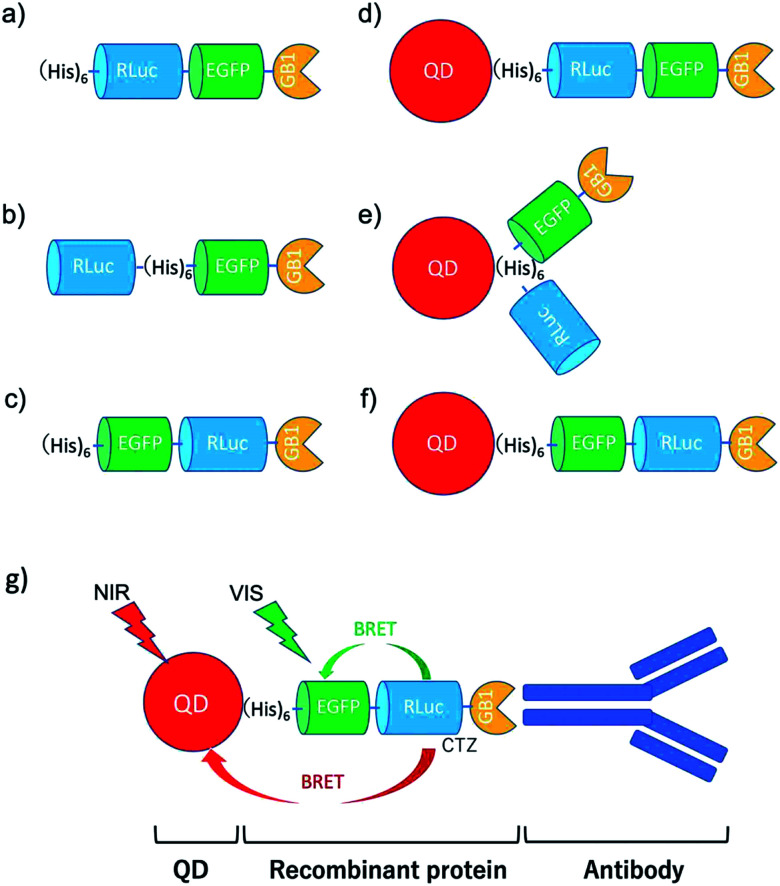
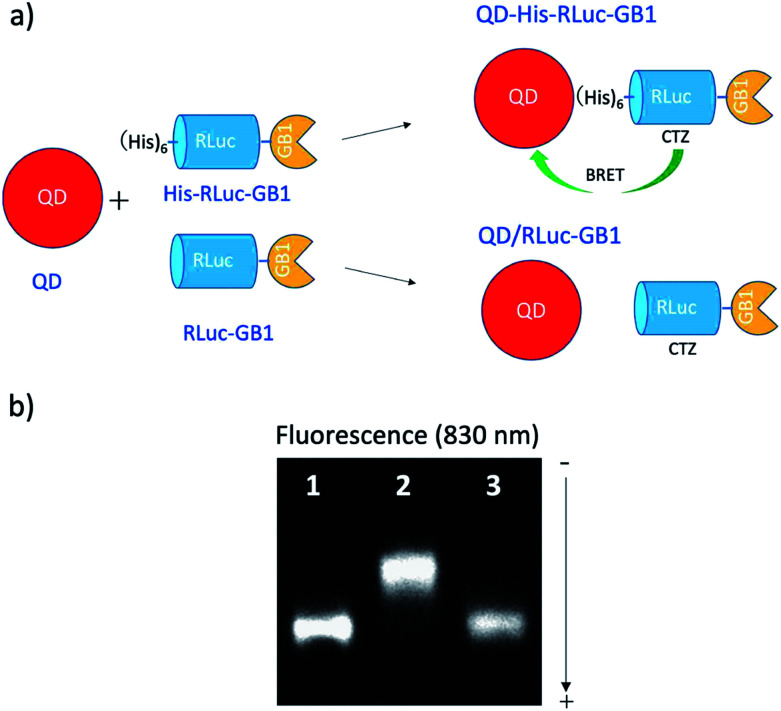
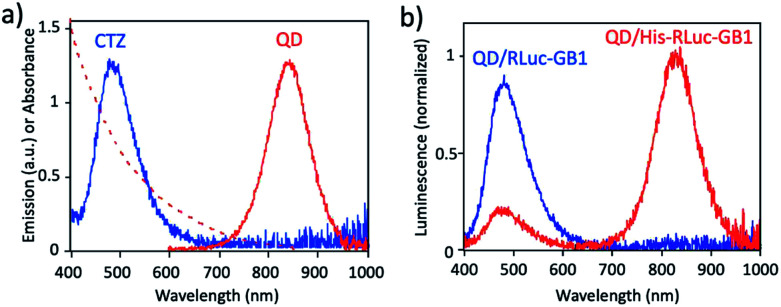
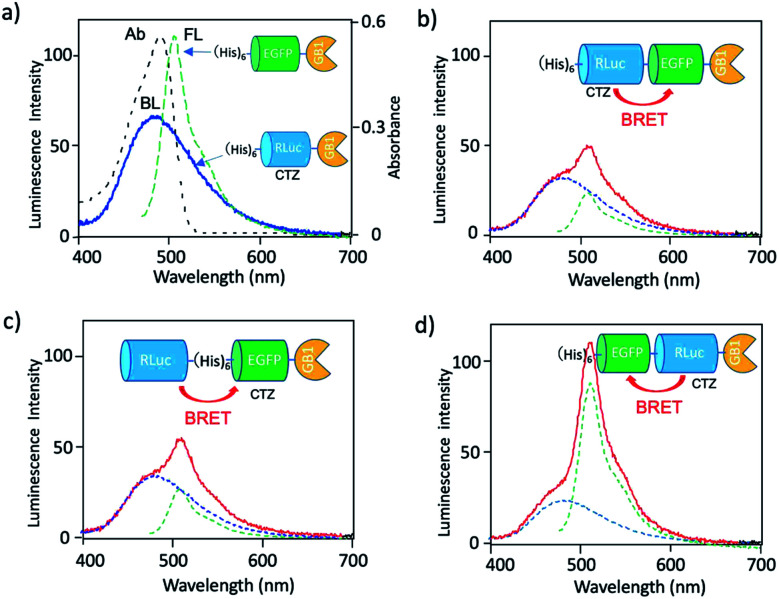
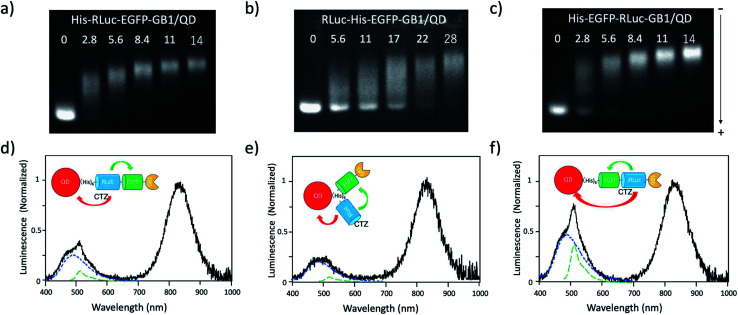
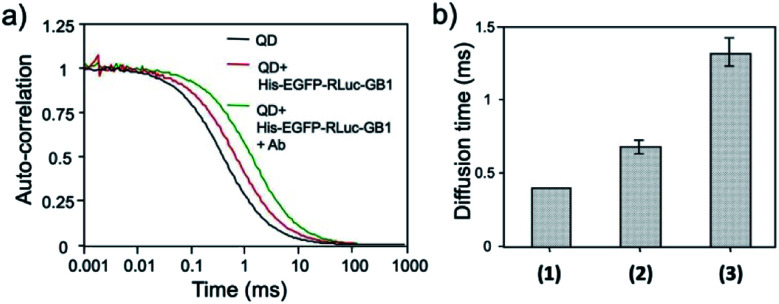
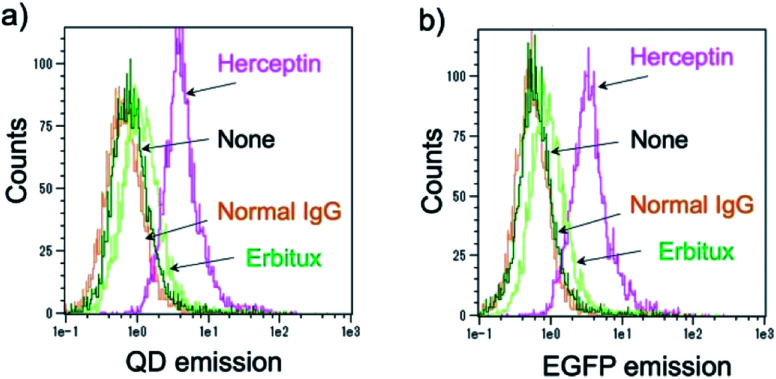
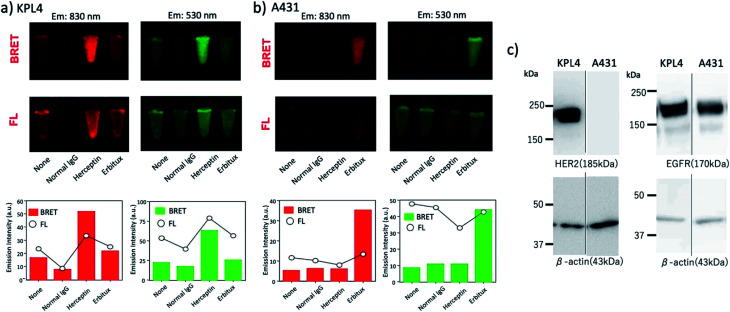
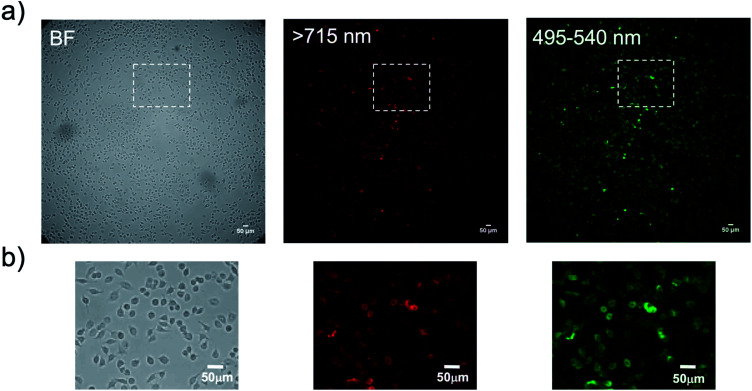
Owing to its high sensitivity, bioluminescence imaging is an important tool for biosensing and bioimaging in life sciences. Compared to fluorescence imaging, bioluminescence imaging has a superior advantage that the background signals resulting from autofluorescence are almost zero. In addition, bioluminescence imaging can permit long-term observation of living cells because external excitation is not needed, leading to no photobleaching and photocytotoxicity. Although bioluminescence imaging has such superior properties over fluorescence imaging, observation wavelengths in bioluminescence imaging are mostly limited to the visible region. Here we present bioluminescence resonance energy transfer (BRET) based dual-colour (visible/near-infrared) molecular imaging using a quantum dot (QD) and luciferase protein conjugate. This bioluminescent probe is designed to emit green and near-infrared luminescence from enhanced green fluorescent protein (EGFP) and CdSeTe/CdS (core/shell) QDs, where EGFP-Renilla luciferase (RLuc) fused proteins are conjugated to the QDs. Since the EGFP-RLuc fused protein contains an immunoglobulin binding domain (GB1) of protein G, it is possible to prepare a variety of molecular imaging probes functionalized with antibodies (IgG). We show that the BRET-based QD probe can be used for highly sensitive dual-colour (visible/near-infrared) bioluminescence molecular imaging of membrane receptors in cancer cells.


Conflict of interest statement

There are no conflicts to declare.

Figures

Fig. 1
Fig. 1. Schematic representation for EGFP–RLuc fused proteins and their conjugates with QDs (CdSeTe/CdS): (a) His–RLuc–EGFP–GB1 (73.6 kDa), (b) RLuc–His–EGFP–GB1 (72.6 kDa), (c) His–EGFP–RLuc–GB1 (73.6 kDa, (d) QD–His–RLuc–EGFP–GB1, (e) QD–RLuc–His–EGFP–GB1, and (f) QD–His–EGFP–RLuc–GB1. (g) Representative structure of a BRET-based dual-colour molecular imaging probe. The probe consists of a NIR-emitting QD, fused protein (His-EGFP–RLuc–GB1), and monoclonal antibodies. BRET is expected to occur from CTZ to EGFP and to QD, leading to visible and NIR dual-colour bioluminescence emission.
Fig. 2
Fig. 2. (a) Schematic representation for the conjugation of a CdSeTe/CdS QD to His–RLuc–GB1 and RLuc–GB1 protein. (b) Agarose gel electrophoresis for the QD (1), the mixture of QD and His–RLuc–GB1 (2), and the mixture of QDs and RLuc–GB1 (3). The molar ratio of QD/fused protein was 0.1. The image shows NIR fluorescence detected at the wavelength of 830 ± 20 nm.
Fig. 3
Fig. 3. (a) Bioluminescence spectrum (blue line) of CTZ catalyzed by His–RLuc–GB1, and absorption (red dotted line) and emission spectrum (red solid line) of CdSeTe/CdS QDs in PBS. (b) Bioluminescence spectra for the mixture of QD and RLuc–GB1 protein (QD/RLuc–GB1), and the mixture of QD and His–RLuc–GB1 protein (QD/His–RLuc–GB1) in the presence of CTZ. The molar ratio of QD/fused protein was 0.1.
Fig. 4
Fig. 4. (a) Absorption (Ab: black dotted line) and fluorescence (FL: green dotted line) spectrum of His–EGFP–GB1 protein. A blue solid line shows bioluminescence (BL) of CTZ catalyzed by His–RLuc–GB1. (b–d) Bioluminescence spectra (red line) for His–RLuc–EGFP–GB1, RLuc–His–EGFP–GB1, and His–EGFP–RLuc–GB1. Blue and green dotted lines show the spectral contribution from CTZ and EGFP, respectively.
Fig. 5
Fig. 5. (a)–(c) Agarose gel electrophoresis for the mixtures of His–RLuc–EGFP–GB1 and QD, RLuc–His–EGFP–GB1 and QD, and His–EGFP–RLuc–GB1 and QD. The molar ratios of fused protein/QD are described in the images. The gel images were obtained by the NIR fluorescence of QDs at 830 nm. (d)–(f) Bioluminescence spectra of QD conjugates with His–RLuc–EGFP–GB1, RLuc–His–EGFP–GB1, and His–EGFP–RLuc–GB1 in the presence of CTZ. The molecular ratios of fused protein/QD were 14.Blue and green dotted lines show the spectral contribution from CTZ and EGFP, respectively.
Fig. 6
Fig. 6. (a) Fluorescence autocorrelation curves for QDs, the mixture of QDs and His–EGFP–RLuc–GB1, and the mixture of QDs, His–EGFP–RLuc–GB1 and antibody (Ab) in PBS. (b) Diffusion time of QDs (1), the mixture of QDs and His–EGFP–RLuc–GB1 (2), and the mixture of QDs, His–EGFP–RLuc–GB1 and Ab (3). The values of diffusion time were obtained by using a single-component diffusion model.
Fig. 7
Fig. 7. Flow cytometric analysis of KPL-4 cells treated with QD–His–EGFP–RLuc–GB1 (none), normal human IgG and QD–His–EGFP–RLuc–GB1 (normal IgG), Herceptin and QD–His–EGFP–RLuc–GB1 (Herceptin), Erbitux and QD–His–EGFP–RLuc–GB1 (Erbitux). Fluorescence signals were detected at >750 nm for QD emission (a) and at 525 nm for EGFP emission (b).
Fig. 8
Fig. 8. (a) BRET and fluorescence (FL) images for the pellets of (a) KPL-4 cell (∼106 cells) and (b) A431 cell (∼106 cells) treated with QD–His–EGFP–RLuc–GB1 (none), normal human IgG/QD–His–EGFP–RLuc–GB1 (normal IgG), Herceptin/QD–His–EGFP–RLuc–GB1 (Herceptin), and Erbitux/QD–His–EGFP–RLuc–GB1 (Erbitux). The lower graphs show the emission intensity of BRET and FL for the above images. BRET and FL images were taken at 830 ± 20 nm and 530 ± 20 nm, respectively. Exposure time was 10 min both for BRET and FL imaging. (c) Western blotting analysis for the expression level of HER2 and EGFR in KPL-4 and A431 cells.
Fig. 9
Fig. 9. (a) Bright field (BF) and bioluminescence images of KLP-4 cells treated with Herceptin and His–EGFP–RLuc–GB1 conjugated QDs. (b) Magnification images for the square regions in the above images. Bioluminescence images are taken at the wavelength of >715 nm for QD emission and 495–540 nm for EGFP emission. Exposure time for the bioluminescence imaging was set to 3 min.

Similar articles

Cited by

References

    1. Dhawan A. P. D'Alessandro B. Fu X. IEEE Rev. Biomed. Eng. 2010;3:69–92. - PubMed
    1. Ozawa T. Yoshimura H. Kim S. Anal. Chem. 2013;85:590–609. doi: 10.1021/ac3031724. - DOI - PubMed
    1. Ntziachristos V. Annu. Rev. Biomed. Eng. 2006;8:1–33. doi: 10.1146/annurev.bioeng.8.061505.095831. - DOI - PubMed
    1. Badr C. E. Tannous B. A. Trends Biotechnol. 2011;29:624–633. doi: 10.1016/j.tibtech.2011.06.010. - DOI - PMC - PubMed
    1. Monici M. Biotechnol. Annu. Rev. 2005;11:227–256. - PubMed