

Data-driven analysis of the impact of COVID-19 on Madrid's public transport during each phase of the pandemic
- PMID: 35530724
- PMCID: PMC9057950
- DOI: 10.1016/j.cities.2022.103723
Data-driven analysis of the impact of COVID-19 on Madrid's public transport during each phase of the pandemic
Abstract
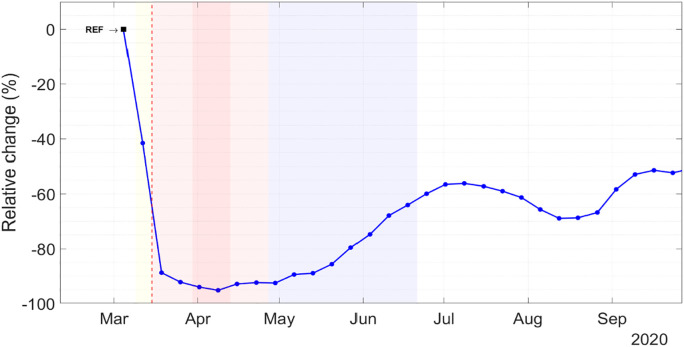
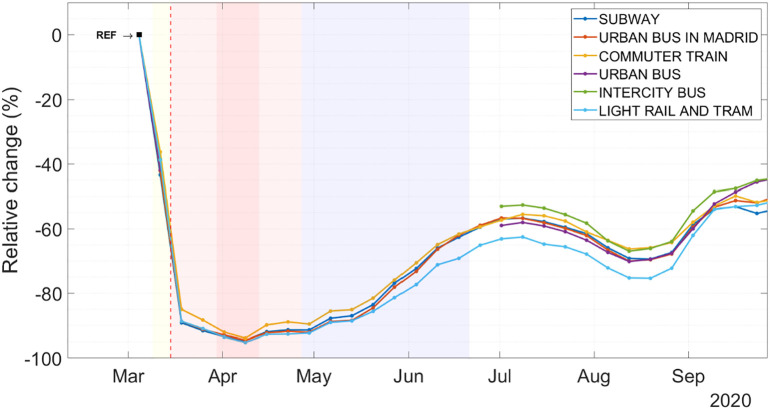
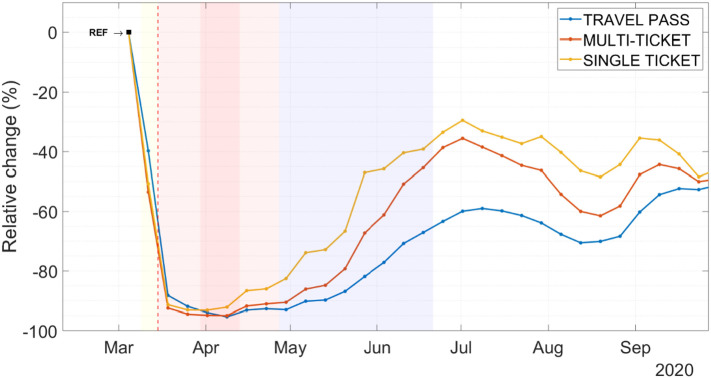
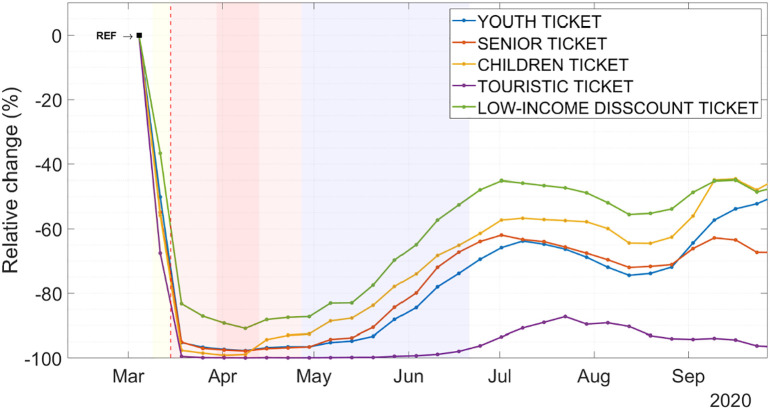
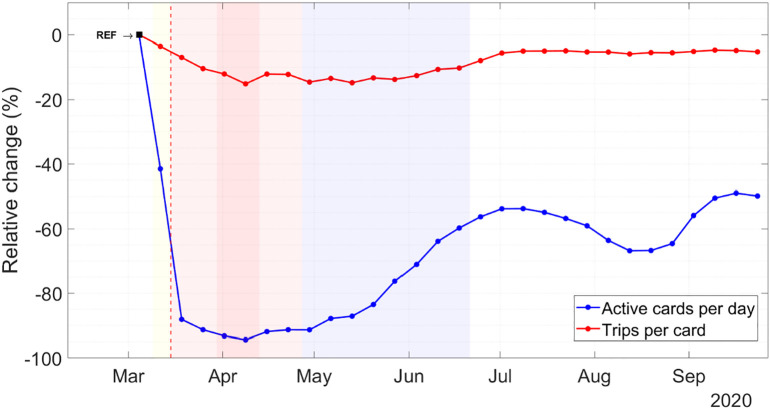
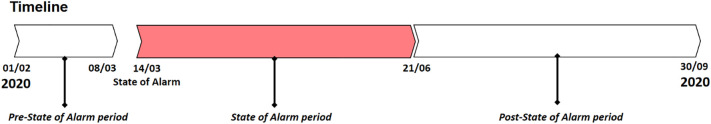
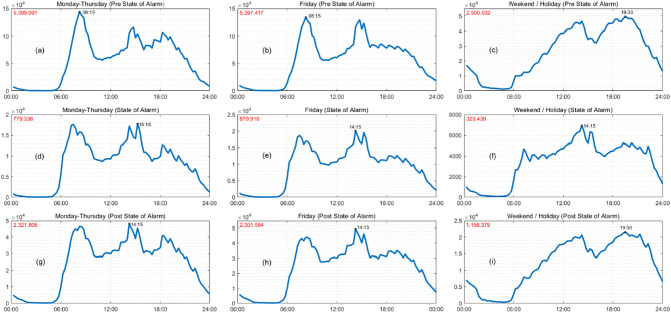
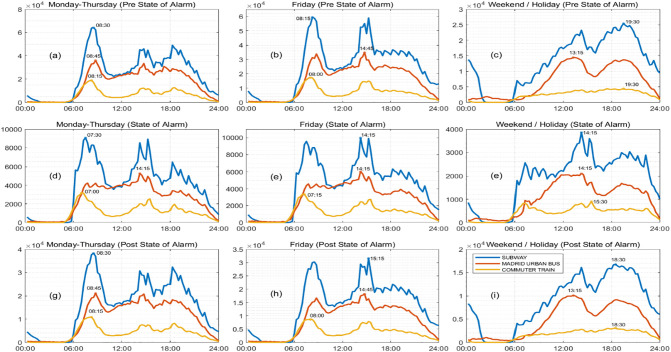
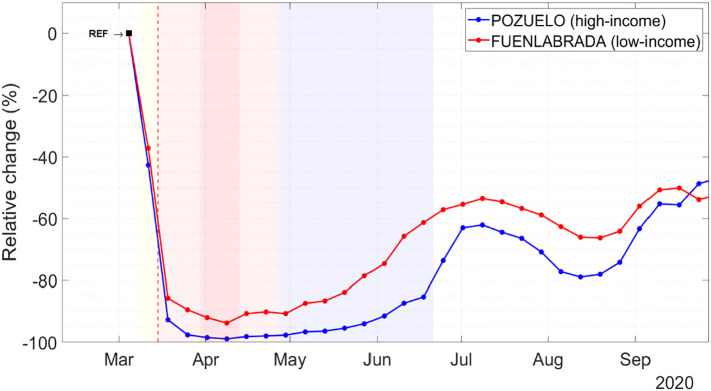
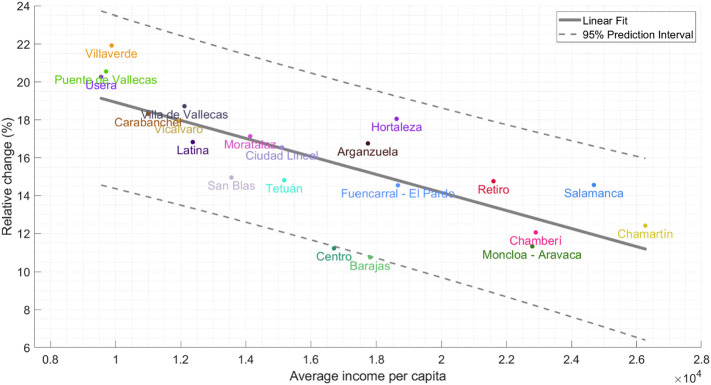
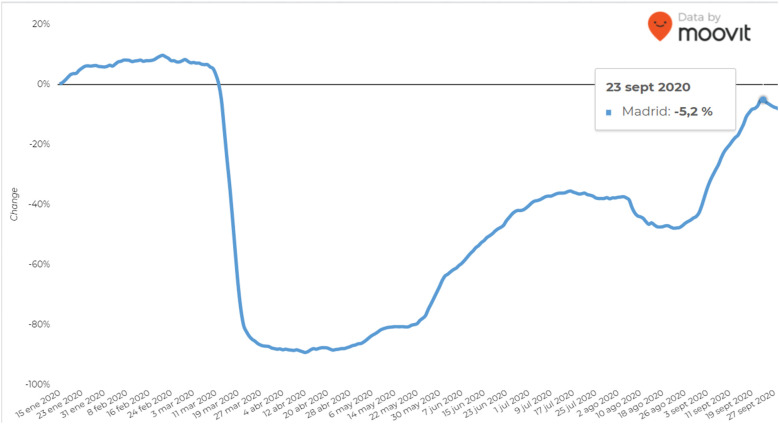
COVID-19 has become a major global issue with large social-economic and health impacts, which led to important changes in people's behavior. One of these changes affected the way people use public transport. In this work we present a data-driven analysis of the impact of COVID-19 on public transport demand in the Community of Madrid, Spain, using data from ticket validations between February and September 2020. This period of time covers all stages of pandemic in Spain, including de-escalation phases. We find that ridership has dramatically decreased by 95% at the pandemic peak, recovering very slowly and reaching only half its pre-pandemic levels at the end of September. We analyze results for different transport modes, ticket types, and groups of users. Our work corroborates that low-income groups are the most reliant on public transportation, thus observing significantly lower decreases in their ridership during pandemic. This paper also shows different average daily patterns of public transit demand during each phase of the pandemic in Madrid. All these findings provide relevant information for transit agencies to design responses to an emergence situation like this pandemic, contributing to extend the global knowledge about COVID-19 impact on transport comparing results with other cities worldwide.
Keywords: COVID-19; Madrid; Public transport; Ridership; Ticket validations.
© 2022 The Authors.
Conflict of interest statement
The authors declare that they have no known competing financial interests or personal relationships that could have appeared to influence the work reported in this paper.
Figures
Similar articles
-
Impacts of COVID-19 on public transport ridership in Sweden: Analysis of ticket validations, sales and passenger counts.Transp Res Interdiscip Perspect. 2020 Nov;8:100242. doi: 10.1016/j.trip.2020.100242. Epub 2020 Oct 20. Transp Res Interdiscip Perspect. 2020. PMID: 34173478 Free PMC article.
-
Characterization of COVID-19's Impact on Mobility and Short-Term Prediction of Public Transport Demand in a Mid-Size City in Spain.Sensors (Basel). 2021 Sep 30;21(19):6574. doi: 10.3390/s21196574. Sensors (Basel). 2021. PMID: 34640894 Free PMC article.
-
Impact of COVID-19 on Public Transit Accessibility and Ridership.Transp Res Rec. 2023 Apr;2677(4):531-546. doi: 10.1177/03611981231160531. Epub 2023 Apr 15. Transp Res Rec. 2023. PMID: 38602901 Free PMC article.
-
The impact of COVID-19 and related containment measures on Bangkok's public transport ridership.Transp Res Interdiscip Perspect. 2023 Jan;17:100737. doi: 10.1016/j.trip.2022.100737. Epub 2022 Dec 5. Transp Res Interdiscip Perspect. 2023. PMID: 36504757 Free PMC article.
-
A multiple mediation analysis to untangle the impacts of COVID-19 on nationwide bus ridership in the United States.Transp Res Part A Policy Pract. 2023 Jul;173:103718. doi: 10.1016/j.tra.2023.103718. Epub 2023 May 18. Transp Res Part A Policy Pract. 2023. PMID: 37234751 Free PMC article.
Cited by
-
Systematic literature review on impacts of COVID-19 pandemic and corresponding measures on mobility.Transportation (Amst). 2023 Apr 25:1-55. doi: 10.1007/s11116-023-10392-2. Online ahead of print. Transportation (Amst). 2023. PMID: 37363373 Free PMC article.
-
The impact of the COVID-19 pandemic on China's economic structure: An input-output approach.Struct Chang Econ Dyn. 2022 Dec;63:181-195. doi: 10.1016/j.strueco.2022.09.014. Epub 2022 Sep 30. Struct Chang Econ Dyn. 2022. PMID: 36212988 Free PMC article.
-
Factors affecting public transport performance due to the COVID-19 outbreak: A worldwide analysis.Cities. 2023 Mar;134:104206. doi: 10.1016/j.cities.2023.104206. Epub 2023 Jan 16. Cities. 2023. PMID: 36683673 Free PMC article.
-
Will transit recover? A retrospective study of nationwide ridership in the United States during the COVID-19 pandemic.J Public Trans. 2023;25:100046. doi: 10.1016/j.jpubtr.2023.100046. Epub 2023 Jun 24. J Public Trans. 2023. PMID: 37389199 Free PMC article.
-
Evaluating the effectiveness of lockdowns and restrictions during SARS-CoV-2 variant waves in the Canadian province of Nova Scotia.Front Public Health. 2023 Apr 27;11:1142602. doi: 10.3389/fpubh.2023.1142602. eCollection 2023. Front Public Health. 2023. PMID: 37181684 Free PMC article.
References
-
- Ahangari S., Chavis C., Jeihani M. MedRxiv; 2020. Public transit ridership analysis durint COVID-19 pandemic. - DOI
-
- Aloi A., Alonso B., Benavente J., Cordera R., Echániz E., González F., Ladisa C., Lezama-Romanelli R., López-Parra Á., Mazzei V., et al. Effects of the COVID-19 lockdown on urban mobility: Empirical evidence from the City of Santander (Spain) Sustainability. 2020;12(9):3870.
-
- Apple Apple mobility trends. 2020. https://www.apple.com/covid19/mobility
-
- Arellana J., Márquez L., Cantillo V. COVID-19 outbreak in Colombia: An analysis of its impacts on transport systems. Journal of Advanced Transportation. 2020;2020
LinkOut - more resources
Full Text Sources