. 2019 Oct 9;9(55):32184-32196.
doi: 10.1039/c9ra05880j. eCollection 2019 Oct 7.

The role of surface copper content on biofilm formation by drinking water bacteria

Affiliations

The role of surface copper content on biofilm formation by drinking water bacteria

I B Gomes et al. RSC Adv. .

Abstract

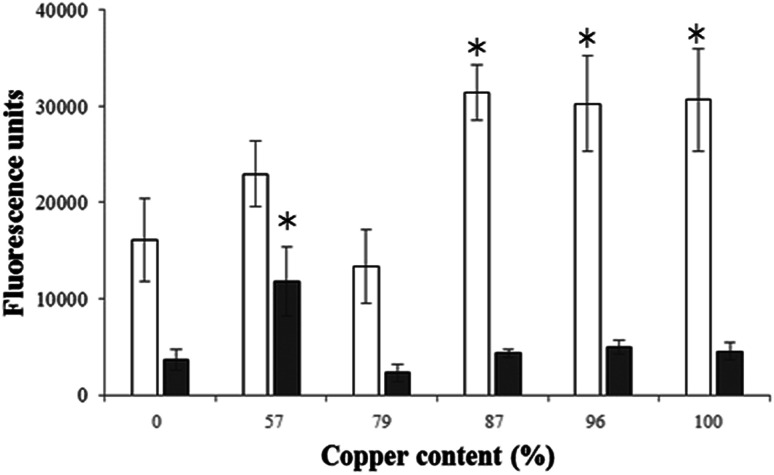
Copper pipes are conventionally used to supply tap water. Their role in biofilm prevention remains to be understood. This study evaluates the ability of selected surface materials with different copper contents (0, 57, 79, 87, 96, 100% of copper) to control biofilm formation and regrowth. Further experiments were performed to assess copper leaching and corrosion under conditions mimicking real plumbing systems. Acinetobacter calcoaceticus and Stenotrophomonas maltophilia isolated from a drinking water distribution system were used as model bacteria. All the copper materials showed positive results on the control of single and dual species biofilms presenting high reductions of bacterial culturability > 4 log CFU per cm2. The antimicrobial action of the selected materials seem not to be related to copper leaching or to the formation of reactive oxygen species. However, bacterial-copper contact demonstrated damage to bacterial membranes. The alloy containing 96% copper was the most promising surface in reducing biofilm culturability and viability, and was the only surface able to avoid the regrowth of single species biofilms when in contact with high nutrient concentrations. The alloy with 87% copper was shown to be unsuitable for use in chlorinated systems due to the high copper leaching observed when exposed to free chlorine. The presence of viable but non-culturable bacteria was remarkable, particularly in dual species biofilms. The overall results provide novel data on the role of copper alloys for use under chlorinated and unchlorinated conditions. Copper alloys demonstrated comparable or even higher biofilm control effects than elemental copper surfaces.


Conflict of interest statement

Authors declare no conflict of interest.

Figures

Fig. 1
Fig. 1. Materials used for biofilm formation.
Fig. 2
Fig. 2. Log CFU per cm2 of biofilms formed on surfaces with different copper content (0, 57, 79, 87, 96 and 100% Cu) and the corresponding bulk phase culturability. (□) 24 h biofilms formed using STW, () 48 h biofilm formed using STW, (■) biofilm regrowth in the presence of high nutrient levels (R2A broth). Left figures (A–D) correspond to biofilm culturability. Right figures (E–H) correspond to bulk phase culturability. (*) Differences statistically significant (P < 0.05) in comparison to SS316 (0% of copper). A. calcoaceticus in single species biofilms (A), S. maltophilia in single species biofilms (B), A. calcoaceticus in dual species biofilms (C), S. maltophilia in dual species biofilms (D), A. calcoaceticus present in bulk phase from single species biofilms (E), S. maltophilia present in bulk phase from single species biofilms (F), A. calcoaceticus in bulk phase from dual species biofilms (G) and S. maltophilia in bulk phase from dual species biofilms (H).
Fig. 3
Fig. 3. Viability of 48 h old biofilms formed on surface materials with different copper content (0, 57, 79, 87, 96 and 100% Cu). Images from fluorescence microscopy using a LEICA DM LB2 epifluorescence microscope connected to a Leica DFC300 FX camera (Leica Microsystems Ltd, Heerbrugg). Magnification of ×1000, scale bar of 10 μm. Bacteria were stained with using Live/Dead Baclight® kit. Red stained bacteria correspond to non-viable bacteria (with membrane damaged) and green stained bacteria correspond to viable bacteria (without membrane damaged). Images demonstrate a decrease in green stained bacteria on copper materials for all the biofilms tested and in comparison to the biofilms formed on SS316. The total numbers of A. calcoaceticus decreased on the copper materials in comparison to SS316. The total numbers of S. maltophilia was not remarkably influenced by the type of copper material, even if a decrease in viability (green stained bacteria) was observed for biofilms formed on 57 and 100% copper materials.
Fig. 4
Fig. 4. Viability (log cells per cm2) of 48 h biofilms formed on surface materials with different copper content (0, 57, 79, 87, 96 and 100% Cu). (□) Viable cells (VC), () viable but non-culturable (VBNC) bacteria, (■) total cells (TC). Left figures (A and B) correspond to single species biofilm viability. Right figures (C and D) correspond to dual species biofilm viability. (*) Differences statistically significant (P < 0.05) in comparison with SS316 (0% copper).
Fig. 5
Fig. 5. Reactive oxygen species (ROS) formation in A. calcoaceticus () and S. maltophilia (□) from biofilms formed on the surface materials with different copper contents. (*) Differences statistically significant (P < 0.05) in comparison with SS316 (0% copper).
Fig. 6
Fig. 6. Corrosion rate of copper materials in STW (A) and in STW with 1 mg L−1 of free chlorine (B) for 182 days. (●) 57% copper alloy; (*) 79% copper alloy, (■) 87% copper allot; (○) 96% copper alloy; (▲) elemental copper (100% copper). The assay was performed with three replicates.
Fig. 7
Fig. 7. Copper leaching to STW in the absence (A) and presence of 1 mg L−1 of free chlorine (B) for 182 days. (●) 57% copper alloy; (*) 79% copper alloy, (■) 87% copper alloy; (○) 96% copper alloy, (▲) elemental copper (100% copper). () Maximum copper concentration in DW as recommended by WHO/EU Directive 98/83/EC (2 mg L−1). () Maximum copper concentration in DW as recommended by EPA Standard (1.3 mg L−1). The detection limit of the analytical method used was 0.3 mg L−1. The assay was performed with three replicates.

Similar articles

Cited by

References

    1. NRC, Drinking water distribution systems: Assessing and reducing risks, N.R.C., Washington, DC, 2006
    1. Critchley M. M. Cromar N. J. McClure N. Fallowfield H. J. Water Sci. Technol.: Water Supply. 2002;2:81–87.
    1. Simões L. C. Simões M. RSC Adv. 2013;3:2520–2533. doi: 10.1039/C2RA22243D. - DOI
    1. Stalter D. O′Malley E. von Gunten U. Escher B. I. Water Res. 2016;91:19–30. doi: 10.1016/j.watres.2015.12.047. - DOI - PubMed
    1. Plewa M. J. Simmons J. E. Richardson S. D. Wagner E. D. Environ. Mol. Mutagen. 2010;51:871–878. doi: 10.1002/em.20585. - DOI - PubMed