. 2019 Oct 9;9(55):32034-32046.
doi: 10.1039/c9ra06706j. eCollection 2019 Oct 7.

Computational fluid dynamics simulation as a tool for optimizing the hydrodynamic performance of membrane bioreactors

Affiliations

Computational fluid dynamics simulation as a tool for optimizing the hydrodynamic performance of membrane bioreactors

Yan Jin et al. RSC Adv. .

Abstract

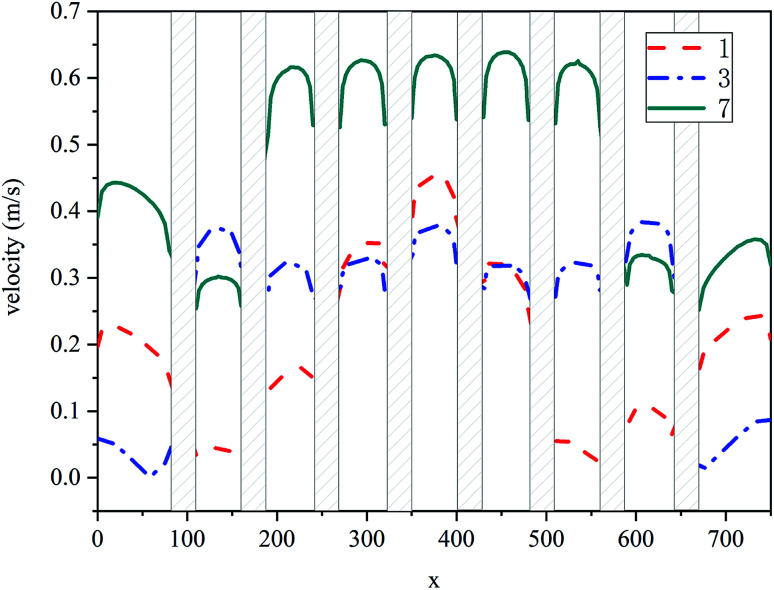
The hydrodynamic properties and shear stresses experienced by a membrane bioreactor (MBR) are directly related to its rate of membrane fouling. In this study, computational fluid dynamic models have been combined with cold model PIV experimental studies to optimize the performance properties of MBRs. The effects of membrane module height, number of aeration tubes and membrane spacing on liquid phase flow rates, gas holdup and shear stresses at the membrane surface have been investigated. It has been found that optimal MBRs experience the greatest shear forces on their surfaces at a distance of 250 mm from the aeration tube, around the 7 aeration tubes used to introduce gas and at the 40 mm spacings between the membrane sheets. Use of an aeration intensity of between 0.02 and 0.47 m3 min-1 generated shear stresses that were 50-85% higher than the original MBR for the same aeration intensity, thus affording optimal membrane performance that minimizes membrane fouling.


Conflict of interest statement

There are no conflicts to declare.

Figures

Fig. 1
Fig. 1. Effect of grid independence on simulation results for different mesh sizes.
Fig. 2
Fig. 2. Schematic of the experimental setup that was modeled in this study.
Fig. 3
Fig. 3. Comparison of time-averaged velocities for different lines (generated using PIV techniques) with the mathematical model for aeration and liquid level heights of (a) 9 L min−1, 50 cm, (b) 3 L min−1, 46 cm, and (c) 15 L min−1, 46 cm.
Fig. 4
Fig. 4. Schematic diagram of MBR and the streamline and velocity (color legend) of the liquid phase in the MBR.
Fig. 5
Fig. 5. Distribution of mean liquid phase velocities and gas volume fractions for y = 400 mm and x = 400 mm. (a) liquid phase velocities for y = 400 mm; (b) gas volume fractions for y = 400 mm; (c) liquid phase velocities for x = 400 mm; (d) gas volume fractions for x = 400 mm.
Fig. 6
Fig. 6. Distribution of mean liquid phase velocities and gas volume fractions at y = 400 mm planes for different membrane module heights: (a) 250 mm; (b) 350 mm; (c) 450 mm; (d) 550 mm; (e) 650 mm.
Fig. 7
Fig. 7. Distribution of mean liquid phase velocities and gas volume fractions at z = 1000 mm with different membrane module heights of: (a) 250 mm; (b) 350 mm; (c) 450 mm; (d) 550 mm; (e) 650 mm.
Fig. 8
Fig. 8. Shear stress on membrane surfaces for different membrane module heights.
Fig. 9
Fig. 9. Distribution of mean liquid phase velocities and gas volume fraction for different numbers of aerating tubes: (a) 1; (b) 3; (c) 7.
Fig. 10
Fig. 10. Mean liquid phase velocity distributions at y = 375 mm and z = 1000 mm for different numbers of aerating tubes.
Fig. 11
Fig. 11. Distribution of mean liquid phase velocities and gas volume fractions at z = 1000 mm for different numbers of aerator tubes: (a) 1; (b) 3; (c) 7.
Fig. 12
Fig. 12. Shear stress at membrane surfaces for different numbers of aerating tubes.
Fig. 13
Fig. 13. Distribution of mean liquid phase velocities and gas volume fractions for different membrane separation distances: (a) 30 cm, (b) 40 cm, (c) 50 cm, (d) 60 cm, (e) 70 cm, (f) 80 cm.
Fig. 14
Fig. 14. Shear stresses of membrane surfaces for different separation distances.
Fig. 15
Fig. 15. Comparison of the shear forces experienced by membrane systems for different gas flow rates.

References

    1. Melin T. Jefferson B. Bixio D. Thoeye C. De Wilde W. De Koning J. van der Graaf J. Wintgens T. Desalination. 2006;187:271–282. doi: 10.1016/j.desal.2005.04.086. - DOI
    1. Aslam M. Charfi A. Lesage G. Heran M. Kim J. Chem. Eng. J. 2017;307:897–913. doi: 10.1016/j.cej.2016.08.144. - DOI
    1. Drews A. J. Membr. Sci. 2010;363:1–28. doi: 10.1016/j.memsci.2010.06.046. - DOI
    1. Meng F. Chae S.-R. Drews A. Kraume M. Shin H. S. Yang F. Water Res. 2009;43:1489–1512. doi: 10.1016/j.watres.2008.12.044. - DOI - PubMed
    1. Kimura K. Yamato N. Yamamura H. Watanabe Y. Environ. Sci. Technol. 2005;39:6293–6299. doi: 10.1021/es0502425. - DOI - PubMed

LinkOut - more resources