

Assembly of gold nanoparticles using turnip yellow mosaic virus as an in-solution SERS sensor
- PMID: 35530810
- PMCID: PMC9072845
- DOI: 10.1039/c9ra08015e
Assembly of gold nanoparticles using turnip yellow mosaic virus as an in-solution SERS sensor
Abstract
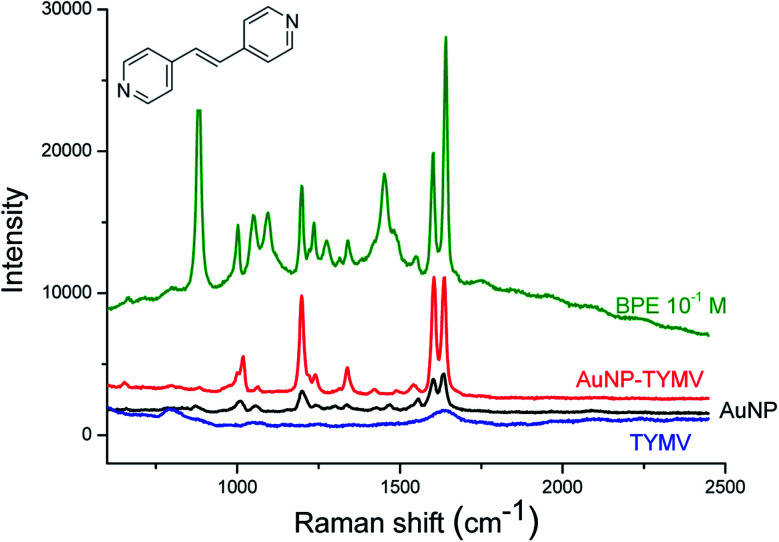
A common challenge in nanotechnology is the conception of materials with well-defined nanoscale structure. In recent years, virus capsids have been used as templates to create a network to organize 3D nano-objects, building thus new functional nanomaterials and then devices. In this work, we synthetized 3D gold nanoclusters and we used them as Surface Enhanced Raman Scattering (SERS) sensor substrates in solution. In practice, gold nanoparticles (AuNPs) were grafted on turnip yellow mosaic virus (TYMV) capsid, an icosahedral plant virus. Two strategies were considered to covalently bind AuNPs of different sizes (5, 10 and 20 nm) to TYMV. After purification by agarose electrophoresis and digestion by agarase, the resulting nano-bio-hybrid AuNP-TYVM was characterized by different tools. Typically, dynamic light scattering (DLS) confirmed the grafting through the hydrodynamic size increase by comparing AuNPs alone to AuNP-TYMV (up to 33, 50 and 68 nm for 5, 10 and 20 nm sized AuNPs, respectively) or capsids alone (28 nm). Transmission electronic microscopy (TEM) observations revealed that AuNPs were arranged with 5-fold symmetry, in agreement with their grafting around icosahedral capsids. Moreover, UV-vis absorption spectroscopy showed a red-shift of the plasmon absorption band on the grafted AuNP spectrum (530 nm) compared to that of the non-grafted one (520 nm). Finally, by recording in solution the Raman spectra of a dissolved probe molecule, namely 1,2-bis(4-pyridyl)ethane (BPE), in the presence of AuNP-TYVM and bare AuNPs or capsids, a net enhancement of the Raman signal was observed when BPE is adsorbed on AuNP-TYVM. The analytical enhancement factor (AEF) value of AuNP-TYMV is 5 times higher than that of AuNPs. These results revealed that AuNPs organized around virus capsid are able to serve as in-solution SERS-substrates, which is very interesting for the conception of ultrasensitive sensors in biological media.
This journal is © The Royal Society of Chemistry.
Conflict of interest statement
The authors declare no conflict of interest.
Figures


Similar articles
-
Gold and Iron Oxide Nanoparticle Assemblies on Turnip Yellow Mosaic Virus for In-Solution Photothermal Experiments.Nanomaterials (Basel). 2023 Sep 7;13(18):2509. doi: 10.3390/nano13182509. Nanomaterials (Basel). 2023. PMID: 37764538 Free PMC article.
-
Characterization of Labeled Gold Nanoparticles for Surface-Enhanced Raman Scattering.Molecules. 2022 Jan 28;27(3):892. doi: 10.3390/molecules27030892. Molecules. 2022. PMID: 35164155 Free PMC article.
-
Gold nanoparticle-paper as a three-dimensional surface enhanced Raman scattering substrate.Langmuir. 2012 Jun 12;28(23):8782-90. doi: 10.1021/la3012734. Epub 2012 Jun 1. Langmuir. 2012. PMID: 22594710
-
Glucosamine to gold nanoparticles binding studied using Raman spectroscopy.Spectrochim Acta A Mol Biomol Spectrosc. 2022 Jan 5;264:120326. doi: 10.1016/j.saa.2021.120326. Epub 2021 Aug 27. Spectrochim Acta A Mol Biomol Spectrosc. 2022. PMID: 34481250
-
Polyacrylonitrile as a versatile matrix for gold nanoparticle-based SERS substrates.Nanoscale Adv. 2024 Jan 18;6(4):1065-1073. doi: 10.1039/d3na01112g. eCollection 2024 Feb 13. Nanoscale Adv. 2024. PMID: 38356638 Free PMC article.
Cited by
-
Gold and Iron Oxide Nanoparticle Assemblies on Turnip Yellow Mosaic Virus for In-Solution Photothermal Experiments.Nanomaterials (Basel). 2023 Sep 7;13(18):2509. doi: 10.3390/nano13182509. Nanomaterials (Basel). 2023. PMID: 37764538 Free PMC article.
-
Exploiting Micrometer-Scale Replication of Fungal Biotemplates for Multifunctional Uses in Electrochemistry and SERS Substrates.ACS Omega. 2024 Oct 17;9(43):43385-43394. doi: 10.1021/acsomega.4c03431. eCollection 2024 Oct 29. ACS Omega. 2024. PMID: 39493990 Free PMC article.
References
LinkOut - more resources
Full Text Sources
Miscellaneous