

Comparison of magnetic resonance imaging and computed tomography in the diagnosis of acute pancreatitis: a systematic review and meta-analysis of diagnostic test accuracy studies
- PMID: 35530935
- PMCID: PMC9073804
- DOI: 10.21037/atm-22-812
Comparison of magnetic resonance imaging and computed tomography in the diagnosis of acute pancreatitis: a systematic review and meta-analysis of diagnostic test accuracy studies
Abstract
Background: Acute pancreatitis (AP) is characterized by acute onset, rapid development, and poor prognosis. Timely diagnosis and identification of the cause are the key to formulating the clinical program and improving the prognosis. There were several studies on this topic but the results varied. This study systematically evaluated and analyzed reports on the comparison of magnetic resonance imaging (MRI) and computed tomography (CT) for the diagnosis of AP in recent years, providing evidence for clinical diagnosis and treatment.
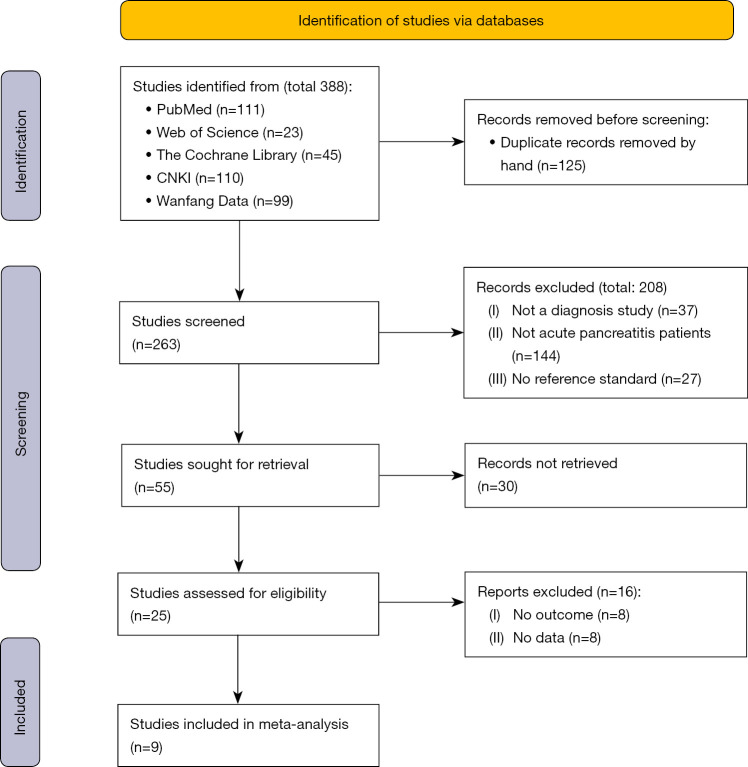
Methods: The databases of PubMed, Web of Science, The Cochrane Library, China National Knowledge Infrastructure (CNKI), and Wanfang Data were searched for literature on MRI and CT in the diagnosis of AP. After evaluating the articles and extracting the data, the software RevMan 5.4 and Stata 16.0 were used for meta-analysis.
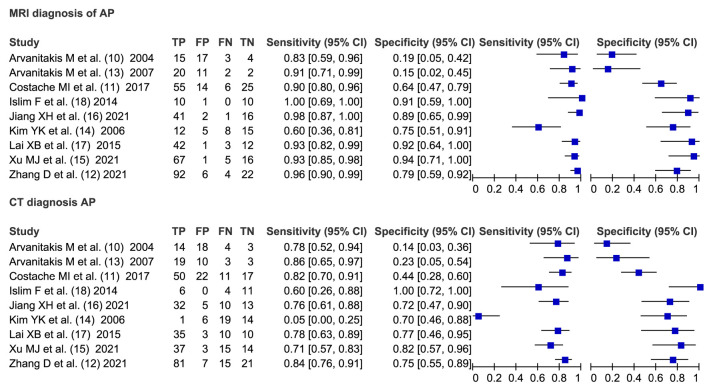
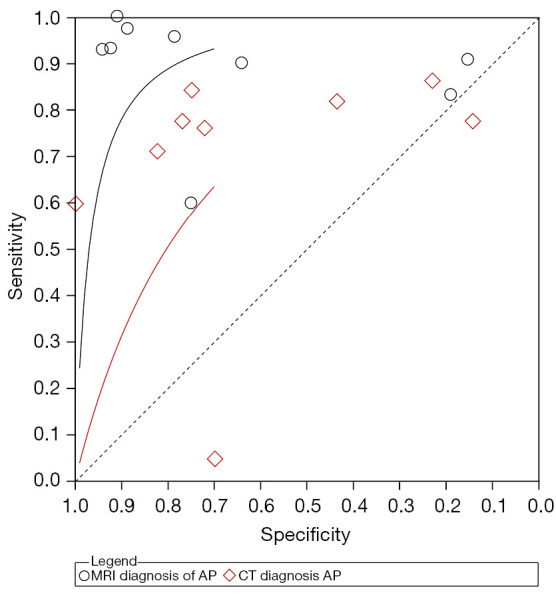
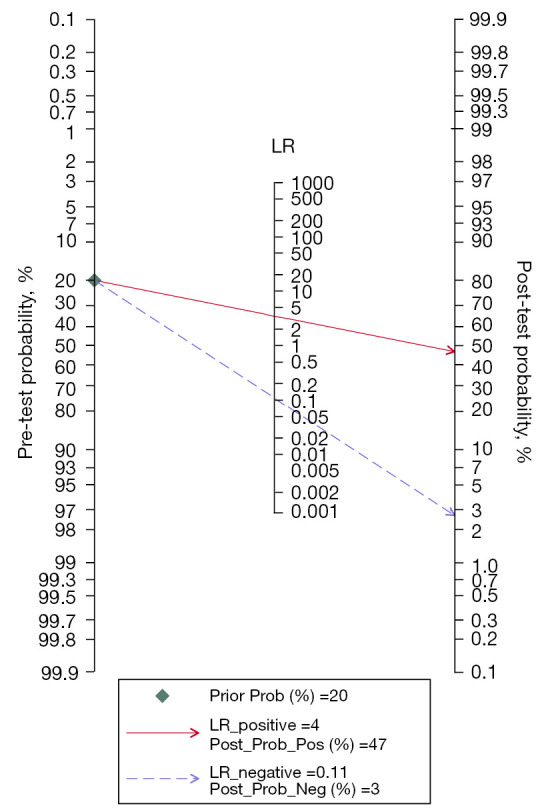
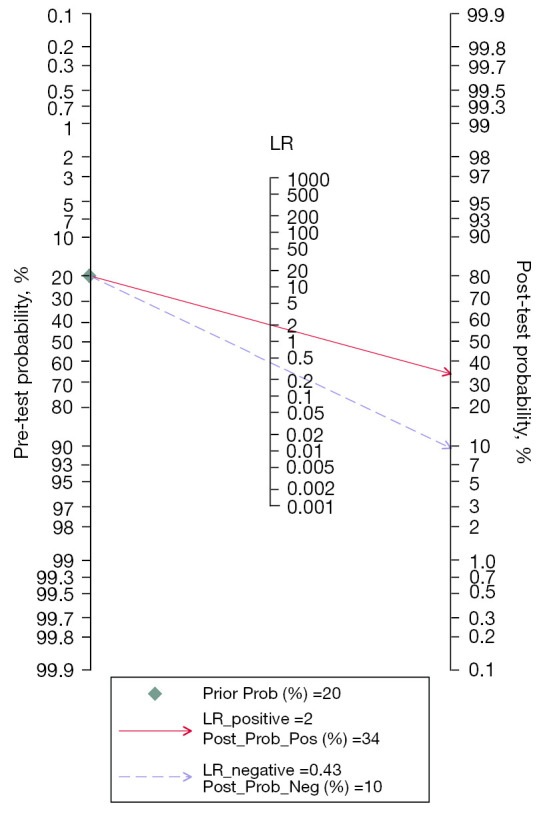
Results: A total of 9 articles were included in the selection, with a total of 566 patients having undergone diagnosis. Meta-analysis showed that for MRI, the diagnostic sensitivity was 92%, 95% confidence interval (CI): 85% to 96%; specificity was 74%, 95% CI: 50% to 89%; positive likelihood ratio was 3.5, 95% CI: 1.6 to 8.0; negative likelihood ratio was 0.11, 95% CI: 0.05 to 0.24; diagnostic odds ratio (DOR) was 32, 95% CI: 7 to 136; and the area under the curve (AUC) value was 0.93, 95% CI: 0.90 to 0.95. For CT, the diagnostic sensitivity was 73%, 95% CI: 55% to 85%; specificity was 64%, 95% CI: 42% to 82%; positive likelihood ratio was 2.0, 95% CI: 1.1 to 3.6; negative likelihood ratio was 0.43, 95% CI: 0.24 to 0.76; DOR was 5, 95% CI: 2 to 14; and the AUC value was 0.74, 95% CI: 0.70 to 0.78. The AUC value of MRI was significantly greater than CT (Z=3.684, P=0.023).
Discussion: In the diagnosis of AP, MRI is more sensitive, specific, and accurate than CT, and can be used as the first choice for the diagnosis of AP.
Keywords: Magnetic resonance imaging (MRI); acute pancreatitis (AP); computed tomography (CT); meta-analysis.
2022 Annals of Translational Medicine. All rights reserved.
Conflict of interest statement
Conflicts of Interest: All authors have completed the ICMJE uniform disclosure form (available at https://atm.amegroups.com/article/view/10.21037/atm-22-812/coif). The authors have no conflicts of interest to declare.
Figures
Similar articles
-
Computed tomography vs liver stiffness measurement and magnetic resonance imaging in evaluating esophageal varices in cirrhotic patients: A systematic review and meta-analysis.World J Gastroenterol. 2020 May 14;26(18):2247-2267. doi: 10.3748/wjg.v26.i18.2247. World J Gastroenterol. 2020. PMID: 32476790 Free PMC article.
-
Systematic review and meta-analysis of imaging differential diagnosis of benign and malignant ovarian tumors.Gland Surg. 2022 Feb;11(2):330-340. doi: 10.21037/gs-21-889. Gland Surg. 2022. PMID: 35284306 Free PMC article.
-
Meta-analysis of the Value of Cardiac Nuclear Magnetic Resonance in the Diagnosis of Viral Myocarditis.J Coll Physicians Surg Pak. 2020 Dec;30(12):1326-1331. doi: 10.29271/jcpsp.2020.12.1326. J Coll Physicians Surg Pak. 2020. PMID: 33397062
-
Diagnostic value of combined detection of CA72-4, CA19-9, and carcinoembryonic antigen comparing to CA72-4 alone in gastric cancer: a systematic review and meta-analysis.Transl Cancer Res. 2022 Apr;11(4):848-856. doi: 10.21037/tcr-22-537. Transl Cancer Res. 2022. PMID: 35571668 Free PMC article.
-
MRI versus CT for the detection of pulmonary nodules: A meta-analysis.Medicine (Baltimore). 2021 Oct 22;100(42):e27270. doi: 10.1097/MD.0000000000027270. Medicine (Baltimore). 2021. PMID: 34678861 Free PMC article. Review.
Cited by
-
A new logistic regression model for early prediction of severity of acute pancreatitis using magnetic resonance imaging and Acute Physiology and Chronic Health Evaluation II scoring systems.Quant Imaging Med Surg. 2022 Sep;12(9):4424-4434. doi: 10.21037/qims-22-158. Quant Imaging Med Surg. 2022. PMID: 36060575 Free PMC article.
-
Turkish Society of Gastroenterology: Pancreas Working Group, Acute Pancreatitis Committee Consensus Report.Turk J Gastroenterol. 2024 Nov 11;35(Suppl 1):S1-S44. doi: 10.5152/tjg.2024.24392. Turk J Gastroenterol. 2024. PMID: 39599919 Free PMC article. Review.
-
Current Progress in the CT- and MRI-Based Detection and Evaluation of Acute Pancreatitis Complications.Med Sci Monit. 2025 Aug 10;31:e948306. doi: 10.12659/MSM.948306. Med Sci Monit. 2025. PMID: 40783779 Free PMC article. Review.
-
MRI and CT radiomics for the diagnosis of acute pancreatitis.Eur J Radiol Open. 2025 Jan 31;14:100636. doi: 10.1016/j.ejro.2025.100636. eCollection 2025 Jun. Eur J Radiol Open. 2025. PMID: 39967811 Free PMC article.
-
Acute pancreatitis: A review of diagnosis, severity prediction and prognosis assessment from imaging technology, scoring system and artificial intelligence.World J Gastroenterol. 2023 Oct 7;29(37):5268-5291. doi: 10.3748/wjg.v29.i37.5268. World J Gastroenterol. 2023. PMID: 37899784 Free PMC article. Review.
References
LinkOut - more resources
Full Text Sources