. 2022 Apr 21:10:867175.
doi: 10.3389/fcell.2022.867175. eCollection 2022.

Condensed Mitochondria Assemble Into the Acrosomal Matrix During Spermiogenesis

Affiliations

Condensed Mitochondria Assemble Into the Acrosomal Matrix During Spermiogenesis

Mindong Ren et al. Front Cell Dev Biol. .

Abstract

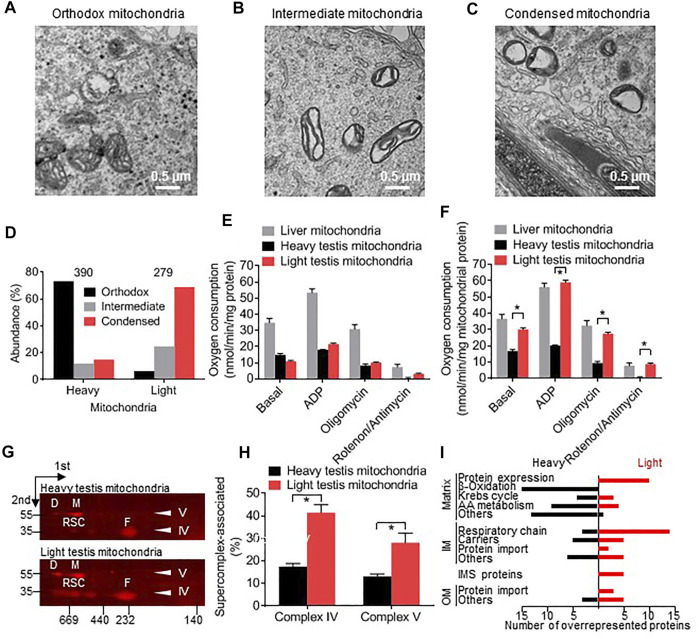
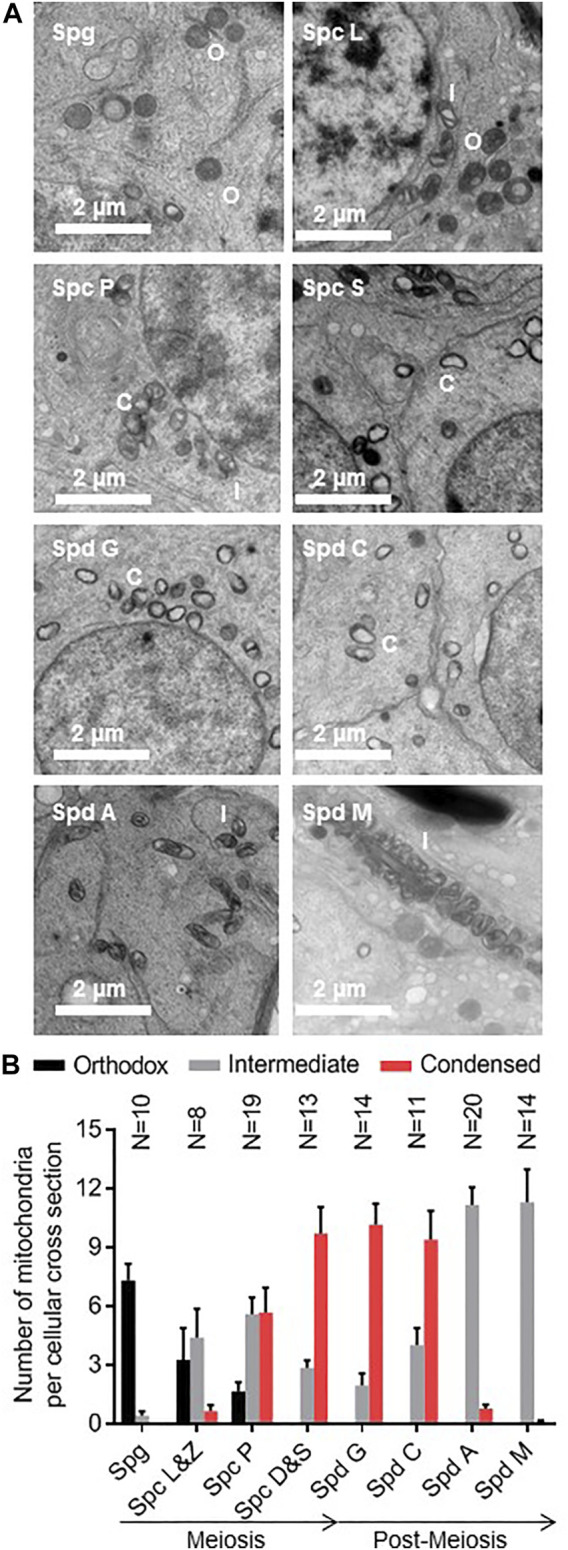
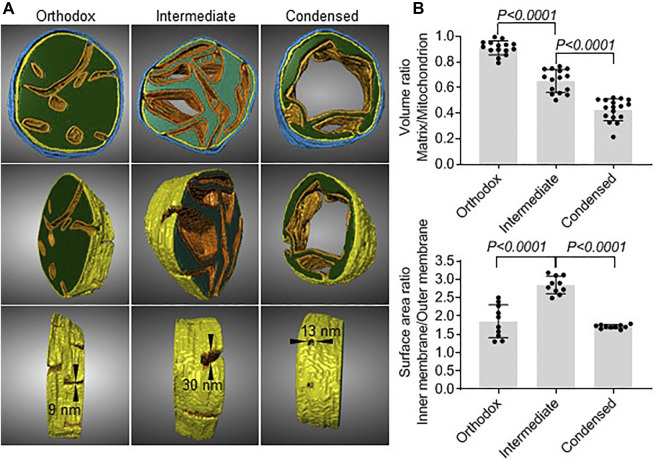
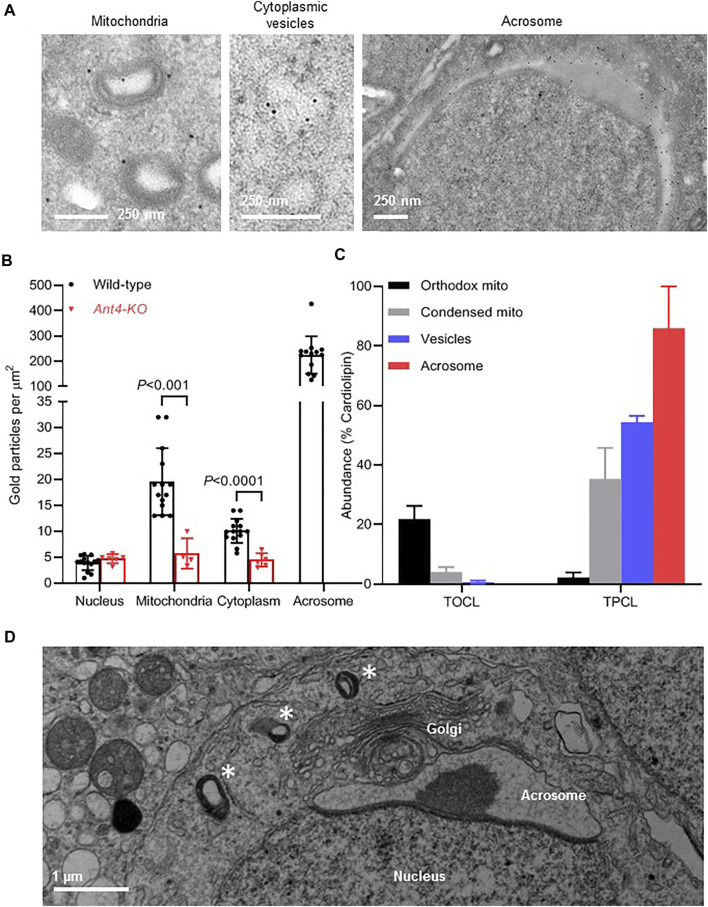
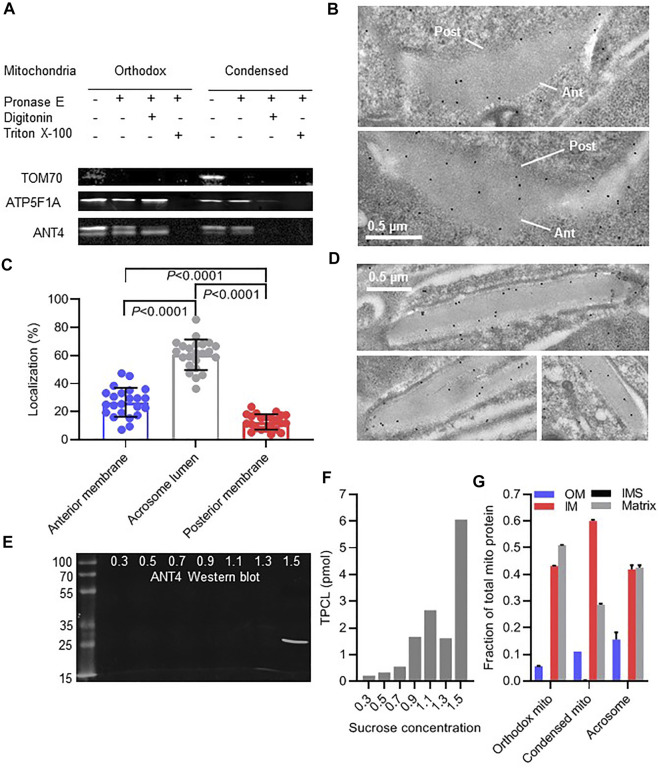
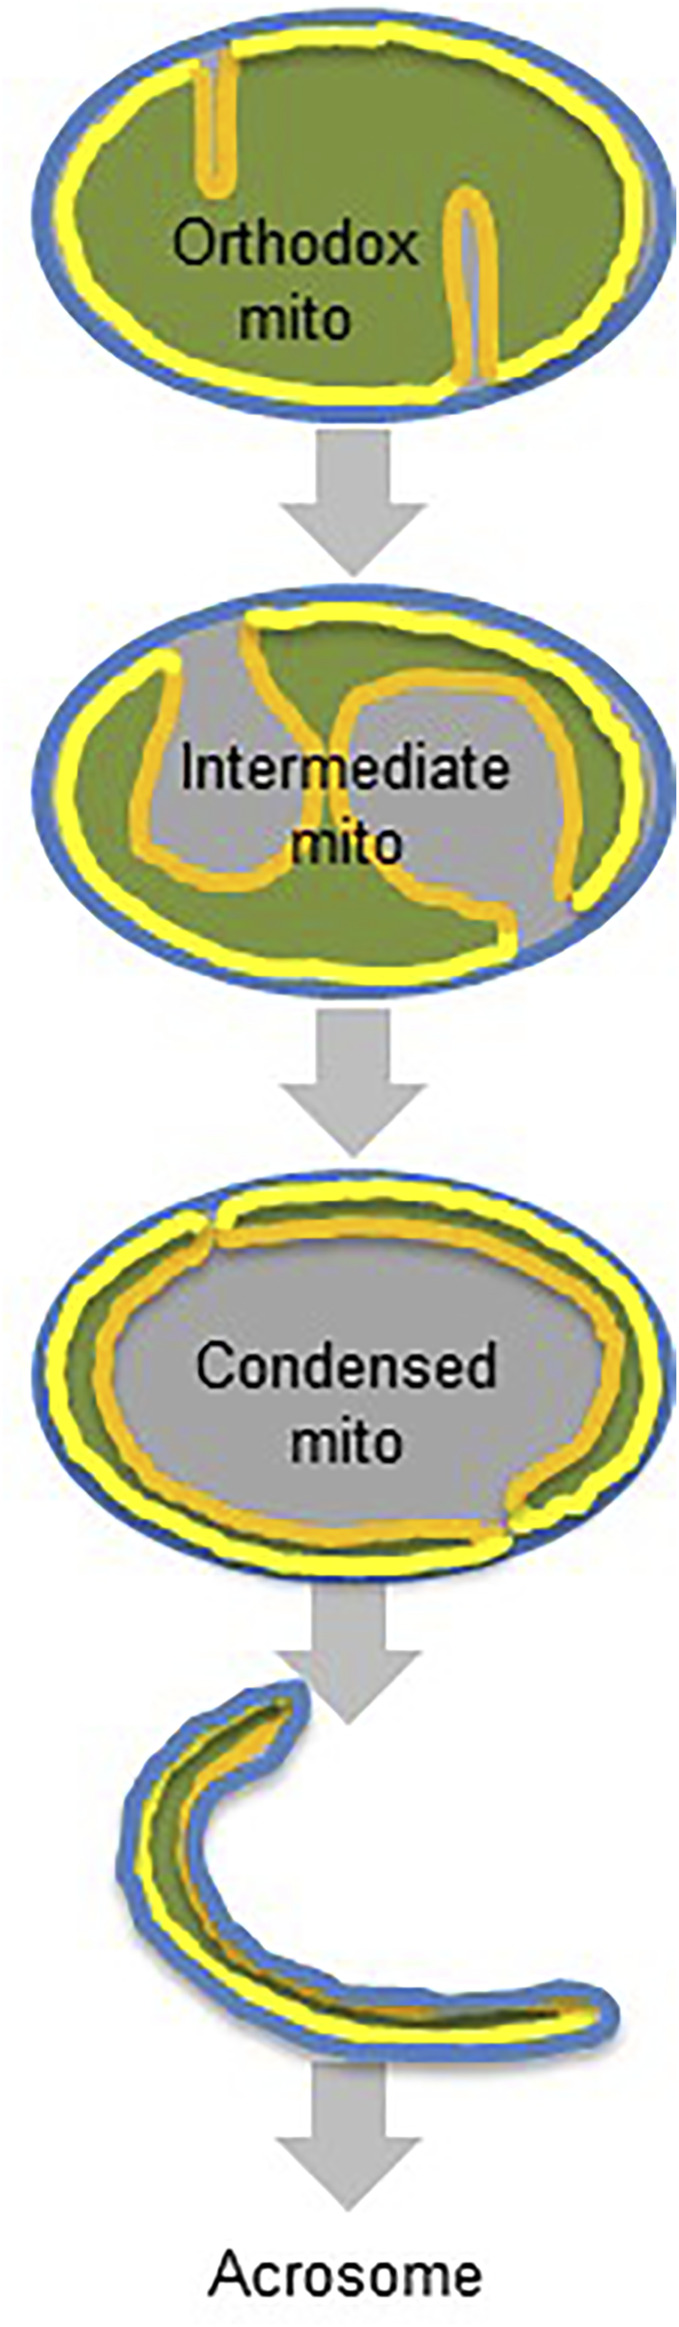
Mammalian spermatogenesis is associated with the transient appearance of condensed mitochondria, a singularity of germ cells with unknown function. Using proteomic analysis, respirometry, and electron microscopy with tomography, we studied the development of condensed mitochondria. Condensed mitochondria arose from orthodox mitochondria during meiosis by progressive contraction of the matrix space, which was accompanied by an initial expansion and a subsequent reduction of the surface area of the inner membrane. Compared to orthodox mitochondria, condensed mitochondria respired more actively, had a higher concentration of respiratory enzymes and supercomplexes, and contained more proteins involved in protein import and expression. After the completion of meiosis, the abundance of condensed mitochondria declined, which coincided with the onset of the biogenesis of acrosomes. Immuno-electron microscopy and the analysis of sub-cellular fractions suggested that condensed mitochondria or their fragments were translocated into the lumen of the acrosome. Thus, it seems condensed mitochondria are formed from orthodox mitochondria by extensive transformations in order to support the formation of the acrosomal matrix.

Keywords: acrosome; cristae; mitochondria; spermatogenesis; spermiogenensis.


Conflict of interest statement

The authors declare that the research was conducted in the absence of any commercial or financial relationships that could be construed as a potential conflict of interest.

Figures

FIGURE 1
FIGURE 1
Testicular germ cells contain distinct types of mitochondria. (A–C): Electron micrographs of mouse testis sections show orthodox, intermediate, and condensed mitochondria. (D): Mitochondria were isolated from mouse testis, separated into heavy and light fractions by Percoll density gradient centrifugation, and affinity-purified with Tom22 antibodies. The proportion of orthodox, intermediate, and condensed mitochondria was determined by electron microscopy. The number of analyzed mitochondria is given on top. Heavy and light fractions contain different proportions of orthodox, intermediate, and condensed mitochondria (p < 0.0001, Chi-square test). (E,F): Respiratory activities of heavy and light testis mitochondria and liver mitochondria were measured in the presence and absence of ADP and different inhibitors. Oxygen consumption was calculated per total protein (E) or per mitochondrial protein (F). The contribution of mitochondrial protein to total protein was determined by quantitative mass spectrometry. Data are means ± SEM (N = 6). Asterisks indicate a significant difference between heavy and light testis mitochondria (p < 0.000001, t-test). (G,H): The abundance of supercomplexes was measured in heavy and light testis mitochondria by 2D-BN-PAGE. Blots were probed with antibodies to MTCOI of complex IV revealing free complex IV (F) and respiratory supercomplexes (RSC). Blots were probed with antibodies to ATP5F1A of complex V revealing the monomer (M) and the dimer (D) of complex V. Molecular weight markers of 35 and 55 kDa are shown. Bar graphs show means ± SEM (N = 3). Asterisks indicate a significant difference between heavy and light testis mitochondria (p < 0.05, t-test). (I): The protein composition of heavy and light mitochondria was compared by tandem-mass-tag proteomics. The black columns show the number of proteins that are relatively overrepresented in heavy mitochondria (heavy/light tag ratio >1 standard deviation above the mean). The red columns show the number of proteins that are relatively overrepresented in light mitochondria (heavy/light tag ratio >1 standard deviation below the mean). IM, inner membrane; OM, outer membrane.
FIGURE 2
FIGURE 2
Condensed mitochondria appear transiently in meiotic and early post-meiotic germ cells. (A): Testis sections of mice were analyzed by electron microscopy. The developmental stage of individual seminiferous tubules was determined and individual germ cells were identified by their distance to the basal membrane and by their morphology. Orthodox (O), intermediate (I), and condensed (C) mitochondria were identified. (B): The number of orthodox, intermediate, and condensed mitochondria is shown for spermatogonia (Spg), leptotene (Spc L), zygotene (Spc Z), pachytene (Spc P), diplotene (Spc D), and secondary (Spc S) spermatocytes and spermatids in the Golgi phase (Spd G), cap phase phase (Spd C), acrosome phase (Spd A), and maturation phase (Spd M). Bar graphs represent means ± SEM. The number of analyzed cells (N) is given for each cell type.
FIGURE 3
FIGURE 3
Matrix volume and inner membrane surface area change during the transformation from orthodox to condensed mitochondria. (A): Electron tomograms were created of 200 nm sections of mouse testis. Image segmentation of individual mitochondria was performed manually. The matrix is shown in green, the cristae membranes are shown in orange, the inner boundary membrane is shown in yellow, and the outer membrane is shown in blue. Cristae junctions and their dimensions are indicated. (B): Quantitative electron microscopy was performed in mouse testis sections. Each data point represents the measurement in an individual mitochondrion. Bar graphs show means ± SD. Means were compared by t-test.
FIGURE 4
FIGURE 4
ANT4 is translocated from mitochondria to the acrosome via cytoplasmic vesicles. (A): The localization of ANT4 was determined by immune electron microscopy in a round cap phase spermatid of wild-type mice. (B): The density of Ant4 was determined in different cellular compartments by immune electron microscopy of testicular germ cells of wild-type and Ant4-KO mice. Each data point represents a separate electron micrograph. The bar graph shows means ± SD. Wild-type and Ant4-KO were compared by t-test. (C): Orthodox and condensed mitochondria and cytoplasmic vesicles were purified from testis homogenate. Acrosomal material was collected from the extracellular medium of mouse sperm after the acrosome reaction. The composition of cardiolipin was analyzed by mass spectrometry in order to determine the relative abundance of TOCL and TPCL. Data are means ± SEM (N = 3). (D): The electron micrograph shows a round spermatid with condensed mitochondria (asterisks) in the vicinity of the Golgi-acrosome-nucleus complex.
FIGURE 5
FIGURE 5
Mitochondria are incorporated into the acrosome lumen. (A): Isolated mitochondria from mouse testis were treated with pronase E and digitonin or Triton X-100 followed by Western blot analysis of TOM70, ATP5F1A, and ANT4. (B): The localization of ANT4 was visualized in acrosomes of round mouse spermatids by immune electron microscopy. The anterior (Ant) and posterior (Post) membranes of the acrosome are marked. (C): The distribution of ANT4 within acrosomes of round spermatids was determined by quantitative immune electron microscopy. Data are means ± SD of 23 cells. Groups were compared by t-test. (D): The localization of ANT4 was visualized in acrosomes of elongated mouse spermatids by immune electron microscopy. (E,F): Acrosomal material was released from mouse sperm and resolved on a sucrose density gradient (0.3–1.5 M sucrose). Fractions were analyzed by Western blotting (ANT4) or by mass spectrometry (TPCL). (G): Orthodox and condensed mitochondria were purified from testis homogenate. Acrosomal material was collected from the extracellular medium of mouse sperm after inducing the acrosome reaction and further purified by sucrose density gradient centrifugation. The relative abundance of mitochondrial proteins was determined by mass spectrometry. Data show the relative abundance of the outer membrane (OM), the intermembrane space (IMS), the inner membrane (IM), and the matrix, determined by summing the signal intensities of individual proteins of these compartments. Data are means ± SEM (N = 3).
FIGURE 6
FIGURE 6
Proposed transformation of germ cell mitochondria. Orthodox mitochondria transform into intermediate mitochondria by crista membrane expansion and matrix contraction. Intermediate mitochondria transform into condensed mitochondria by contraction of the matrix and the crista membrane. Condensed mitochondria are incorporated into the acrosome lumen. Color code: blue, outer membrane; grey, intermembrane space; yellow, inner boundary membrane; orange, crista membrane; green, matrix.

Similar articles

Cited by

References

    1. Amaral A., Lourenço B., Marques M., Ramalho-Santos J. (2013). Mitochondria Functionality and Sperm Quality. Reproduction 146, R163–R174. 10.1530/rep-13-0178 - DOI - PubMed
    1. Berruti G., Paiardi C. (2011). Acrosome Biogenesis. Spermatogenesis 1, 95–98. 10.4161/spmg.1.2.16820 - DOI - PMC - PubMed
    1. Berruti G., Ripolone M., Ceriani M. (2010). USP8, a Regulator of Endosomal Sorting, Is Involved in Mouse Acrosome Biogenesis through Interaction with the Spermatid ESCRT-0 Complex and Microtubules1. Biol. Reprod. 82, 930–939. 10.1095/biolreprod.109.081679 - DOI - PubMed
    1. Berruti G. (2016). Towards Defining an 'origin'-The Case for the Mammalian Acrosome. Semin. Cel Develop. Biol. 59, 46–53. 10.1016/j.semcdb.2016.01.013 - DOI - PubMed
    1. Bligh E. G., Dyer W. J. (1959). A Rapid Method of Total Lipid Extraction and Purification. Can. J. Biochem. Physiol. 37, 911–917. 10.1139/o59-099 - DOI - PubMed

LinkOut - more resources