

Quantification of Motility in Bacillus subtilis at Temperatures Up to 84°C Using a Submersible Volumetric Microscope and Automated Tracking
- PMID: 35531296
- PMCID: PMC9069135
- DOI: 10.3389/fmicb.2022.836808
Quantification of Motility in Bacillus subtilis at Temperatures Up to 84°C Using a Submersible Volumetric Microscope and Automated Tracking
Abstract
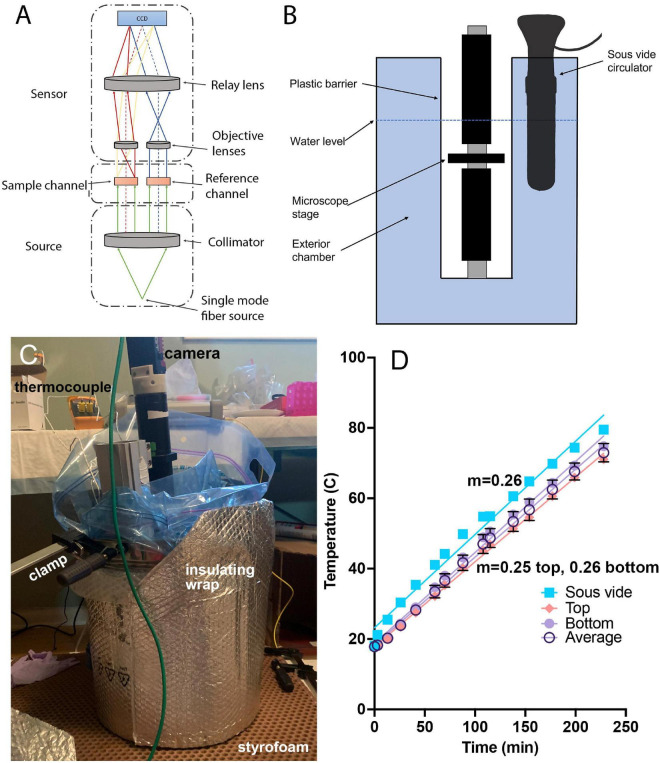
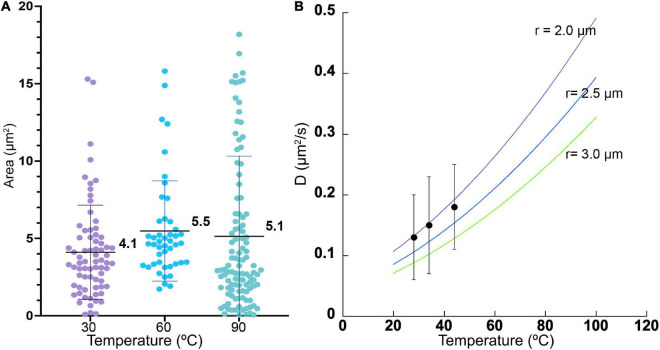
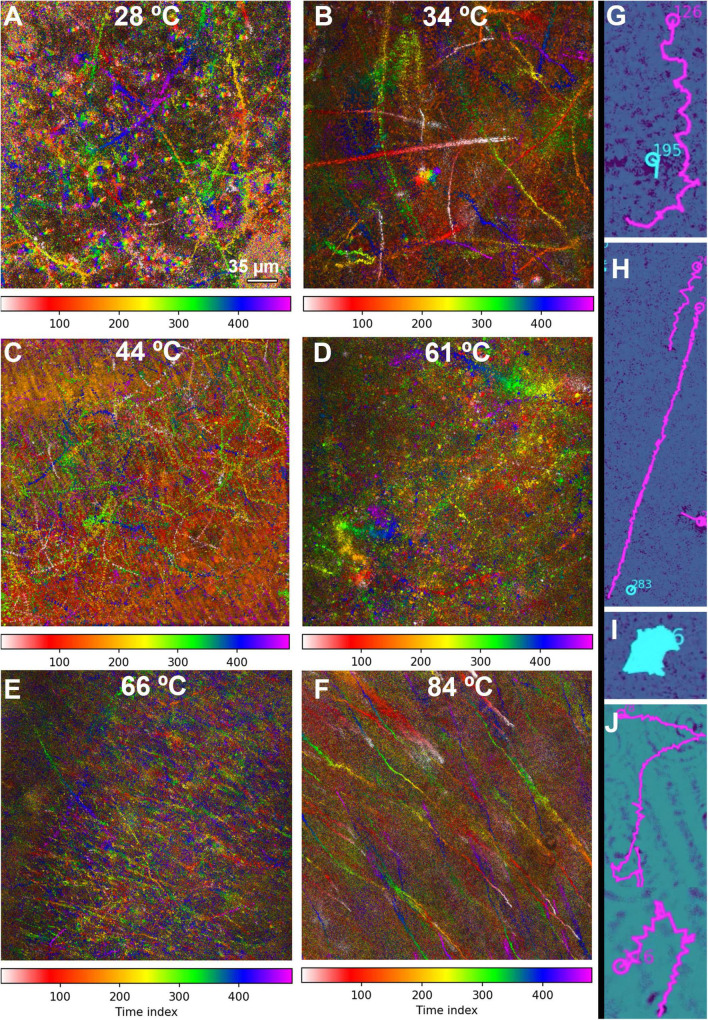
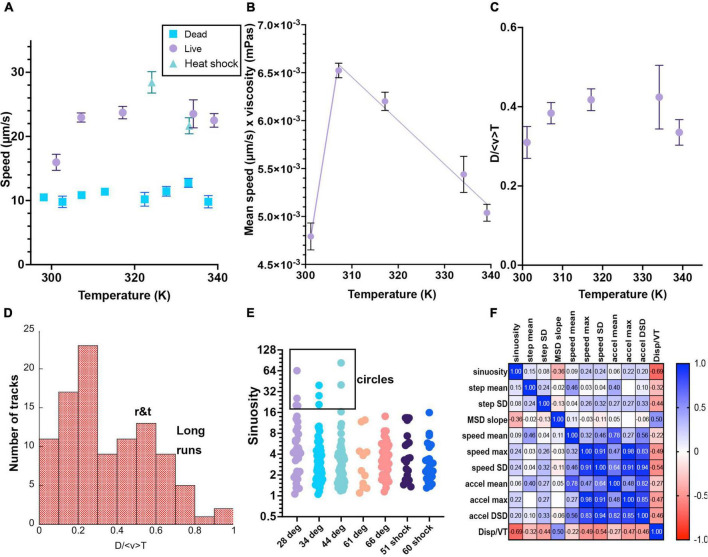
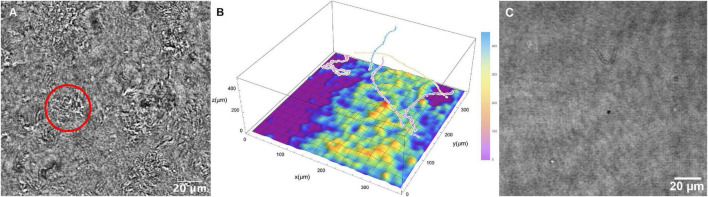
We describe a system for high-temperature investigations of bacterial motility using a digital holographic microscope completely submerged in heated water. Temperatures above 90°C could be achieved, with a constant 5°C offset between the sample temperature and the surrounding water bath. Using this system, we observed active motility in Bacillus subtilis up to 66°C. As temperatures rose, most cells became immobilized on the surface, but a fraction of cells remained highly motile at distances of >100 μm above the surface. Suspended non-motile cells showed Brownian motion that scaled consistently with temperature and viscosity. A novel open-source automated tracking package was used to obtain 2D tracks of motile cells and quantify motility parameters, showing that swimming speed increased with temperature until ∼40°C, then plateaued. These findings are consistent with the observed heterogeneity of B. subtilis populations, and represent the highest reported temperature for swimming in this species. This technique is a simple, low-cost method for quantifying motility at high temperatures and could be useful for investigation of many different cell types, including thermophilic archaea.
Keywords: tracking; Bacillus subtilis; bacterial motility; heat shock; holographic microscopy; temperature effects; thermophile.
Copyright © 2022 Dubay, Johnston, Wronkiewicz, Lee, Lindensmith and Nadeau.
Conflict of interest statement
The authors declare that the research was conducted in the absence of any commercial or financial relationships that could be construed as a potential conflict of interest.
Figures

Similar articles
-
Influences of thermal acclimation and acute temperature change on the motility of epithelial wound-healing cells (keratocytes) of tropical, temperate and Antarctic fish.J Exp Biol. 2003 Dec;206(Pt 24):4539-51. doi: 10.1242/jeb.00706. J Exp Biol. 2003. PMID: 14610038
-
Influence of the sporulation temperature upon the heat resistance of Bacillus subtilis.J Appl Bacteriol. 1992 Sep;73(3):251-6. doi: 10.1111/j.1365-2672.1992.tb02985.x. J Appl Bacteriol. 1992. PMID: 1399918
-
Na(+) and flagella-dependent swimming of alkaliphilic Bacillus pseudofirmus OF4: a basis for poor motility at low pH and enhancement in viscous media in an "up-motile" variant.Arch Microbiol. 2007 Mar;187(3):239-47. doi: 10.1007/s00203-006-0192-7. Epub 2006 Dec 13. Arch Microbiol. 2007. PMID: 17165029
-
Recent advances in experimental design and data analysis to characterize prokaryotic motility.J Microbiol Methods. 2023 Jan;204:106658. doi: 10.1016/j.mimet.2022.106658. Epub 2022 Dec 15. J Microbiol Methods. 2023. PMID: 36529156 Review.
-
Anaerobic thermophiles.Life (Basel). 2014 Feb 26;4(1):77-104. doi: 10.3390/life4010077. Life (Basel). 2014. PMID: 25370030 Free PMC article. Review.
Cited by
-
Extant life detection using label-free video microscopy in analog aquatic environments.PLoS One. 2025 Mar 12;20(3):e0318239. doi: 10.1371/journal.pone.0318239. eCollection 2025. PLoS One. 2025. PMID: 40073001 Free PMC article.
-
MotGen: a closed-loop bacterial motility control framework using generative adversarial networks.Bioinformatics. 2024 Mar 29;40(4):btae170. doi: 10.1093/bioinformatics/btae170. Bioinformatics. 2024. PMID: 38552318 Free PMC article.
-
Morphogenesis and mechanical properties of Bacillus amyloliquefaciens biofilms: a comparative study of rough and smooth morphotypes.Curr Res Microb Sci. 2025 May 10;8:100403. doi: 10.1016/j.crmicr.2025.100403. eCollection 2025. Curr Res Microb Sci. 2025. PMID: 40487030 Free PMC article.
-
Synergistic phenotypic adaptations of motile purple sulphur bacteria Chromatium okenii during lake-to-laboratory domestication.PLoS One. 2024 Oct 22;19(10):e0310265. doi: 10.1371/journal.pone.0310265. eCollection 2024. PLoS One. 2024. PMID: 39436933 Free PMC article.
-
Degradable living plastics programmed by engineered spores.Nat Chem Biol. 2025 Jul;21(7):1006-1011. doi: 10.1038/s41589-024-01713-2. Epub 2024 Aug 21. Nat Chem Biol. 2025. PMID: 39169270
References
-
- Acres J., Nadeau J. (2021). 2D vs 3D tracking in bacterial motility analysis. AIMS Biophys. 8 385–399.
-
- Armstrong D. J., Nieminen T. A., Favre-Bulle I., Stilgoe A. B., Lenton I. C. D., Schembri M. A., et al. (2020). Optical force measurements illuminate dynamics of Escherichia coli in viscous media. Front. Phys. 8:575732. 10.3389/fphy.2020.575732 - DOI
-
- Breiman L. (2001). Random forests. Mach. Learn. 45 5–32. 10.1023/A:1010933404324 - DOI
Associated data
LinkOut - more resources
Full Text Sources
Molecular Biology Databases
Research Materials