. 2021 Dec;1(12):1107-1116.
doi: 10.1038/s43587-021-00142-3. Epub 2021 Dec 10.

Profiling senescent cells in human brains reveals neurons with CDKN2D/p19 and tau neuropathology

Affiliations

Profiling senescent cells in human brains reveals neurons with CDKN2D/p19 and tau neuropathology

Shiva Kazempour Dehkordi et al. Nat Aging. 2021 Dec.

Abstract

Senescent cells contribute to pathology and dysfunction in animal models1. Their sparse distribution and heterogenous phenotype have presented challenges for detecting them in human tissues. We developed a senescence eigengene approach to identify these rare cells within large, diverse populations of postmortem human brain cells. Eigengenes are useful when no single gene reliably captures a phenotype, like senescence; they also help to reduce noise, which is important in large transcriptomic datasets where subtle signals from low-expressing genes can be lost. Each of our eigengenes detected ~2% senescent cells from a population of ~140,000 single nuclei derived from 76 postmortem human brains with various levels of Alzheimer's disease (AD) pathology. More than 97% of the senescent cells were excitatory neurons and overlapped with tau-containing neurofibrillary tangles (NFTs). Cyclin dependent kinase inhibitor 2D (CDKN2D/p19) was predicted as the most significant contributor to the primary senescence eigengene. RNAscope and immunofluorescence confirmed its elevated expression in AD brain tissue whereby p19-expressing neurons had 1.8-fold larger nuclei and significantly more cells with lipofuscin than p19-negative neurons. These hallmark senescence phenotypes were further elevated in the presence of NFTs. Collectively, CDKN2D/p19-expressing neurons with NFTs represent a unique cellular population in human AD with a senescence phenotype. The eigengenes developed may be useful in future senescence profiling studies as they accurately identified senescent cells in snRNASeq datasets and predicted biomarkers for histological investigation.


Figures

Extended Data Fig. 1
Extended Data Fig. 1. Prominent senescent cell types in prefrontal cortex of the embryonic control.
Cell types and counts represented in the senescent cell population discovered in (A) CSP, (B) SIP and (C) SRP. The cutoff and statistical test definitions are the same as in Figure 1. Cell populations: astrocytes [Ast], blood cells [Blood], Cajal-Retzius cells [Cajal], endothelial cells [Endo], excitatory neurons [Ext], immune cells [Immune], inhibitory neuron [Inh], microglia [Micro], neural stem cells [NSC], and oligodendrocyte precursor cells [Oligo] were classified in the original publication.
Extended Data Fig. 2
Extended Data Fig. 2. Prominent senescent cell types in the dorsal lateral prefrontal cortex in Cohort 2.
Cell types and counts represented in the senescent cell population discovered in (A) CSP, (B) SIP and (C) SRP with n=57,857. The cutoff, statistical test and abbreviations definitions are the same as in Figure 1.
Extended Data Fig. 3
Extended Data Fig. 3. Overlap between senescent and NFT neurons.
Each vertical bar represents the number of neurons in Cohort 1 that express the eigengenes marked by green circles below the bar. Each row at the bottom corresponds to an eigengene, and the number of neurons expressing that eigengene is shown in the right end on each row. The probability distributions of multi-set intersections have been calculated and the significance was tested using a hypergeometric test. The scale bar at top right shows the level of significance for each intersection. The largest p-value is −232 in log10 scale, which corresponds to the intersection between SRP and CSP expressing cells.
Extended Data Fig. 4
Extended Data Fig. 4. Prominent senescent cell types using CellAge, GO and KEGG gene lists in Cohort 1.
Cell types and counts represented in the senescent cell population discovered in (A) CellAge, (B) GO and (C) KEGG. The cutoff, statistical test and abbreviations definitions are the same as in Figure 1.
Extended Data Fig. 5
Extended Data Fig. 5. Overlap between senescent cell populations.
Each vertical bar represents the number of senescent cells in Cohort 1 that express the senescence eigengenes, marked by green circles below the bar. Each row at the bottom corresponds to a senescence eigengene, and the number of senescent cells expressing that eigengene is shown at the end of each row. The probability distributions of multi-set intersections have been calculated and the significance was tested using a hypergeometric test. The scale bar at top right shows the level of significance for each intersection. The largest p-value is-260 in log10 scale corresponding to the intersection of SRP and CSP.
Extended Data Fig. 6
Extended Data Fig. 6. Excitatory neurons are the prominent senescent cell types based on CDKN2D in (A) Cohort 1 and (B) Cohort 2.
Cell types and counts represented in the senescent cell population using only CDKN2D. The cutoff, statistical tests and abbreviations definitions are the same as in Figure 1.
Extended Data Fig. 7
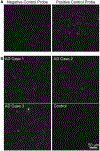
Extended Data Fig. 7. RNAscope reveals higher CDKN2D expression in postmortem brains from cases with AD than age-matched control brains.
A. CDKN2D negative and positive control probe signal. B. CDKN2D RNAscope on three separate AD cases (n=3) compared to a representative age-matched non-demented control (n=3) (refer to Supplementary Table 5 for case characteristics. Scale bar 50 μm.
Extended Data Fig. 8
Extended Data Fig. 8. CDKN2D RNAscope colocalized with neuronal marker, HuD.
Postmortem AD tissue was processed for RNAscope with CDKN2D (green) and co-labeled for total nuclei (DAPI, gray) and neurons (HuD, cyan)/ Merged image display strong overlap between CDKN2D and neurons, but not other cell types (i.e., blue and green co-localization with infrequent green co-localization in nuclei without HuD staining). Scale bar 10 μm. Representative images from postmortem human brains (n=3 control and n=3 AD cases).
Figure 1 ∣
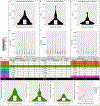
Figure 1 ∣. The prominent senescent cell type in the DL-PFC were excitatory neurons.
Eigengenes for each gene list (a, d, h) using n=70,634 cells in canonical senescence pathway (CSP); (b, e, i) senescence initiating pathway (SIP); and (c, f, j) senescence response pathway (SRP) were computed using principal component analyses. (a-c) The proportion of cells from each brain expressing the respective eigengene were plotted. (d-f) Cell types and (g) counts represented in the senescent cell population discovered in a-c. A one-sided hypergeometric test was used in order to report the significant cell types. All the p-values are adjusted using Bonferroni correction. (h-j) The ratio of senescent excitatory neurons that expressed the respective eigengenes to total neurons within each brain, n=48 brains. (k) Scatter plot for the ratio of senescent excitatory neurons to the total number of excitatory neurons in cohort 1 with n=48 brains. Each dot represents one brain. The size of the dots depicts the ratio in SRP. The senescence excitatory ratios of CSP highly correlated with SIP (Pearson correlation: 0.96) and SRP (0.90). Also, the SIP ratio was positively correlated with the SRP ratio (0.93). The line inside each box plot in a-c and h-j shows the median. The lower and upper hinges of box plots correspond to the first and the third quartiles, respectively. The whiskers extend from the bottom or the top of the box for at most 1.5 of the interquartile range (IQR), which is the distance between first and third quartiles. Samples not between the whiskers were considered outliers, which are shown with yellow (a-c) and black (h-j) dots. Cell populations: astrocytes [Ast], endothelial cells [End], excitatory neurons [Ex], inhibitory neuron [In], microglia [Mic], oligodendrocytes [Oli], oligodendrocyte precursor cells [Opc], and pericytes [Per]) were classified in the original publication.
Figure 2 ∣
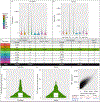
Figure 2 ∣. Neurofibrillary tangle eigengene expression significantly correlated with senescence expression.
(a) Eigengenes representing neurofibrillary tangle (NFT) expression were calculated from two separate datasets, Dunckley and (b) Garcia, respectively. Cell types (a, b) and counts (c) expressing each NFT eigengene were calculated and plotted using n=70,634 cells. A one-sided hypergeometric test was used in order to report the significant cell types. All the p-values are adjusted using Bonferroni correction. (d-e) The ratio of NFT-containing excitatory neurons to total neurons expressing each respective eigengene within each brain, n=48 brains. The line inside each box plot in d-e shows the median. The lower and upper hinges of box plots correspond to the first and the third quartiles, respectively. The whiskers extend from the bottom or the top of the box for at most 1.5 of the IQR. Any sample not between the whiskers is known as an outlier and is shown with a black dot. (f) Scatter plot for eigengene values for CSP genes on x axis versus Dunckley NFT marker genes on y axis. Each dot represents one neuron. Red line represents intercept, and the blue line shows the best linear fit. A linear regression model is fitted on NFT ~ Senescence with coefficient being equal to zero as the null hypothesis.
Figure 3 ∣
Figure 3 ∣. Senescent excitatory neurons contain NFTs and NFT-bearing neurons are senescent.
(a-c) Plots of total neuron counts, pink, against expression of the eigengene CSP, (b) SIP or (c) SRP. Cell densities of where the NFT-bearing neurons (green) lie within the plot (inset). (d-f) Plots of total neuron counts, pink, against expression of the NFTDunckley eigengene. Cell densities of where the CSP, (d) SRP or (e) SIP cell populations lie within the plot (inset). Larger plots are scaled by the number of cells and insets are scaled by cell density. Mean and standard deviation (sd) are calculated for the eigengene value of all neurons.
Figure 4 ∣
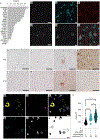
Figure 4 ∣. Upregulated CDKN2D and p19 deposition co-occur with tau neuropathology and morphological characteristics of cellular senescence in human Alzheimer’s disease.
(a) Weight of each gene in the canonical senescence pathway (CSP) eigengene based on principal component analysis; CDKN2D had the highest weight. (b) RNAscope probe CDKN2D in control and (c) AD brains was performed on n=3 control and n=3 AD cases. Scale bar 50 μm. (d-g) RNAscope co-labeled (d) nuclei, (e) CDKN2D, (f) AT8 (phosphorylated tau, NFTs) and (g) color merged images. Scale bar 10 μm. (h-i) Representative images of frontal cortex in control (h, n=2) and Alzheimer's disease neuropathologic change (ADNC, n=9) cases (i-k) stained with (h-k) AT8 and adjacent section stained with (l-o) anti-p19 antibody (i.e. corresponding AT8 stains are directly above the p19 stains). Scale bar: 80 μm. (p) Co-immunofluorescence (IF) staining with AT8, (q) nuclear membrane, lamin B1, (r) p19 and (s) Hoechst nuclear stain. (t) Overlap of all channels. (u) Color-inverted Hoechst nuclear image for purposes of better visualizing nuclear morphology. Open black arrow: nuclei without p19 or NFTs; open cyan arrow: nuclei with p19 and closed arrowhead: nuclei with p19 with NFTs. Scale bar 10 μm. (v) Quantification of cell nucleus area across cells without p19 or NFT staining (control) or expressing p19 with or without NFTs (as indicated in panel u). Characteristic lipofuscin autofluorescence (white arrowheads in p and t) was also quantified. Data presented as mean ± standard error. One way ANOVA with Tukeys multiple comparisons test. **: p=0.0031, ****p<0.0001. n (number of cells): Control (p19 negative, AT8 negative): 101, p19 only: 44, p19+NFTs: 164.

References

    1. Tchkonia T, Zhu Y, van Deursen J, Campisi J & Kirkland JL Cellular senescence and the senescent secretory phenotype: therapeutic opportunities. J Clin Invest 123, 966–972, doi: 10.1172/JCI64098 (2013). - DOI - PMC - PubMed
    1. Acosta JC et al. A complex secretory program orchestrated by the inflammasome controls paracrine senescence. Nat Cell Biol 15, 978–990, doi: 10.1038/ncb2784 (2013). - DOI - PMC - PubMed
    1. Musi N et al. Tau protein aggregation is associated with cellular senescence in the brain. Aging Cell 17, e12840, doi: 10.1111/acel.12840 (2018). - DOI - PMC - PubMed
    1. Chow HM et al. Age-related hyperinsulinemia leads to insulin resistance in neurons and cell-cycle-induced senescence. Nat Neurosci 22, 1806–1819, doi: 10.1038/s41593-019-0505-1 (2019). - DOI - PubMed
    1. Ogrodnik M et al. Obesity-Induced Cellular Senescence Drives Anxiety and Impairs Neurogenesis. Cell Metab 29, 1061–1077 e1068, doi: 10.1016/j.cmet.2018.12.008 (2019). - DOI - PMC - PubMed

Publication types

Substances