. 2022 Jun 1;135(11):jcs259465.
doi: 10.1242/jcs.259465. Epub 2022 Jun 6.

Molecular determinants of αVβ5 localization in flat clathrin lattices - role of αVβ5 in cell adhesion and proliferation

Affiliations

Molecular determinants of αVβ5 localization in flat clathrin lattices - role of αVβ5 in cell adhesion and proliferation

Alba Zuidema et al. J Cell Sci. .

Abstract

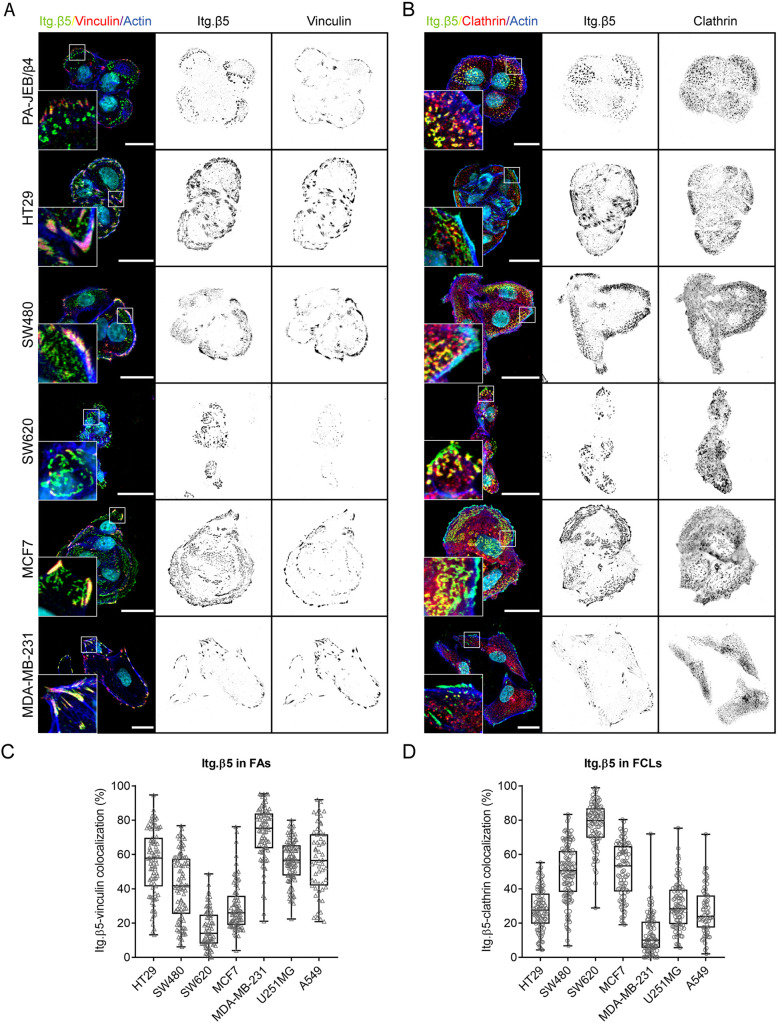
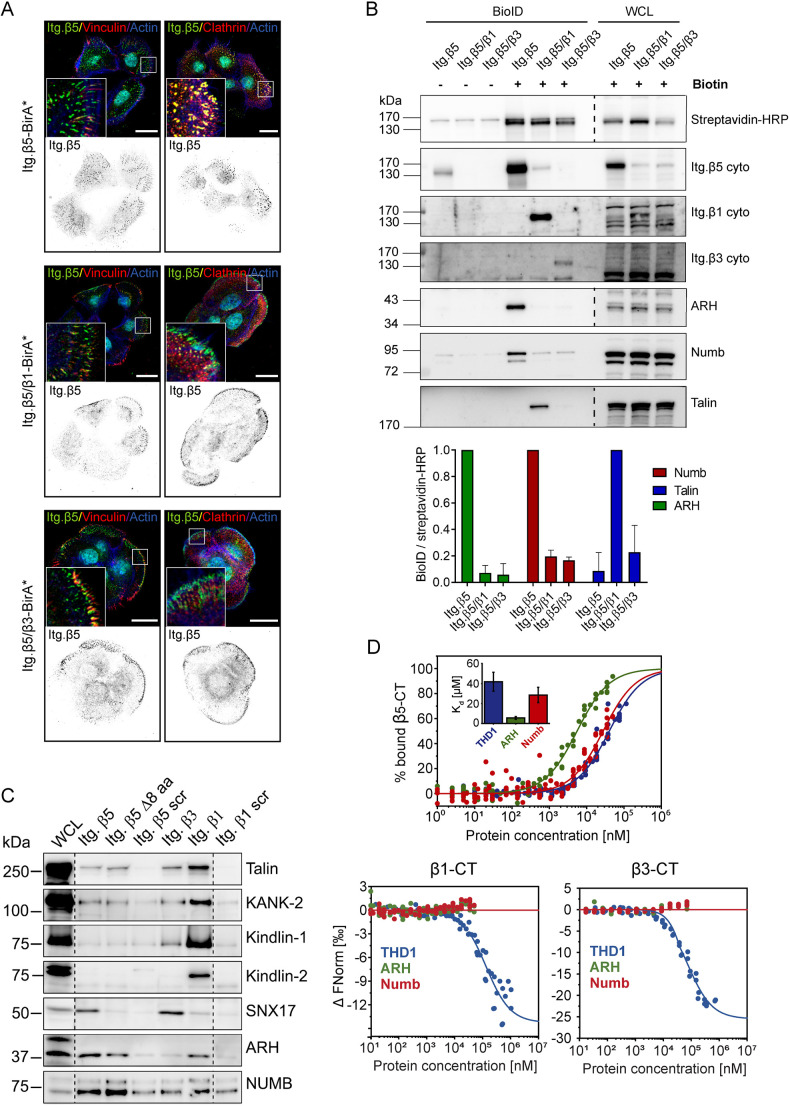
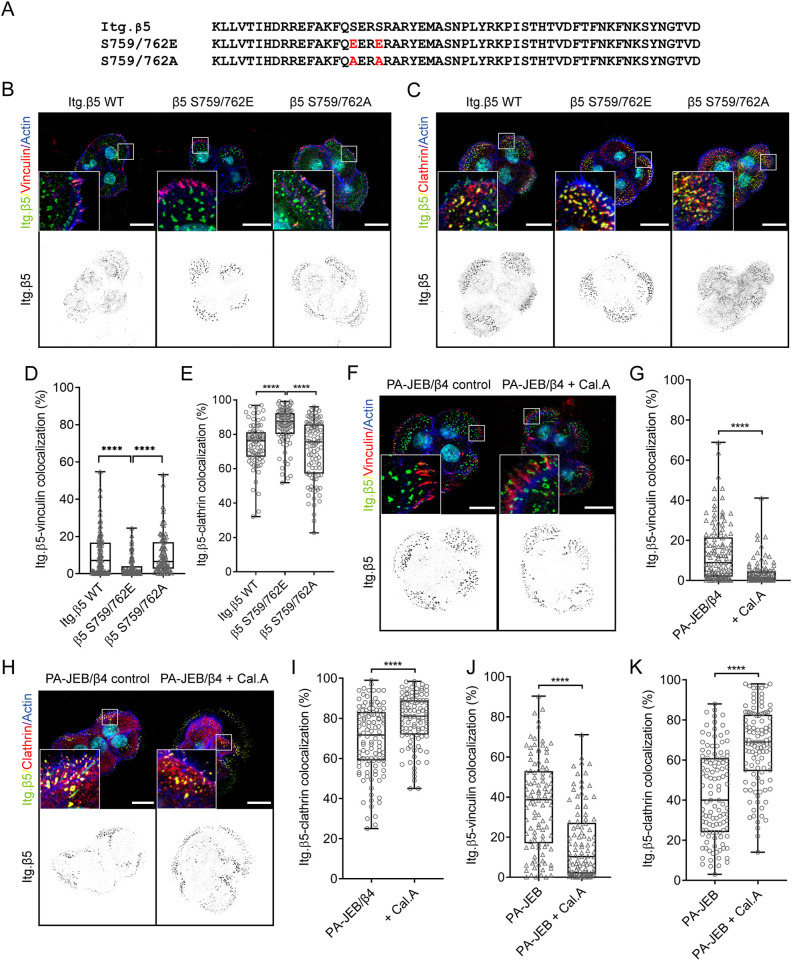
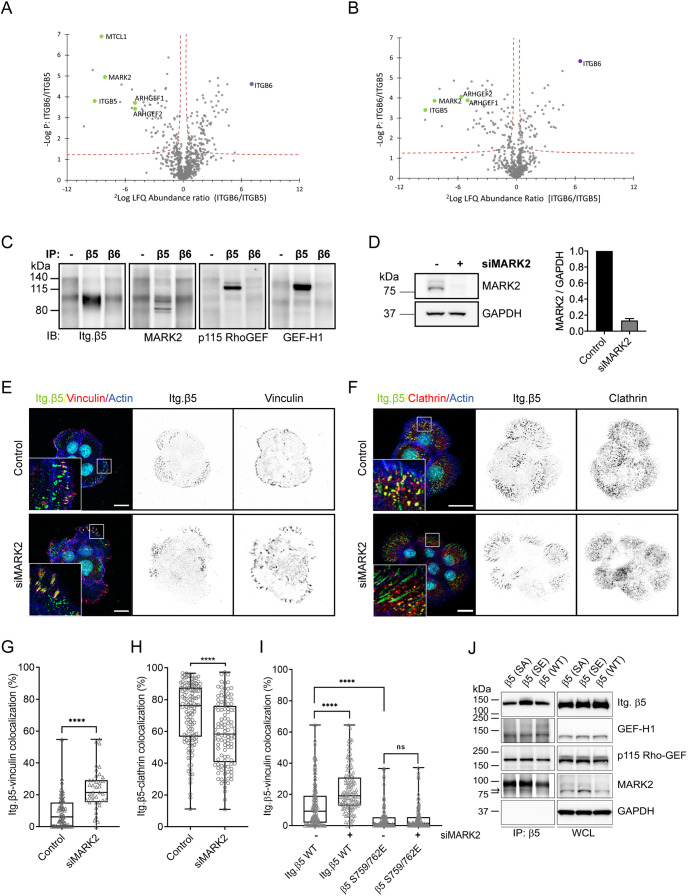
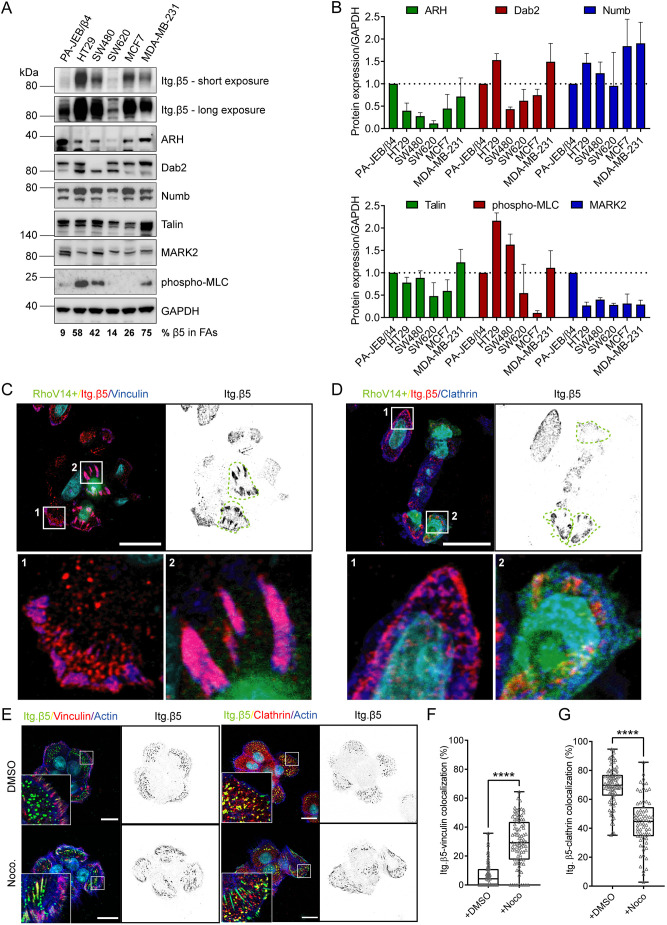
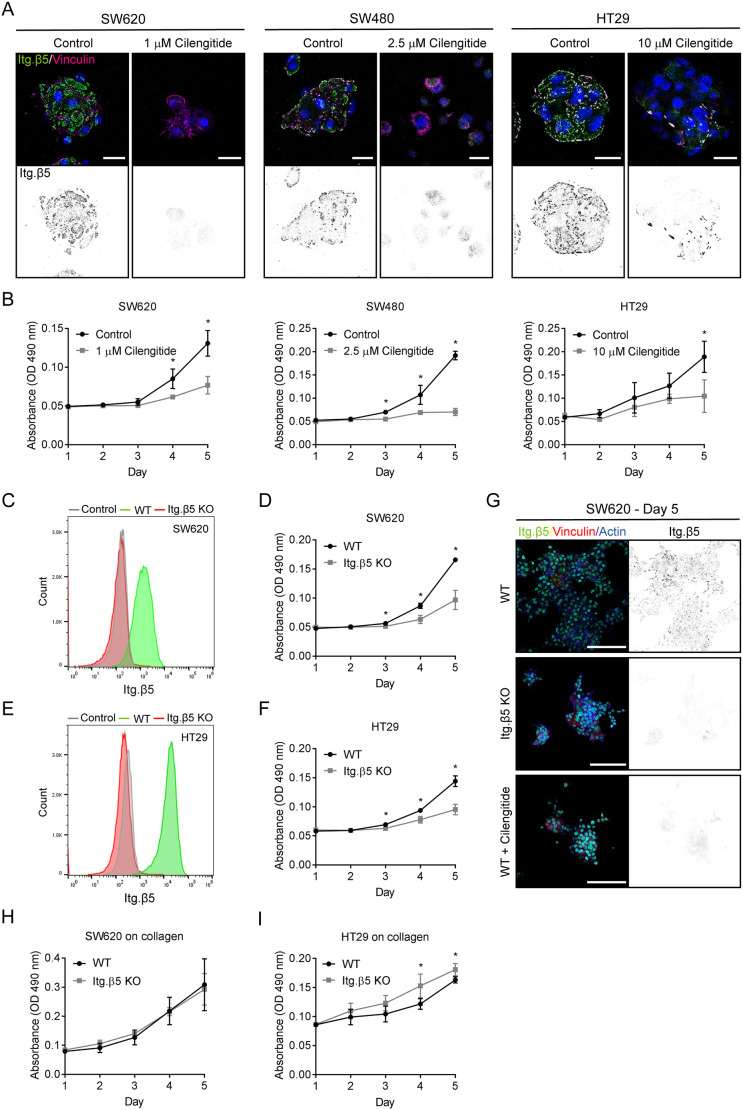
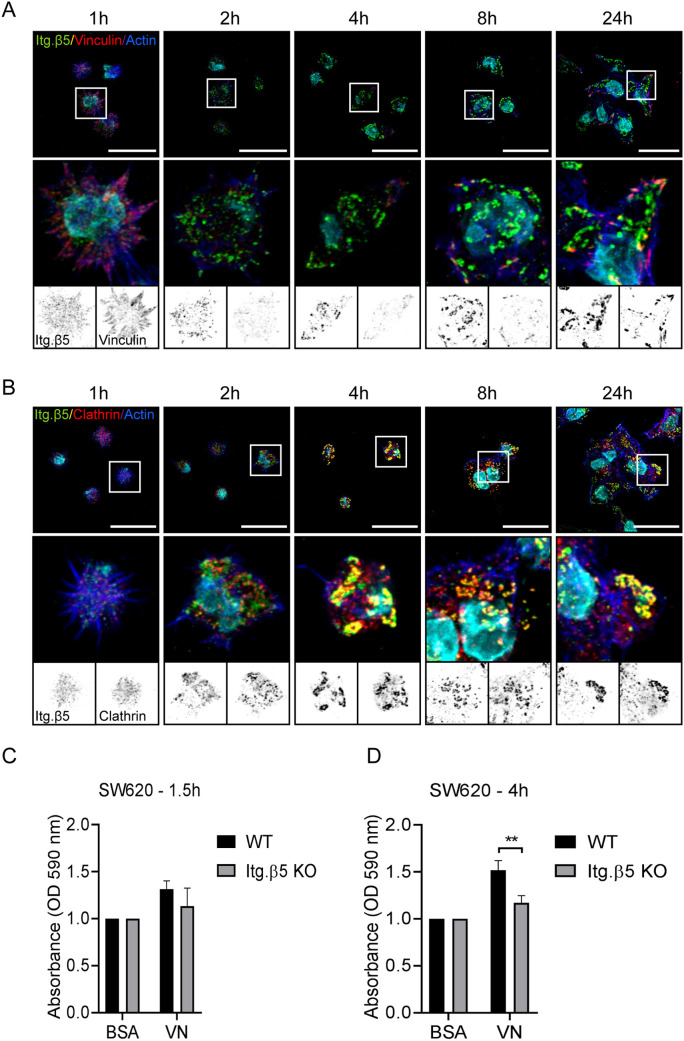
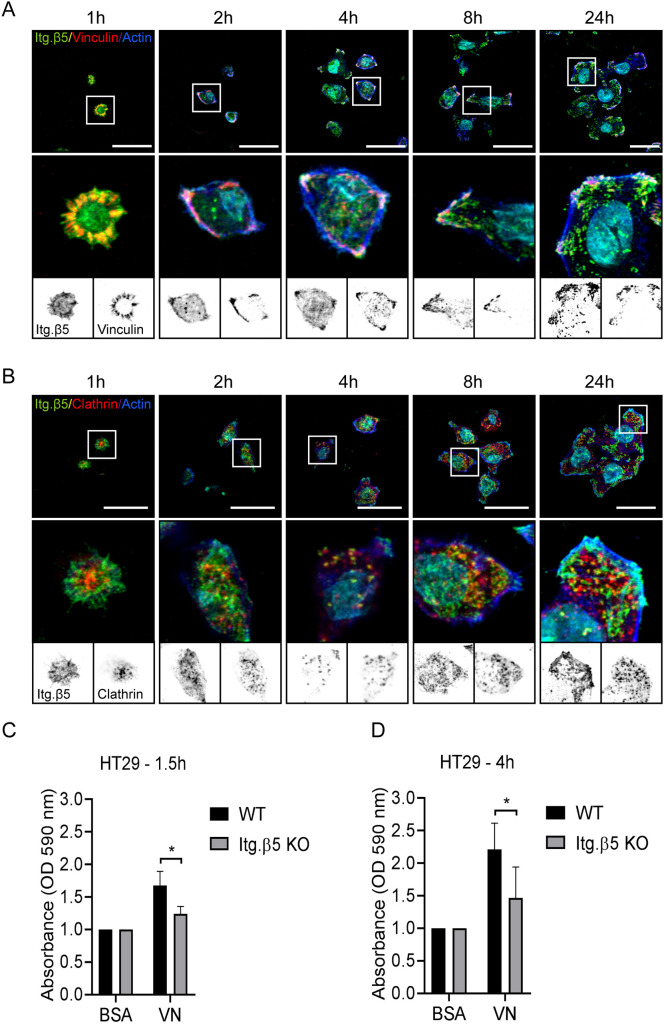
The vitronectin receptor integrin αVβ5 can reside in two distinct adhesion structures - focal adhesions (FAs) and flat clathrin lattices (FCLs). Here, we investigate the mechanism that regulates the subcellular distribution of β5 in keratinocytes and show that β5 has approximately 7- and 5-fold higher affinity for the clathrin adaptors ARH (also known as LDLRAP1) and Numb, respectively, than for the talin 1 (TLN1); all proteins that bind to the membrane-proximal NPxY motif of the β5 cytoplasmic domain. Using mass spectrometry, we identified β5 interactors, including the Rho GEFs p115Rho-GEF and GEF-H1 (also known as ARHGEF1 and ARHGEF2, respectively), and the serine protein kinase MARK2, depletion of which diminishes the clustering of β5 in FCLs. Replacement of two serine residues (S759 and S762) in the β5 cytoplasmic domain with phospho-mimetic glutamate residues causes a shift in the localization of β5 from FAs into FCLs without affecting the interactions with MARK2, p115Rho-GEF or GEF-H1. Instead, we demonstrate that changes in the actomyosin-based cellular contractility by ectopic expression of activated Rho or disruption of microtubules regulates β5 localization. Finally, we present evidence that β5 in either FAs or FCLs functions to promote adhesion to vitronectin, cell spreading, and proliferation.

Keywords: Flat clathrin lattice; Focal adhesion; Integrin; Proliferation; Vitronectin.


Conflict of interest statement

Competing interests The authors declare no competing or financial interests.

Figures

Fig. 1.
Fig. 1.
Subcellular distribution of integrin β5 in keratinocytes and multiple cancer cells. (A,B) Immunofluorescence images showing integrin β5 (Itg. β5; green in merge), vinculin (A) or clathrin (B) (red in merge), actin (blue), DAPI (cyan). Scale bars: 20 μm. (C,D) Quantifications of integrin β5 colocalization with vinculin in FAs (C) or with clathrin in FCLs (D). Data were obtained from three independent experiments. Total cells analyzed per condition: HT29=86 (C) and 94 (D), SW480=89 (C) and 115 (D), SW620=70 (C) and 90 (D), MCF7=82 (C) and 88 (D), MDA-MB-231=79 (C) and 89 (D), U251MG=97 (C) and 88 (D), A549=55 (C) and 63 (D). Representative images of U251MG and A549 cells are shown in Fig. S1. Box plots range from the 25th to 75th percentile; central line indicates the median; whiskers show smallest to largest value.
Fig. 2.
Fig. 2.
Adaptor protein binding to integrin β subunits. (A) Colocalization of integrin chimeras fused to the promiscuous biotin ligase BirA* (green in merge) with vinculin (red; left panels) or clathrin (red; right panels) in PA-JEB/β4 keratinocytes. Actin is shown in blue. Nuclei are stained with DAPI (cyan). Scale bars: 20 μm. (B) Representative western blots of BioID assays performed using the integrin chimeras shown in A. Quantifications of ARH, Numb and talin signal intensities normalized to streptavidin-HRP levels are shown (n=3; bars show mean±s.d.). (C) Representative western blots of pulldown assays (from two repeats) using synthetic integrin β cytoplasmic domains in RAC-11P cell lysates. (D) MST assay demonstrating binding of ARH, Numb, and talin-1 head domain (THD1) peptides to the β5 cytoplasmic domain (n≥5). Inset in top panel shows calculated Kd (mean±s.d.). β5-CT, β5 cytoplasmic tail; β5 Δ8 aa, β5 mutant carrying a deletion of a stretch of 8 amino acids (Val783–Phe790) located between the NPxY and NxxY motifs in the cytoplasmic domain of β5; Itg. β5/β1, chimeric receptor containing the extracellular and transmembrane domain of β5 and the cytoplasmic domain of β1; Itg. β5/β3, chimeric receptor containing the extracellular and transmembrane domain of β5 and the cytoplasmic domain of β3; scr, scrambled; WCL, whole-cell lysates.
Fig. 3.
Fig. 3.
Serine 759 and 762 are involved in regulating the localization of integrin β5. (A–C) Integrin β5 containing S759/762E or S759/762A mutations (A) were expressed in β5-deficient PA-JEB/β4 keratinocytes and the subcellular distribution of β5 was compared to β5-deficient keratinocytes expressing wild-type (WT) β5. Merged images show integrin β5 (green), vinculin (B) or clathrin (C) (red), actin (blue) and the cell nuclei (cyan). (D,E) Analysis of wild-type versus mutant integrin β5 clustering in FAs or FCLs. (F–I) PA-JEB/β4 keratinocytes were grown in 10% FCS-supplemented DMEM culture medium overnight and then treated with 5 nM calyculin A (Cal.A) or DMSO (vehicle control) for 30 min prior to fixation. Merged images show integrin β5 (green), vinculin (F) or clathrin (H) (red), actin (blue) and the cell nuclei (cyan), quantifications of β5 clustering in FAs or FCLs are shown in G,I. (J,K) Analysis of integrin β5 clustering in FAs or FCLs in PA-JEB keratinocytes after treatment with Cal.A. Representative confocal microscopy images are shown in Fig. S3. Scale bars: 20 μm. Data were obtained from three independent experiments. Total cells analyzed per condition: 109 (WT), 116 (S>E), 103 (S>A) (D), 81 (WT), 77 (S>E), 101 (S>A) (E), 126 and 123 (G), 111 and 101 (I), 106 and 102 (J), 115 and 109 (K). ****P<0.0001 (Mann–Whitney U-test). Box plots range from the 25th to 75th percentile; central line indicates the median; whiskers show smallest to largest value.
Fig. 4.
Fig. 4.
MARK2 regulates the localization of integrin β5. (A,B) Immunoprecipitations of integrin β5 and β6 were performed using 5HK2 and 5HK1 antibodies, respectively, in PA-JEB/β4 (A) or HaCaT (B) keratinocytes. Volcano plots show proteins enriched in integrin β5 versus β6 samples. The logarithmic ratio of protein LFQs were plotted against negative logarithmic P-values of a two-sided two samples t-test. The hyperbolic curve separates significantly enriched proteins from common binders (FDR, 0.05; n=3). Proteins discussed here are highlighted in green. (C) Western blots (IB) of normal rabbit serum (−) and integrin β5 and β6 immunoprecipitations (IP) to validate some of the β5 interactors identified by mass spectrometry. MARK2 isoforms have a molecular mass of 77–88 kDa. Representative of two repeats. (D) Representative western blot showing siRNA-mediated knockdown of MARK2 (siMARK2) in PA-JEB/β4 keratinocytes. Quantifications of signal intensities normalized to GAPDH levels are shown (n=3; bars show mean±s.d.). Western blots of MARK2 expression were performed in parallel to the immunofluorescence analysis shown in E–H. (E–H) Analysis of integrin β5 clustering in FAs (E,G) or FCLs (F,H) in control versus MARK2-depleted PA-JEB/β4 keratinocytes. Merged images show integrin β5 (green), vinculin (E) or clathrin (F) (red), actin (blue) and the cell nuclei (cyan). Scale bars: 20 μm. Quantifications of β5 clustering in FAs or FCLs are shown in G,H. Data were obtained from three independent experiments. Total cells analyzed per condition: 60 (control), 40 (siMARK2) (G), 122 (control), 105 (siMARK2) (H). (I) Quantifications of integrin β5 wild-type versus β5-S759/762E clustering in FAs. Data were obtained from three independent experiments. Total cells analyzed per condition: 136 [wild type (WT), control], 125 (WT, siMARK2), 118 (S759/762E, control), 140 (S759/762E, siMARK2). ****P<0.0001; ns, not significant (Mann–Whitney U test). Box plots range from the 25th to 75th percentile; central line indicates the median; whiskers show smallest to largest value. (J) Western blots of integrin β5 immunoprecipitations to validate if previously defined β5 interactors, MARK2, GEF-H1 and p115-Rho-GEF still associate with wild-type and integrin β5 mutants. The black arrow indicates the position of immunoprecipitated MARK2. Representative of three repeats. SE, S759/762E; SA, S759/762A; WCL, whole-cell lysate.
Fig. 5.
Fig. 5.
Actomyosin contractility regulates integrin β5 subcellular distribution. (A) Representative western blots of integrin adaptor proteins, MARK2, and phosphorylated myosin light chain (MLC) in PA-JEB/β4 keratinocytes, colorectal cancer cells (HT29, SW480, SW620) and breast cancer cells (MCF7, MDA-MB-231). The medians of the percentage values of β5 in FAs (quantified from Figs 1C, 3G) are indicated below. (B) Quantifications of signal intensities normalized to GAPDH levels are shown (n=3; bars show mean±s.d.). (C,D) SW480 transfected with RhoV14 (constitutively active) mutant. Merged images show RhoV14 positive cells in green, integrin β5 (red), and vinculin (C) or clathrin (D) (blue), and the cell nuclei (cyan). RhoV14+ cells are indicated with a green dashed line in the integrin β5 channel. Scale bars: 20 μm. (E–G) Analysis of integrin β5 clustering in FAs or FCLs in DMSO (control) versus nocodazole-treated PA-JEB/β4 keratinocytes. (E) Merged images show integrin β5 (green), vinculin or clathrin (red), actin (blue) and the cell nuclei (cyan). Scale bars: 20 μm. (F,G). Quantification of β5 clustering in FAs or FCLs. Data were obtained from three independent experiments. Total cells analyzed per condition: 60 (DMSO) and 75 (Noco) (F), and 92 (DMSO) and 75 (Noco) (G). ****P<0.0001 (Mann–Whitney U test). Box plots range from the 25th to 75th percentile; central line indicates the median; whiskers show smallest to largest values.
Fig. 6.
Fig. 6.
Integrin β5 promotes colorectal cancer cell proliferation. (A) Inhibition of β5 clustering by cilengitide treatment in the indicated cell lines. Cells were fixed after 3 days of treatment and β5 (green in merge) and vinculin (magenta) were visualized using confocal microscopy. Cell nuclei are shown in blue. Scale bars: 20 μm. (B) Cells were seeded on day 0 and proliferation was measured from day 1–5 in cells with or without cilengitide (added at day 1). (C,E) FACS plots showing the expression of β5 in SW620 (C) and HT29 (E) wild-type (WT) and β5 knockout cells. Cells stained with a secondary PE-conjugated antibody only were used as negative control (n=2). (D,F) Proliferation of SW620 and HT29 wild-type and β5 knockout cells. (G) Representative IF images showing integrin β5 (green in merge), vinculin (red), actin (blue), nuclei (cyan) in SW620 wild-type, β5-deficient, and cilengitide-treated cells that were cultured for 5 days on coverslips prior to fixation. Scale bars: 100 μm. (H,I) Proliferation of SW620 (H) and HT29 (I) wild-type and β5 knockout cells on 3.2 μg ml−1 collagen. Results shown represent mean±s.d. of three biological replicates, of which each experiment was performed in triplicate. *P<0.05 (two-sided unpaired Student's t-test).
Fig. 7.
Fig. 7.
Integrin β5 in clathrin lattices mediates adhesion to vitronectin ∼4 h after cell seeding. (A,B) SW620 cells were seeded on vitronectin-coated coverslips and fixed at the indicated time points. Representative immunofluorescence images showing integrin β5 (green in merge), vinculin (A) or clathrin (B) (red in merge), actin in blue, and the cell nuclei in cyan. Scale bars: 20 μm. Representative images are shown of two independent experiments performed in duplicate. (C,D) Adhesion assay performed 1.5 h (C) and 4 h (D) after seeding SW620 wild-type (WT) and β5 knockout cells on vitronectin (VN) (three biological replicates; each experiment in triplicate; bars show mean±s.d). **P<0.01 (two-sided unpaired Student's t-test).
Fig. 8.
Fig. 8.
Integrin β5 in focal adhesions mediates early adhesion to vitronectin. (A,B) HT29 cells were seeded on vitronectin-coated coverslips and fixed at the indicated time points. Representative immunofluorescence images show integrin β5 (green in merge), vinculin (A) or clathrin (B) (red in merge), actin in blue, and the cell nuclei in cyan. Scale bars: 20 μm. Representative images are shown of two independent experiments performed in duplicates. (C,D) Adhesion assay performed 1.5 h (C) and 4 h (D) after seeding HT29 wild-type (WT) and β5 knockout cells on vitronectin (VN) (three biological replicates; each experiment in triplicate; bars show mean±s.d.). *P<0.05 (two-sided unpaired Student's t-test).

Similar articles

Cited by

References

    1. Alfonzo-Méndez, M. A., Sochacki, K. A., Strub, M.-P. and Taraska, J. W. (2022). Dual clathrin and integrin signaling systems regulate growth factor receptor activation. Nat Commun. 13, 905. 10.1038/s41467-022-28373-x - DOI - PMC - PubMed
    1. Anthis, N. J., Wegener, K. L., Critchley, D. R. and Campbell, I. D. (2010). Structural diversity in integrin/talin interactions. Structure 18, 1654-1666. 10.1016/j.str.2010.09.018 - DOI - PMC - PubMed
    1. Askham, J. M., Vaughan, K. T., Goodson, H. V. and Morrison, E. E. (2002). Evidence that an interaction between EB1 and p150Glued is required for the formation and maintenance of a radial microtubule array anchored at the centrosome. Mol. Biol. Cell 13, 3627-3645. 10.1091/mbc.e02-01-0061 - DOI - PMC - PubMed
    1. Aumais, J. P., Tunstead, J. R., Mcneil, R. S., Schaar, B. T., Mcconnell, S. K., Lin, S.-H., Clark, G. D. and Yu-Lee, L.-Y. (2001). NudC associates with Lis1 and the Dynein motor at the leading pole of neurons. The J. Neurosci. 21, RC187. 10.1523/JNEUROSCI.21-24-j0002.2001 - DOI - PMC - PubMed
    1. Aumais, J. P., Williams, S. N., Luo, W., Nishino, M., Caldwell, K. A., Caldwell, G. A., Lin, S.-H. and Yu-Lee, L.-Y. (2003). Role for NudC, a dynein-associated nuclear movement protein, in mitosis and cytokinesis. J. Cell Sci. 116, 1991-2003. 10.1242/jcs.00412 - DOI - PubMed

Publication types

MeSH terms