. 2022 May 9:11:e75897.
doi: 10.7554/eLife.75897.

Human visual gamma for color stimuli

Affiliations

Human visual gamma for color stimuli

Benjamin J Stauch et al. Elife. .

Abstract

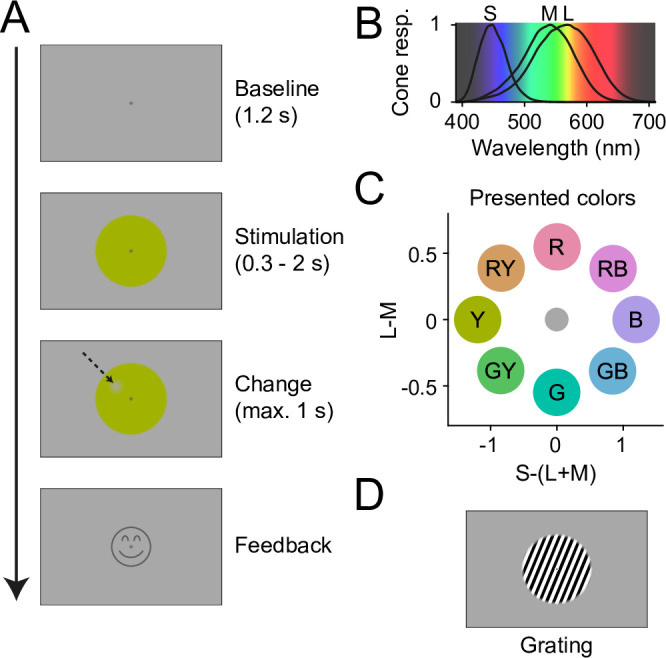
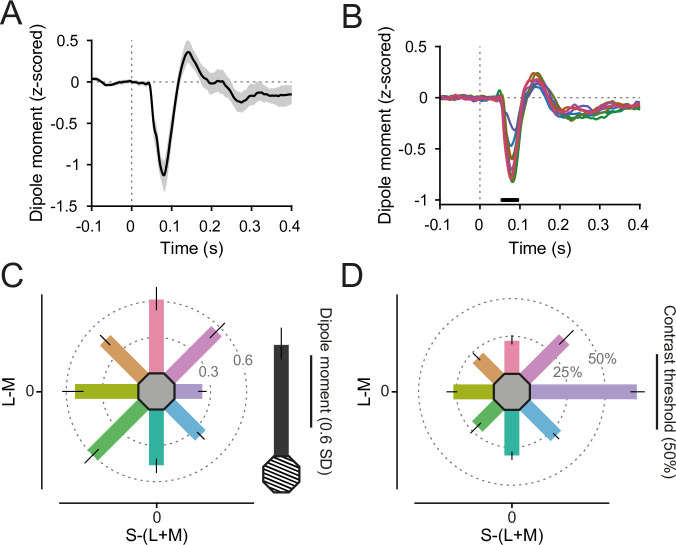
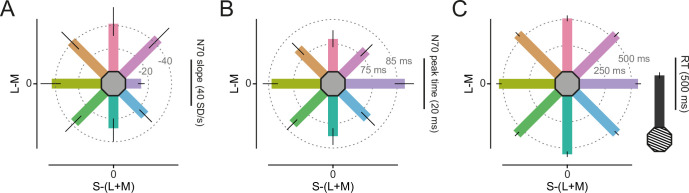
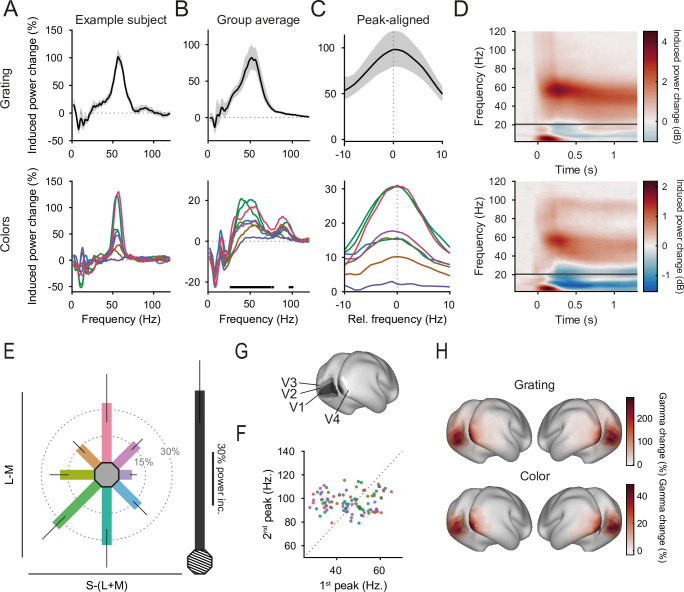
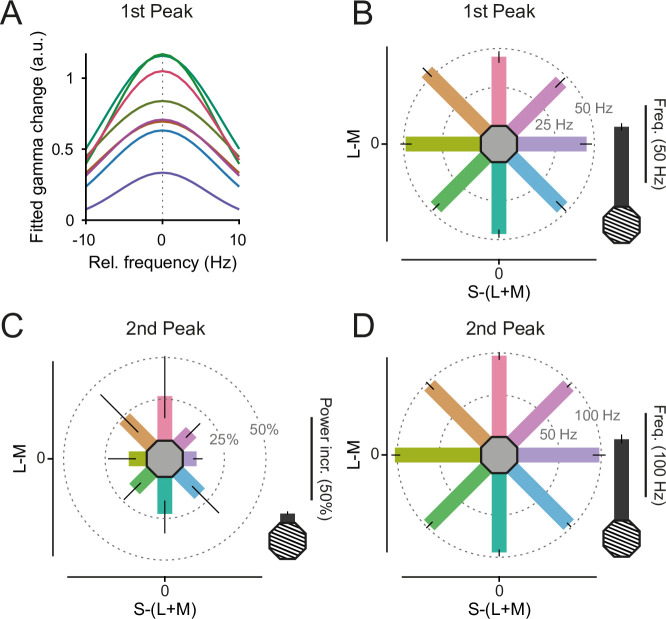
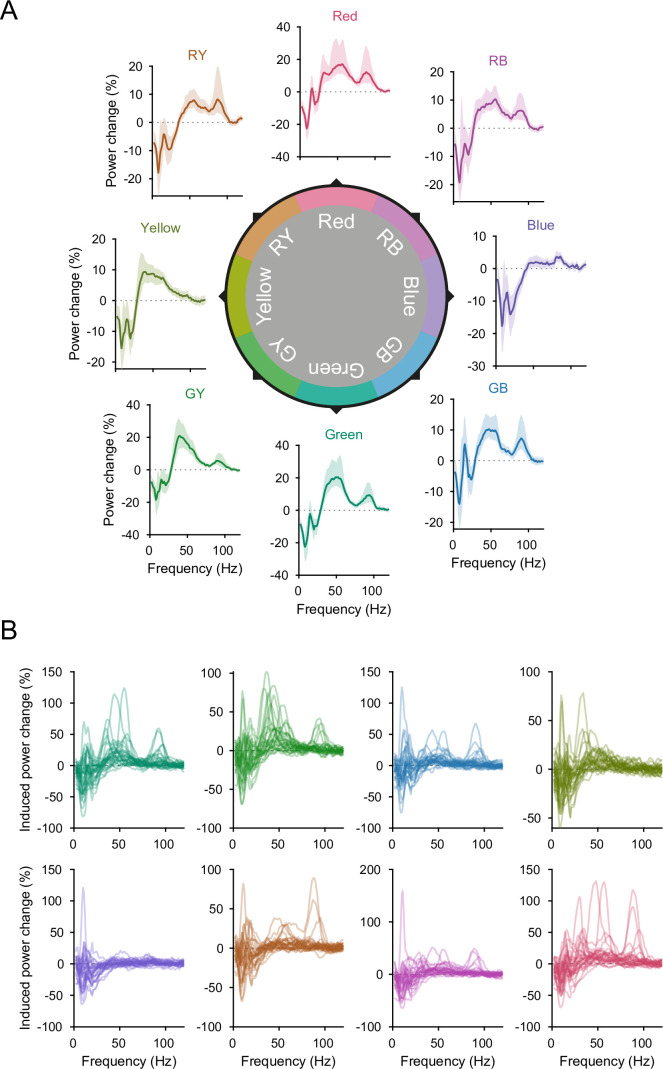
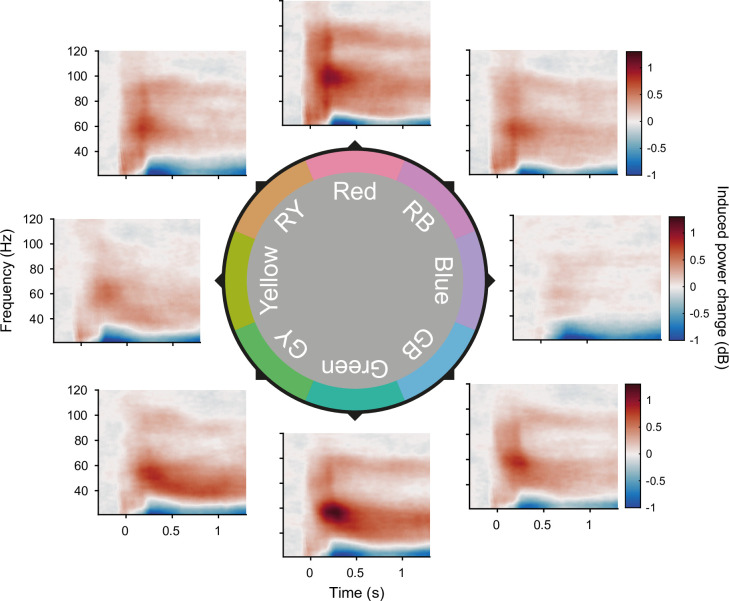
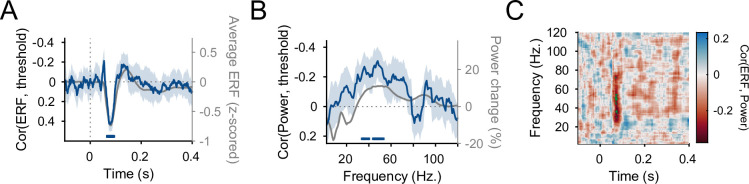
Strong gamma-band oscillations in primate early visual cortex can be induced by homogeneous color surfaces (Peter et al., 2019; Shirhatti and Ray, 2018). Compared to other hues, particularly strong gamma oscillations have been reported for red stimuli. However, precortical color processing and the resultant strength of input to V1 have often not been fully controlled for. Therefore, stronger responses to red might be due to differences in V1 input strength. We presented stimuli that had equal luminance and cone contrast levels in a color coordinate system based on responses of the lateral geniculate nucleus, the main input source for area V1. With these stimuli, we recorded magnetoencephalography in 30 human participants. We found gamma oscillations in early visual cortex which, contrary to previous reports, did not differ between red and green stimuli of equal L-M cone contrast. Notably, blue stimuli with contrast exclusively on the S-cone axis induced very weak gamma responses, as well as smaller event-related fields and poorer change-detection performance. The strength of human color gamma responses for stimuli on the L-M axis could be well explained by L-M cone contrast and did not show a clear red bias when L-M cone contrast was properly equalized.

Keywords: DKL; LGN; MEG; N70; V1; color vision; gamma; human; neuroscience.


Conflict of interest statement

BS, AP, IE, ZN No competing interests declared, PF has a patent on thin-film electrodes (US20170181707A1) and is beneficiary of a respective license contract on thin-film electrodes with Blackrock Microsystems LLC (Salt Lake City, UT), is member of the Advisory Board of CorTec GmbH (Freiburg, Germany), and managing director of Brain Science GmbH (Frankfurt am Main, Germany). The authors declare no further competing interests

Figures

Figure 1.
Figure 1.. Experiment design.
(A) Temporal structure of one trial. After fixation onset, a gray baseline was shown for 1.2 s, followed by 0.3–2 s of stimulation with a stimulus disk. Then, a change spot appeared at a random position on the disk (indicated here with an arrow, not visible in the actual experiment), which the participants needed to report. Upon correct report, a smiley was shown. (B) Human cone sensitivity spectra (Stockman and Sharpe, 2000) plotted on an estimate of perceptual wavelength color. (C) DKL coordinates for all eight stimulus colors shown in this study, relative to the background. Letters indicate stimulus labels used in Results. Note that color hues of these color disks, when displayed on a noncalibrated monitor or printout, will not fully correspond to the hues shown in the study. (D) To compare the strength of induced gamma responses between color and grating stimuli, some trials showed a grating instead of a color stimulus.
Figure 2.
Figure 2.. Event-related field (ERF) responses.
(A) Grating-evoked ERF, averaged over V1 dipoles and participants. Error region shows 95% CI over participants. (B) Color-evoked ERFs, averaged over V1 dipoles and participants. Black bar indicates significant differences across colors, tmax corrected for multiple comparisons. Line colors reflect stimulus colors, but have been darkened for readability. (C) ERF N70 dipole moment (relative to baseline variability), averaged over V1 dipoles and participants. Error bars represent 95% CIs over participants, bar orientation represents stimulus orientation in DKL space. In gray, the average grating-induced ERF dipole moment is shown for comparison. (D) Average relative contrast steps toward the background color needed to achieve 85% target detection accuracy for all stimuli. Error bars represent 95% CIs over participants, bar orientation represents stimulus orientation in DKL space. For C, D, the length of the scale bar corresponds to the distance from the edge of the hexagon to the outer ring.
Figure 2—figure supplement 1.
Figure 2—figure supplement 1.. Event-related field (ERF) and reaction time results.
(A) Average prepeak slope of the N70 ERF component (extracted from 2 to 12 ms before per-color, per-participant peak time) for all colors. (B) Average peak time of the N70 ERF component for all colors. (C) Average reaction times for all stimuli. For panels A–C, error bars represent 95% CIs over participants, bar orientation represents stimulus orientation in DKL space. The length of the scale bar corresponds to the distance from the edge of the hexagon to the outer ring.
Figure 3.
Figure 3.. Gamma-band responses.
(A) Stimulus-induced power changes over baseline for one example participant that showed strong gamma-band responses (averaged over V1 dipoles). Top: grating-induced power changes. Error region shows 95% CI over trials. Bottom: color-induced power changes. (B) Same as A, but averaged over participants. Error region shows 95% CI over participants. (C) Same as B, but peak-aligned before averaging. For A–C, line colors reflect stimulus colors, but have been darkened for readability. (D) Average stimulus-induced power change in V1 as a function of time and frequency. Top: for grating stimuli. Bottom: for green stimuli. (E) Average stimulus-induced gamma-power change (individual gamma peak ±10 Hz) for all stimuli. Error bars represent 95% CIs over participants, bar orientation represents stimulus orientation in DKL space. In gray, the average grating-induced gamma-power strength is shown for comparison. The length of the scale bar corresponds to the distance from the edge of the hexagon to the outer ring. (F) Gamma-peak frequencies of the first and second gamma peak for all participant–color combinations in which a first and a second gamma peak was found. Dot color corresponds to stimulus color. Dotted line indicates the expected frequency relationship, if first and second peak frequencies were harmonics of each other. (G) The inflated template brain. Black-to-white shading indicates areas V1, V2, V3, and V4. (H) Average stimulus-induced gamma-power change (individual gamma peak ±10 Hz), source projected to all cortical dipoles. Values are significance masked using false discovery rate control (Benjamini and Yekutieli, 2001), black-to-white shading indicates areas V1, V2, V3, and V4. All panels show power change 0.3–1.3 s after stimulus onset, relative to baseline.
Figure 3—figure supplement 1.
Figure 3—figure supplement 1.. Spectral measures.
(A) Per participant, per color, the induced gamma-power change peak in dB was fitted with a Gaussian added to an offset (for full description, see Methods). Plotted is the resulting Gaussian, with peak power and variance averaged over participants. (B) Average induced gamma-peak frequency of the lower gamma peak for all stimuli. Bar orientation represents stimulus orientation in DKL space. In gray, the same is shown for the grating stimulus. (C) Same as B, but for stimulus-induced power at the upper gamma-peak frequency. (D) Same as B, but for the upper gamma-peak frequency. In panels B–D, error bars represent 95% CIs over participants and the length of the scale bar corresponds to the distance from the edge of the hexagon to the outer ring.
Figure 3—figure supplement 2.
Figure 3—figure supplement 2.. Individual spectra.
(A) Per-color average induced power-change spectra. Banding shows 95% confidence intervals over participants. Note that the y-axis varies between colors. (B) Stimulus-induced power changes over baseline (averaged over V1 dipoles) for all 30 participants and the eight presented colors.
Figure 3—figure supplement 3.
Figure 3—figure supplement 3.. Per-color time–frequency responses.
Average stimulus-induced power change in V1 as a function of time and frequency, plotted for each color.
Figure 4.
Figure 4.. Correlations between event-related field (ERF), induced power spectra, and performance.
(A) Per-timepoint correlation, across colors, between V1 ERF dipole moment (averaged over trials and dipoles) and 85% accuracy threshold. The correlation was first calculated per participant and then averaged over participants. Error bands represent 95% CIs over participants. In gray, the average ERF dipole moment timecourse over color stimuli is shown for comparison. Horizontal blue bar represents significant correlation values (multiple comparison-corrected using tmax correction). (B) Same as A, but for the stimulus-induced V1 power change spectra instead of the ERFs. (C) Correlation, across colors, between V1 ERF dipole moment and V1 stimulus-induced power change, as a function of ERF time and spectral frequencies. The correlation was first calculated per participant and then averaged over participants. Significant correlation values (multiple comparison corrected using tmax correction) are indicated by green dots.

Similar articles

Cited by

References

    1. Baillet S. Magnetoencephalography for brain electrophysiology and imaging. Nature Neuroscience. 2017;20:327–339. doi: 10.1038/nn.4504. - DOI - PubMed
    1. Bartoli E, Bosking W, Chen Y, Li Y, Sheth SA, Beauchamp MS, Yoshor D, Foster BL. Functionally Distinct Gamma Range Activity Revealed by Stimulus Tuning in Human Visual Cortex. Current Biology. 2019;29:3345–3358. doi: 10.1016/j.cub.2019.08.004. - DOI - PMC - PubMed
    1. Bartoli E, Bosking W, Foster BL. Seeing Visual Gamma Oscillations in a New Light. Trends in Cognitive Sciences. 2020;24:501–503. doi: 10.1016/j.tics.2020.03.009. - DOI - PMC - PubMed
    1. Bastos AM, Briggs F, Alitto HJ, Mangun GR, Usrey WM. Simultaneous recordings from the primary visual cortex and lateral geniculate nucleus reveal rhythmic interactions and a cortical source for γ-band oscillations. The Journal of Neuroscience. 2014;34:7639–7644. doi: 10.1523/JNEUROSCI.4216-13.2014. - DOI - PMC - PubMed
    1. Bastos AM, Vezoli J, Bosman CA, Schoffelen JM, Oostenveld R, Dowdall JR, De Weerd P, Kennedy H, Fries P. Visual areas exert feedforward and feedback influences through distinct frequency channels. Neuron. 2015;85:390–401. doi: 10.1016/j.neuron.2014.12.018. - DOI - PubMed

Publication types