. 2022 Jun 28;13(3):e0089222.
doi: 10.1128/mbio.00892-22. Epub 2022 May 9.

Serine Protease Inhibitors Restrict Host Susceptibility to SARS-CoV-2 Infections

Affiliations

Serine Protease Inhibitors Restrict Host Susceptibility to SARS-CoV-2 Infections

Ebba Rosendal et al. mBio. .

Abstract

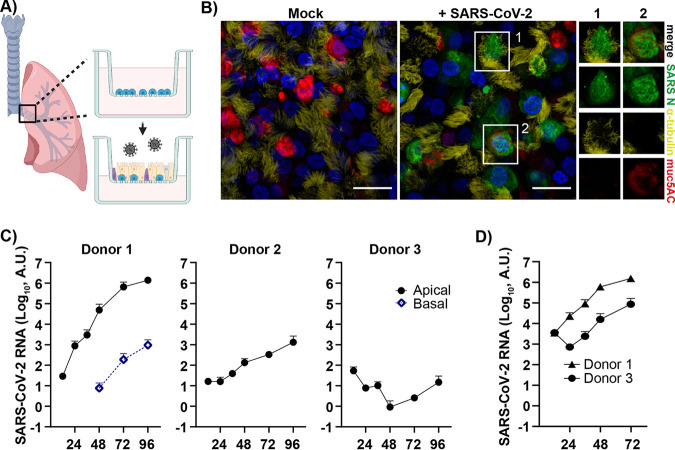
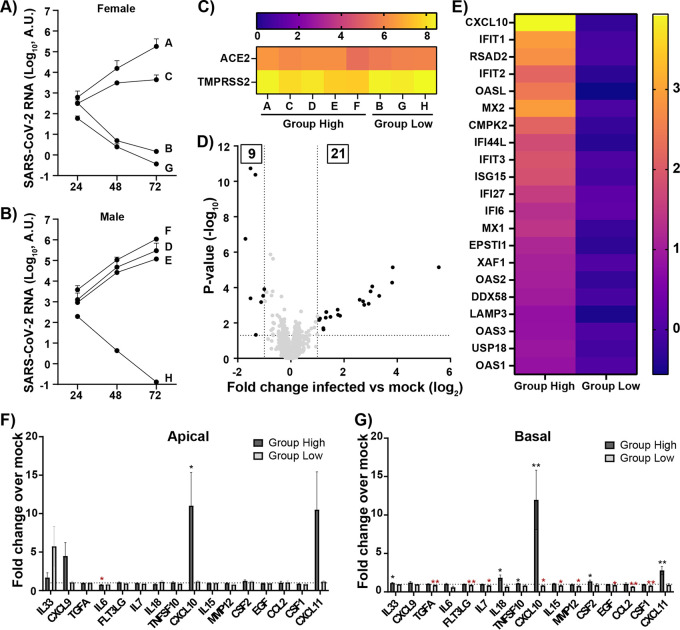
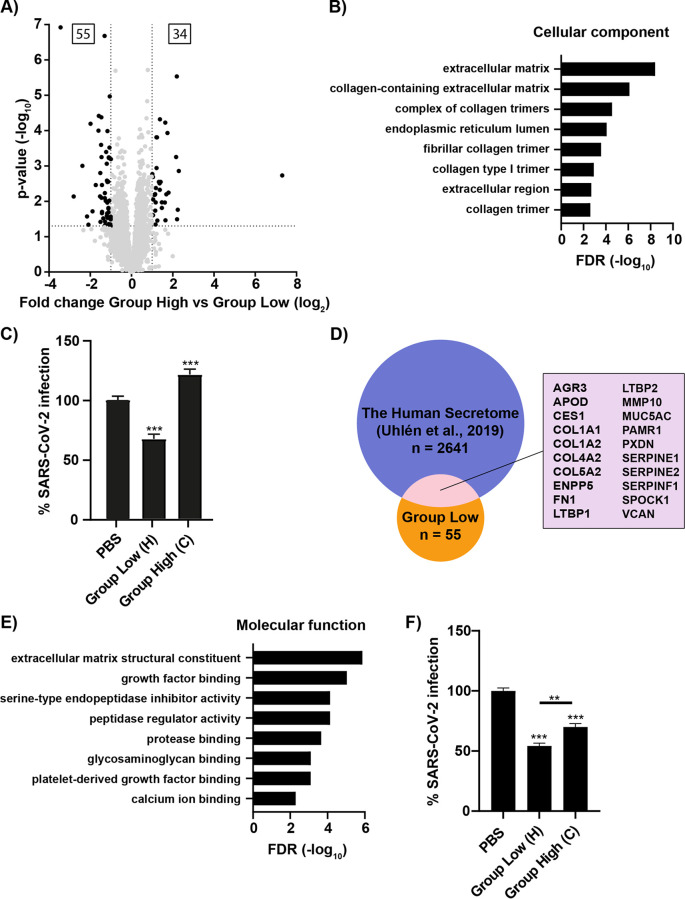
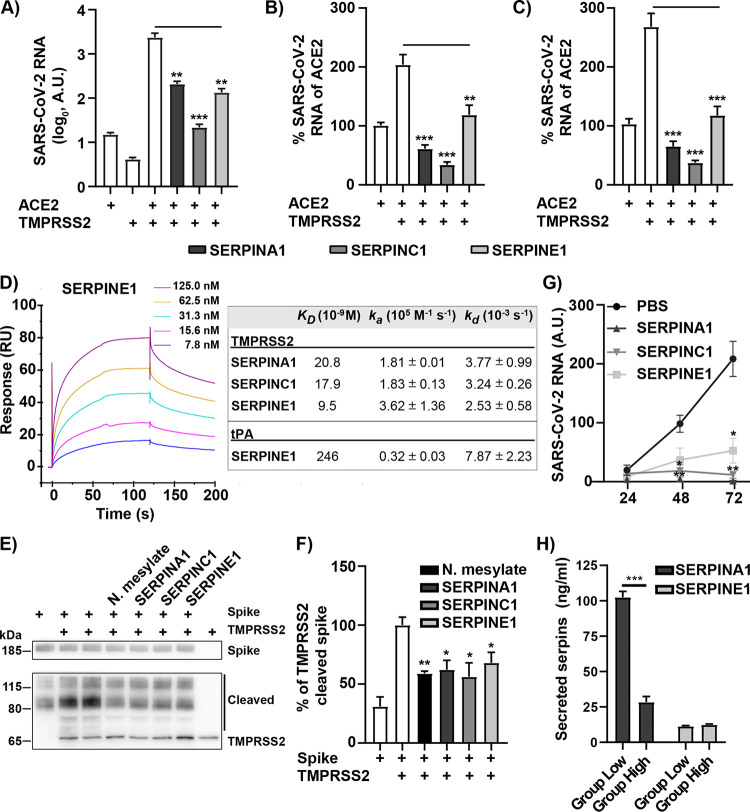
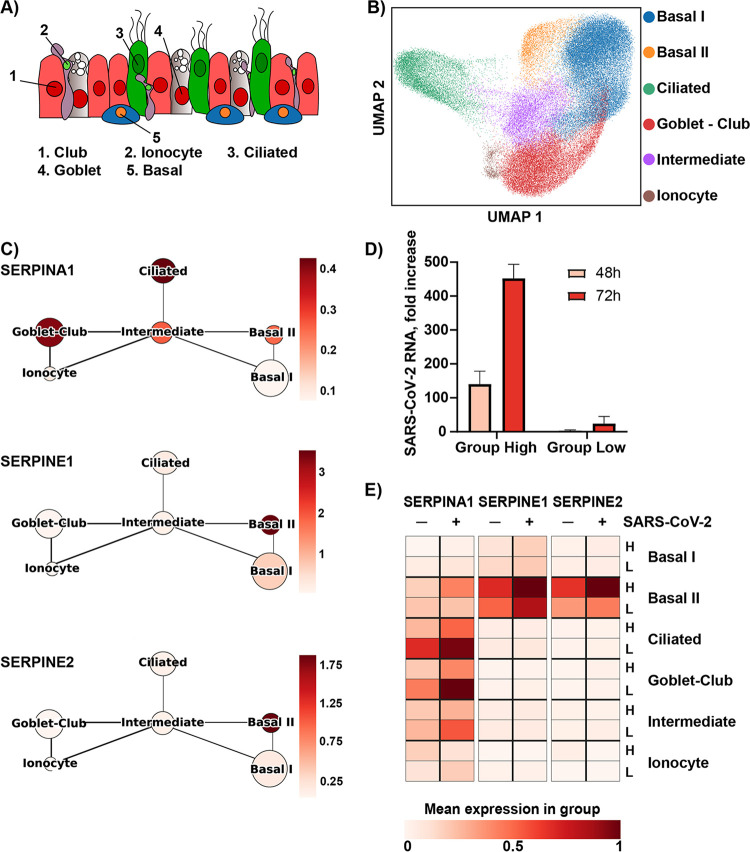
The coronavirus disease 2019, COVID-19, is a complex disease with a wide range of symptoms from asymptomatic infections to severe acute respiratory syndrome with lethal outcome. Individual factors such as age, sex, and comorbidities increase the risk for severe infections, but other aspects, such as genetic variations, are also likely to affect the susceptibility to SARS-CoV-2 infection and disease severity. Here, we used a human 3D lung cell model based on primary cells derived from multiple donors to identity host factors that regulate SARS-CoV-2 infection. With a transcriptomics-based approach, we found that less susceptible donors show a higher expression level of serine protease inhibitors SERPINA1, SERPINE1, and SERPINE2, identifying variation in cellular serpin levels as restricting host factors for SARS-CoV-2 infection. We pinpoint their antiviral mechanism of action to inhibition of the cellular serine protease, TMPRSS2, thereby preventing cleavage of the viral spike protein and TMPRSS2-mediated entry into the target cells. By means of single-cell RNA sequencing, we further locate the expression of the individual serpins to basal, ciliated, club, and goblet cells. Our results add to the importance of genetic variations as determinants for SARS-CoV-2 susceptibility and suggest that genetic deficiencies of cellular serpins might represent risk factors for severe COVID-19. Our study further highlights TMPRSS2 as a promising target for antiviral intervention and opens the door for the usage of locally administered serpins as a treatment against COVID-19. IMPORTANCE Identification of host factors affecting individual SARS-CoV-2 susceptibility will provide a better understanding of the large variations in disease severity and will identify potential factors that can be used, or targeted, in antiviral drug development. With the use of an advanced lung cell model established from several human donors, we identified cellular protease inhibitors, serpins, as host factors that restrict SARS-CoV-2 infection. The antiviral mechanism was found to be mediated by the inhibition of a serine protease, TMPRSS2, which results in a blockage of viral entry into target cells. Potential treatments with these serpins would not only reduce the overall viral burden in the patients, but also block the infection at an early time point, reducing the risk for the hyperactive immune response common in patients with severe COVID-19.

Keywords: A1AT; ATIII; COVID-19; PAI1; SARS-CoV-2; TMPRSS2; alpha-1-antitrypsin; antithrombin III; plasminogen activator inhibitor 1; serpin.


Conflict of interest statement

The authors declare a conflict of interest. J.T. is employed at Sartorius and A.L. has received unconditional research support from Carl Bennet AB. This does not alter our adherence to mBio policies on sharing data and materials. There are no patents, products in development or marketed products associated with this research to declare.

Figures

FIG 1
FIG 1
SARS-CoV-2 infection of human bronchial epithelial cells grown at an air-liquid interface identifies donor-dependent variation in infection levels. (A) Schematic of experimental design (created with BioRender.com). Air-liquid interface (ALI) cultures of human bronchial epithelial cells (HBECs) were generated, differentiated in vitro, and infected apically with SARS-CoV-2, and the infection was monitored over time. (B) HBEC ALI cultures fixed at 96 h postinfection were stained for viral nucleocapsid protein (NP), α-tubulin (ciliated cells), muc5AC (goblet cells), and DAPI (nuclei) and imaged at 60× on a confocal microscope. Scale bar = 20 μm. Infected cells showing costaining with either α-tubulin (1) or muc5AC (2) are shown in greater magnification. (C) Time kinetics of HBEC ALI cultures (n = 2) from three different donors (1, 2, and 3) infected with SARS-CoV-2 at an MOI of 0.05; (D) time kinetics for donor 1 and 3 at an MOI of 0.5. Infection was analyzed by qPCR of both apical (viral release during 1 h) and basolateral samples collected at the indicated time points.
FIG 2
FIG 2
Donor differences in infection levels and immune response following SARS-CoV-2 infection of HBEC ALI cultures. HBEC ALI cultures from 8 different donors were infected with SARS-CoV-2 at an MOI of 0.05. The accumulated viral release from the apical side of cultures from (A) female donors, n = 4, and (B) male donors, n = 4, was quantified by qPCR at the indicated time points. (C) Heatmap displaying the mean expression (log2) of ACE2 and TMPRSS2 in HBEC ALI cultures from each donor. (D) Volcano plot showing differentially expressed genes between uninfected (mock) and infected HBEC ALI cultures in group high. The statistical P value (–log10) is plotted against the gene expression difference (log2). Dotted lines highlight the significance cutoff at log fold changes of −1/1 (vertical line) and at a P value of 0.05 (horizontal line). (E) Heatmap displaying the significantly upregulated genes in group high upon infection. Shown are the mean expression difference compared to individual mock samples for each group (log2 fold difference). (F and G) Cytokine levels in (F) apical and (G) basolateral samples collected at 72 h postinfection were analyzed using Proximity Extension Assay (Olink) and normalized to mock-treated samples for each donor individually. Mean values and standard error of the mean (SEM) are shown; statistical significance was calculated by unpaired t test (*, P < 0.05; **, P < 0.01).
FIG 3
FIG 3
Identification of donor differences highlights secreted proteins as potential antiviral candidates in group low. (A) Volcano plot displaying differentially expressed genes between uninfected HBEC ALI cultures from group high versus group low. The statistical P value (–log10) is plotted against the gene expression difference (log2). Dotted lines highlight the significance cutoff at log fold changes of −1/1 (vertical line) and at a P value of 0.05 (horizontal line). (B) Gene Ontology term enrichment analysis showing the cellular components of the 55 upregulated genes in group low. The cellular components are plotted against their –log10 transformed false-discovery rate (FDR). (C) SARS-CoV-2 infection of Vero E6 cells 8 h postinfection following coincubation of cells with SARS-CoV-2 and apical secretion from donor C (group high) or donor H (group low). Infection is given as a percentage of PBS control; mean and SEM are shown, and statistical significance was calculated by unpaired t test (**, P < 0.01; ***, P < 0.001). (D) Venn diagram showing the overlap between human proteins known to be secreted, “the human secretome,” and the 55 upregulated genes in group low. The 20 overlapping genes are listed. (E) Gene Ontology term enrichment analysis displaying the molecular function of the 20 secreted proteins among the upregulated genes in group low. The molecular functions are plotted against their –log10 transformed false-discovery rate (FDR). (F) SARS-CoV-2 infection of Calu-3 cells 8 h postinfection following coincubation of cells with SARS-CoV-2 and apical secretion from donor C (group high) or donor H (group low). Infection is given as a percentage of PBS control; mean and SEM are shown; statistical significance was calculated by unpaired t test (**, P < 0.01; ***, P < 0.001).
FIG 4
FIG 4
The investigated serpins reduce SARS-CoV-2 infection by inhibition of TMPRSS2-mediated spike protein cleavage. (A) HEK-293T cells transfected with the indicated expression plasmids for 24 h were infected with SARS-CoV-2 (MOI = 0.1) for 6 h, and viral RNA was measured by qPCR. (B and C) Posttransfection (24 h) HEK293T cells were infected for 2 h (MOI = 1) and then trypsinized, washed with PBS, and lysed, and the RNA was extracted. Levels of viral RNA were quantified from cDNA synthesized with (B) random hexamers (C) or only the forward primer selectively quantifying the negative sense RNA. Data are cumulative of three independent experiments performed in triplicate; mean and SEM are shown, and statistical significance was calculated by unpaired t test (*, P < 0.05; **, P < 0.01; ***, P < 0.001). (D) Surface plasmon resonance analysis of TMPRSS2 binding to individual serpins. A 2-fold dilution series of TMPRSS2 ranging from 125 nM down to 7.8 nM over immobilized SERPINE1 with results shown as response units (RU). Binding kinetics for all serpins are summarized to the right, including the natural target for SERPINE1, tissue plasminogen activator (tPA), as a positive control. (E) TMPRSS2-mediated S-protein cleavage in the presence or absence of individual serpins and the known protease inhibitor nafamostat mesylate. Data from three independent experiments were quantified, and a representative blot is shown. (F) The intensity of bands in panel E corresponding to cleaved S-protein was quantified using ImageJ (Fuji) and normalized to S-protein and TMPRSS2 control. Mean values and SEM are shown; statistical significance was calculated by unpaired t test (*, P < 0.05; **, P < 0.01). (G) HBEC ALI cultures were preincubated apically with recombinant SERPINE1, SERPINA1, or SERPINC1 and infected with SARS-CoV-2 at an MOI of 0.05. The accumulated viral release from the apical side was quantified by qPCR at the indicated time points (n = 3). Mean and SEM are shown; statistical significance was calculated by unpaired t test (*, P < 0.05; **, P < 0.01). (H) The concentrations of apically released SERPINA1 and SERPINE2 from HBEC ALI cultures from both group high and group low were determined by ELISA. The apical secretions were collected at three time points (n = 3). Mean and SEM are shown; statistical significance was calculated by unpaired t test (***, P < 0.001).
FIG 5
FIG 5
Single-cell RNA sequencing shows distinct expression patterns of serpins in primary lung cells. (A) Schematic illustration of cell types annotated in the single-cell RNA analysis of HBEC ALI cultures. (B) UMAP plot (bidimensional), colored by annotated cell clusters. (C) Coarse-grained graph showing mean cell cluster group expression for SERPINA1, SERPINE1, and SERPINE2. (D) Infection levels analyzed by qPCR and shown as fold increase over 12-h input. (E) Heatmap displaying the mean expression of SERPINA1, SERPINE1, and SERPINE2 upon SARS-CoV-2 infection (±, MOI = 0.05) in HBEC ALI cultures from a group high (H) and a group low (L) donor.

Similar articles

Cited by

References

    1. Wu Z, McGoogan JM. 2020. Characteristics of and important lessons from the coronavirus disease 2019 (COVID-19) outbreak in China: summary of a report of 72314 cases from the Chinese Center for Disease Control and Prevention. JAMA 323:1239–1242. doi:10.1001/jama.2020.2648. - DOI - PubMed
    1. Wu C, Chen X, Cai Y, Xia J, Zhou X, Xu S, Huang H, Zhang L, Zhou X, Du C, Zhang Y, Song J, Wang S, Chao Y, Yang Z, Xu J, Zhou X, Chen D, Xiong W, Xu L, Zhou F, Jiang J, Bai C, Zheng J, Song Y. 2020. Risk factors associated with acute respiratory distress syndrome and death in patients with coronavirus disease 2019 pneumonia in Wuhan, China. JAMA Intern Med 180:934–943. doi:10.1001/jamainternmed.2020.0994. - DOI - PMC - PubMed
    1. Zhou F, Yu T, Du R, Fan G, Liu Y, Liu Z, Xiang J, Wang Y, Song B, Gu X, Guan L, Wei Y, Li H, Wu X, Xu J, Tu S, Zhang Y, Chen H, Cao B. 2020. Clinical course and risk factors for mortality of adult inpatients with COVID-19 in Wuhan, China: a retrospective cohort study. Lancet 395:1054–1062. doi:10.1016/S0140-6736(20)30566-3. - DOI - PMC - PubMed
    1. Li X, Xu S, Yu M, Wang K, Tao Y, Zhou Y, Shi J, Zhou M, Wu B, Yang Z, Zhang C, Yue J, Zhang Z, Renz H, Liu X, Xie J, Xie M, Zhao J. 2020. Risk factors for severity and mortality in adult COVID-19 inpatients in Wuhan. J Allergy Clin Immunol 146:110–118. doi:10.1016/j.jaci.2020.04.006. - DOI - PMC - PubMed
    1. Ellinghaus D, Degenhardt F, Bujanda L, Buti M, Albillos A, Invernizzi P, Fernandez J, Prati D, Baselli G, Asselta R, Grimsrud MM, Milani C, Aziz F, Kassens J, May S, Wendorff M, Wienbrandt L, Uellendahl-Werth F, Zheng T, Yi X, de Pablo R, Chercoles AG, Palom A, Garcia-Fernandez AE, Rodriguez-Frias F, Zanella A, Bandera A, Protti A, Aghemo A, Lleo A, Biondi A, Caballero-Garralda A, Gori A, Tanck A, Carreras Nolla A, Latiano A, Fracanzani AL, Peschuck A, Julia A, Pesenti A, Voza A, Jimenez D, Mateos B, Nafria Jimenez B, Quereda C, Paccapelo C, Gassner C, Angelini C, Cea C, Solier A, et al. . 2020. Genomewide association study of severe Covid-19 with respiratory failure. N Engl J Med 383:1522–1534. - PMC - PubMed

Publication types