. 2023 Feb 1;62(2):894-904.
doi: 10.1093/rheumatology/keac272.

Identification and functional characterization of imbalanced osteoarthritis-associated fibronectin splice variants

Affiliations

Identification and functional characterization of imbalanced osteoarthritis-associated fibronectin splice variants

Marcella van Hoolwerff et al. Rheumatology (Oxford). .

Abstract

Objective: To identify FN1 transcripts associated with OA pathophysiology and investigate the downstream effects of modulating FN1 expression and relative transcript ratio.

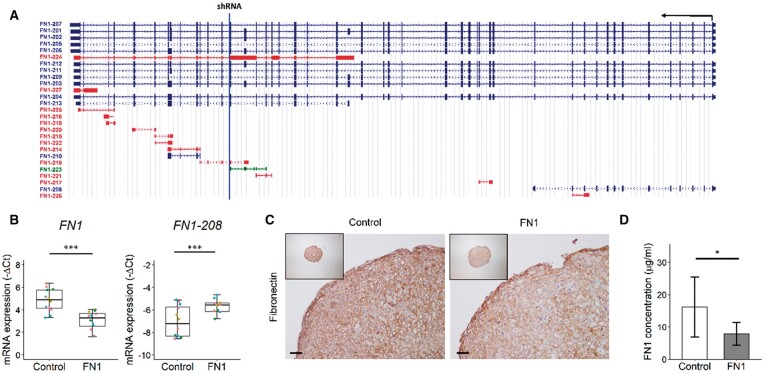
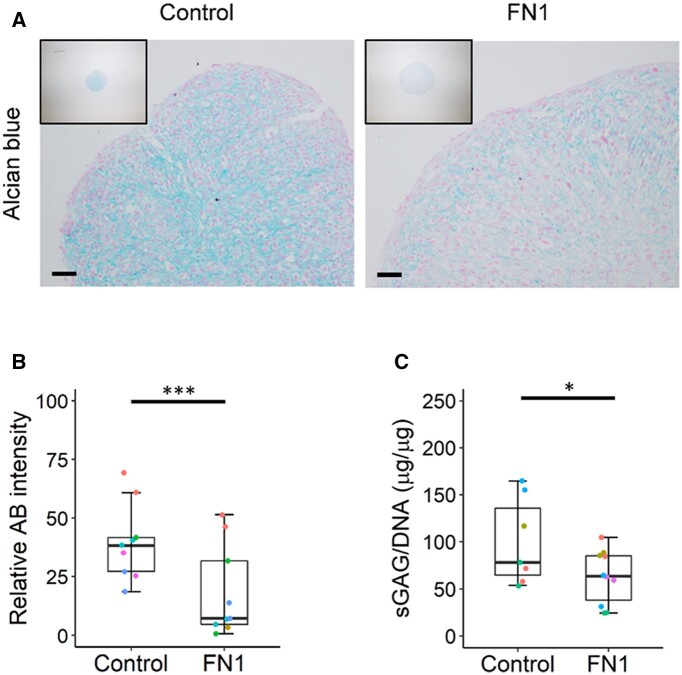
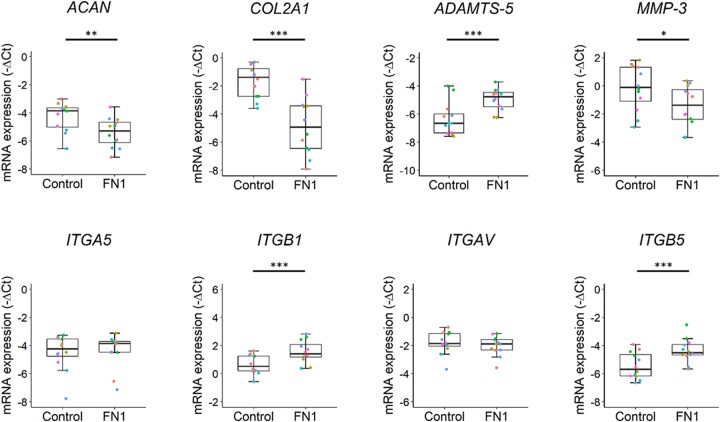
Methods: FN1 transcriptomic data was obtained from our previously assessed RNA-seq dataset of lesioned and preserved OA cartilage samples from the Research osteoArthritis Articular Cartilage (RAAK) study. Differential transcript expression analysis was performed on all 27 FN1 transcripts annotated in the Ensembl database. Human primary chondrocytes were transduced with lentiviral particles containing short hairpin RNA (shRNA) targeting full-length FN1 transcripts or non-targeting shRNA. Subsequently, matrix deposition was induced in our 3D in vitro neo-cartilage model. Effects of changes in the FN1 transcript ratio on sulphated glycosaminoglycan (sGAG) deposition were investigated by Alcian blue staining and dimethylmethylene blue assay. Moreover, gene expression levels of 17 cartilage-relevant markers were determined by reverse transcription quantitative polymerase chain reaction.

Results: We identified 16 FN1 transcripts differentially expressed between lesioned and preserved cartilage. FN1-208, encoding migration-stimulating factor, was the most significantly differentially expressed protein coding transcript. Downregulation of full-length FN1 and a concomitant increased FN1-208 ratio resulted in decreased sGAG deposition as well as decreased ACAN and COL2A1 and increased ADAMTS-5, ITGB1 and ITGB5 gene expression levels.

Conclusion: We show that full-length FN1 downregulation and concomitant relative FN1-208 upregulation was unbeneficial for deposition of cartilage matrix, likely due to decreased availability of the classical RGD (Arg-Gly-Asp) integrin-binding site of fibronectin.

Keywords: FN1; OA; alternative splicing; cartilage; chondrogenesis; fibronectin; migration-stimulating factor.


Figures

<sc>Fig.</sc> 1
Fig. 1
Downregulation of FN1 gene and protein expression in neo-cartilage pellets after 3 days of chondrogenesis (A) Schematic representation of FN1 transcripts, which are transcribed from the antisense strand, represented by the black arrow. The blue line represents the location of the target sequence of the shRNA targeting FN1 transcripts. Blue transcripts are protein coding, red and green transcripts are non-protein coding. Source: https://genome.ucsc.edu/. (B) Gene expression levels depicted by boxplots of −ΔCt values of FN1 and FN1-208 ratio relative to all full-length FN1 transcripts in neo-cartilage pellets of primary chondrocytes transduced with non-targeting shRNA (control) and FN1 targeting shRNA (FN1). Individual samples are represented by coloured dots; colours of dots represent the different donors (n = 12). (C) Representative images of fibronectin staining of control and FN1 downregulated pellets, confirming FN1 downregulation on the protein level. Scale bar = 50 µm. (D) Fibronectin concentration in conditioned medium in the control (n = 6) and FN1 group (n = 5), as determined by ELISA. Data are mean (s.d.). P-values were determined by GEEs, with experimental readout as the dependent variable and donor and group as covariates. *P < 0.05, ***P < 0.005. Colour version is available at Rheumatology online.
<sc>Fig.</sc> 2
Fig. 2
Decreased overall FN1 expression and change of FN1 transcript ratios results in decreased matrix deposition (A) Representative images of Alcian blue staining of neo-cartilage pellets of primary chondrocytes transduced with non-targeting shRNA (control) and FN1 targeting shRNA (FN1). (B) Quantification of Alcian blue (AB) pixel intensity staining of control and FN1 targeting shRNA transduced pellets (n = 9). Colours of dots represent the different donors. (C) sGAG content normalized to DNA content in pellets of the control (n = 7) and FN1 group (n = 11) analysed by dimethylmethylene blue assay. P-values were determined by GEEs, with experimental readout as the dependent variable and donor and group as covariates. *P < 0.05, ***P < 0.005. Colour version is available at Rheumatology online.
<sc>Fig.</sc> 3
Fig. 3
Decreased FN1 expression and change of FN1 transcript ratios results in catabolic chondrocyte metabolism. Boxplots of −ΔCt values of cartilage matrix–relevant genes ACAN, COL2A1, ADAMTS-5, MMP-3, ITGA5, ITGB1, ITGAV and ITGB5 in neo-cartilage pellets of primary chondrocytes transduced with non-targeting shRNA (control) (n = 12) and FN1 targeting shRNA (FN1) (n = 12). Individual samples are represented by coloured dots; colours of dots represent the different donors. P-values were determined by GEEs, with experimental readout as the dependent variable and donor and group as covariates. *P < 0.05, **P < 0.01, ***P < 0.005. Colour version is available at Rheumatology online.
<sc>Fig.</sc> 4
Fig. 4
Identification of new FN1 downstream genes. (A) Protein–protein interactions between the genes with correlations r > 0.8 with FN1 in preserved and lesioned OA cartilage samples, as determined with STRING. (B) Boxplots of −ΔCt values of connected genes to FN1, ANKH, NT5E and TNFRSF11B in neo-cartilage pellets of primary chondrocytes transduced with non-targeting shRNA (control) (n = 12) and FN1 targeting shRNA (FN1) (n = 12). Individual samples are represented by coloured dots; colours of dots represent the different donors. P-values were determined by GEEs, with experimental readout as the dependent variable and donor and group as covariates. ***P < 0.005. Colour version is available at Rheumatology online.

References

    1. Litwic A, Edwards MH, Dennison EM, Cooper C.. Epidemiology and burden of osteoarthritis. Br Med Bull 2013;105:185–99. - PMC - PubMed
    1. Loeser RF, Goldring SR, Scanzello CR, Goldring MB.. Osteoarthritis: a disease of the joint as an organ. Arthritis Rheum 2012;64:1697–707. - PMC - PubMed
    1. Goldring SR, Goldring MB.. Changes in the osteochondral unit during osteoarthritis: structure, function and cartilage-bone crosstalk. Nat Rev Rheumatol 2016;12:632–44. - PubMed
    1. Coutinho de Almeida R, Ramos YFM, Mahfouz A. et al. RNA sequencing data integration reveals an miRNA interactome of osteoarthritis cartilage. Ann Rheum Dis 2019;78:270–7. - PMC - PubMed
    1. Aki T, Hashimoto K, Ogasawara M, Itoi E.. A whole-genome transcriptome analysis of articular chondrocytes in secondary osteoarthritis of the hip. PLoS One 2018;13:e0199734. - PMC - PubMed

Publication types