. 2022 Jun 29;10(3):e0195321.
doi: 10.1128/spectrum.01953-21. Epub 2022 May 9.

Deploying an In Vitro Gut Model to Assay the Impact of the Mannan-Oligosaccharide Prebiotic Bio-Mos on the Atlantic Salmon (Salmo salar) Gut Microbiome

Affiliations

Deploying an In Vitro Gut Model to Assay the Impact of the Mannan-Oligosaccharide Prebiotic Bio-Mos on the Atlantic Salmon (Salmo salar) Gut Microbiome

Raminta Kazlauskaite et al. Microbiol Spectr. .

Abstract

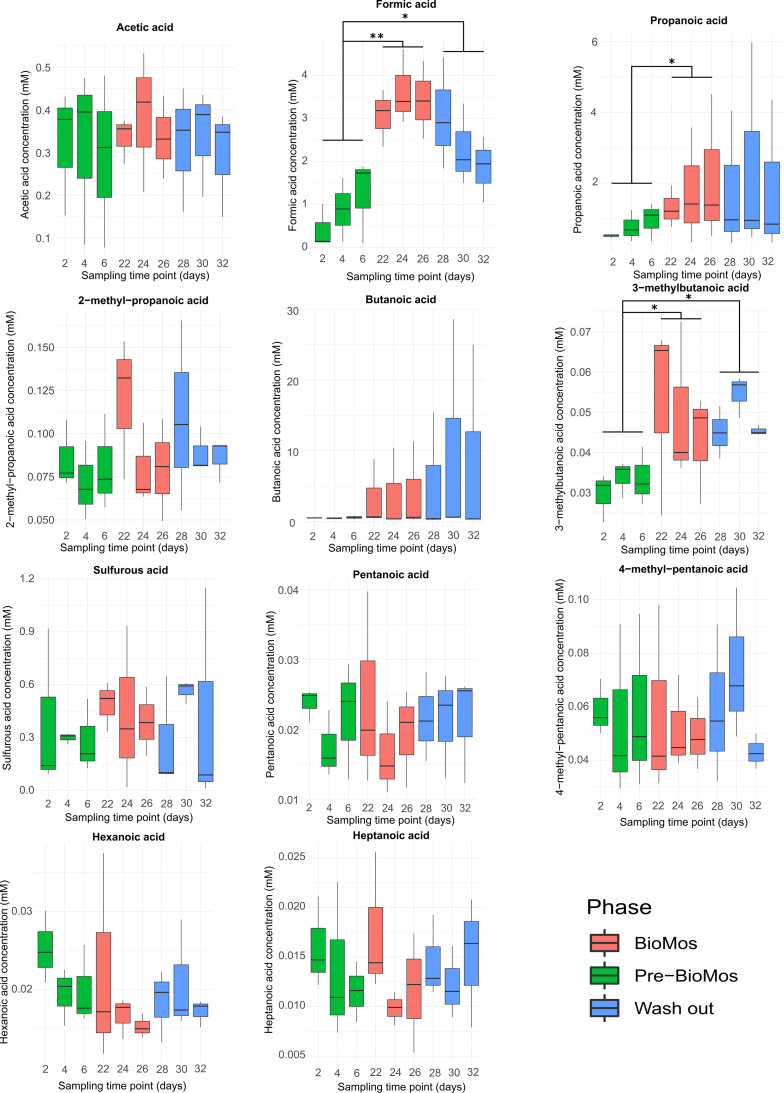
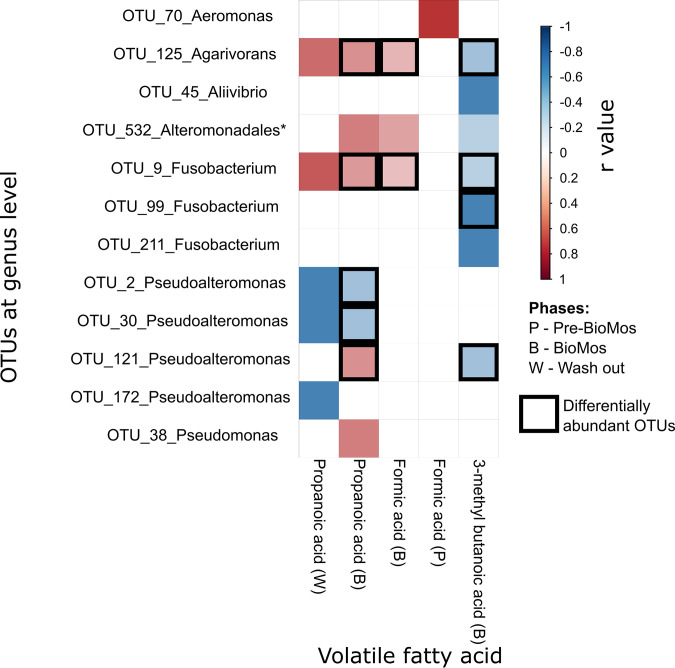
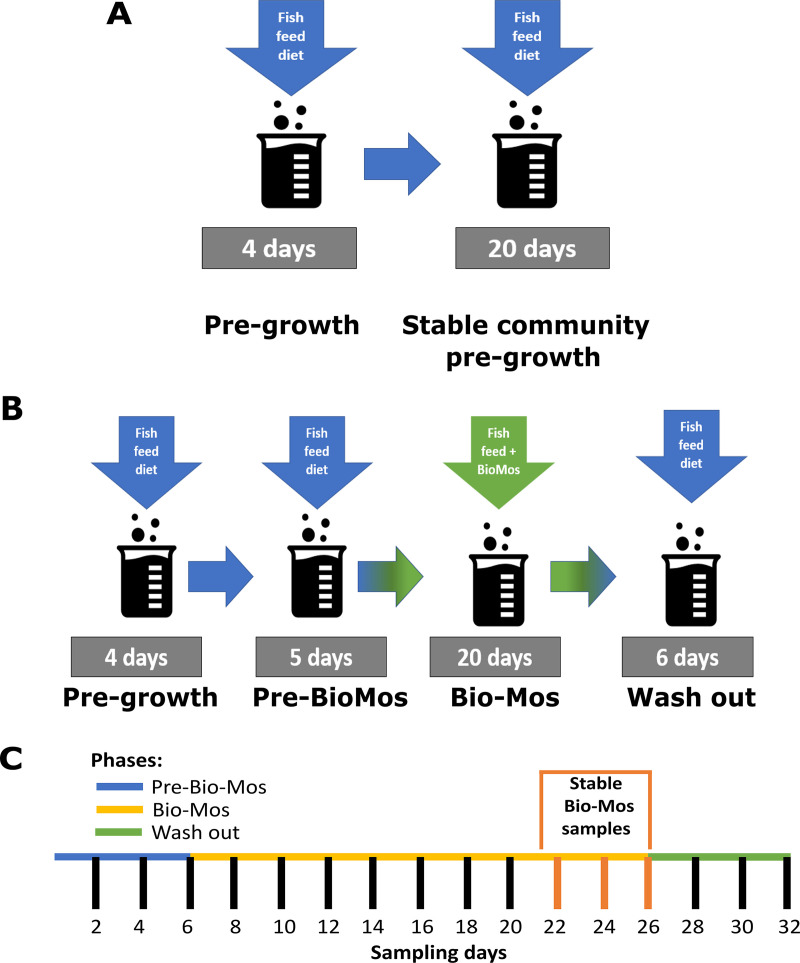
Alpha mannose-oligosaccharide (MOS) prebiotics are widely deployed in animal agriculture as immunomodulators as well as to enhance growth and gut health. Their mode of action is thought to be mediated through their impact on host microbial communities and their associated metabolism. Bio-Mos is a commercially available prebiotic currently used in the agri-feed industry, but studies show contrasting results of its effect on fish performance and feed efficiency. Thus, detailed studies are needed to investigate the effect of MOS supplements on the fish microbiome to enhance our understanding of the link between MOS and gut health. To assess Bio-Mos for potential use as a prebiotic growth promoter in salmonid aquaculture, we have modified an established Atlantic salmon in vitro gut model, SalmoSim, to evaluate its impact on the host microbial communities. The microbial communities obtained from ceca compartments from four adult farmed salmon were inoculated in biological triplicate reactors in SalmoSim. Prebiotic treatment was supplemented for 20 days, followed by a 6-day washout period. Inclusion of Bio-Mos in the media resulted in a significant increase in formate (P = 0.001), propionate (P = 0.037) and 3-methyl butanoic acid (P = 0.024) levels, correlated with increased abundances of several, principally, anaerobic microbial genera (Fusobacterium, Agarivorans, Pseudoalteromonas). DNA metabarcoding with the 16S rDNA marker confirmed a significant shift in microbial community composition in response to Bio-Mos supplementation with observed increase in lactic acid producing Carnobacterium. In conjunction with previous in vivo studies linking enhanced volatile fatty acid production alongside MOS supplementation to host growth and performance, our data suggest that Bio-Mos may be of value in salmonid production. Furthermore, our data highlights the potential role of in vitro gut models to complementin vivo trials of microbiome modulators. IMPORTANCE In this paper we report the results of the impact of a prebiotic (alpha-MOS supplementation) on microbial communities, using an in vitro simulator of the gut microbial environment of the Atlantic salmon. Our data suggest that Bio-Mos may be of value in salmonid production as it enhances volatile fatty acid production by the microbiota from salmon pyloric ceca and correlates with a significant shift in microbial community composition with observed increase in lactic acid producing Carnobacterium. In conjunction with previous in vivo studies linking enhanced volatile fatty acid production alongside MOS supplementation to host growth and performance, our data suggest that Bio-Mos may be of value in salmonid production. Furthermore, our data highlights the potential role of in vitro gut models to augment in vivo trials of microbiome modulators.

Keywords: Atlantic salmon; MOS; NGS; gut model; in vitro; microbiome.


Conflict of interest statement

The authors declare no conflict of interest.

Figures

FIG 1
FIG 1
Alpha-diversity dynamics within the SalmoSim system during exposure to Bio-Mos prebiotics. The figure represents different alpha diversity outputs at different sampling time points (days) from SalmoSim system. Time point 0 represents microbial community composition within initial SalmoSim inoculum from the pregrown stable bacterial communities, time points 2–6 identifies samples from SalmoSim system fed on Fish meal diet alone (Pre-Bio-Mos: green), time points 8–26 identifies samples from SalmoSim system fed on Fish meal diet with addition of Bio-Mos (Bio-Mos: red), and time points 28–32 identifies samples from wash out period while SalmoSim was fed on feed without addition of prebiotic (Wash out: blue). A: visually represents effective richness (number of OTUs), B: represents effective Shannon diversity.
FIG 2
FIG 2
Beta diversity plots visualizing bacterial communities’ dissimilarities within the SalmoSim bioreactors during exposure to Bio-Mos prebiotic. In the PCoA plots, Bray-Curtis distance was used between samples originating from different experimental phases (Inoculum, Pre-Bio-Mos, Bio-Mos and Wash out), annotated with sampling time points and biological replicates. A: represents all sequenced data together for all 3 biological replicates in which different colors represent different biological replicates (samples from pyloric cecum from 3 different fish) and different shapes represent different experimental phases (Inoculum, Pre-Bio-Mos, Bio-Mos and Wash out); B-D: represent sequenced data for each individual biological replicate (B: Fish 1, C: Fish 2, D: Fish 3). In figures B-D: different colors represent different sampling time points and different shapes represent different experimental phases (Inoculum, Pre-Bio-Mos, Bio-Mos and Wash out). Dim 1 is principal coordinate 1 and Dim 2 is principle coordinate 2.
FIG 3
FIG 3
Microbial composition (25 most common genus + others) among different biological replicates and experimental phases Labels on x axis in green represent samples from Pre-Bio-Mos phases, in red samples fed on Bio-Mos phase and in blue samples from Wash out period. Only subset of time points is visualized for each phase: time points 2–6 for Pre-Bio-Mos, 8–12 and 22–24 for Bio-Mos, and 28–32 for Wash out.
FIG 4
FIG 4
Differential abundance of OTUs grouped at genus level between different experimental phases (Pre-Bio-Mos, Bio-Mos and Wash out) Differential abundant OTUs grouped at genus level between different experimental phases: Pre-Bio-Mos versus Bio-Mos (A), Bio-Mos versus Wash out (B). Red and blue represents statistically significant (P < 0.05) decrease and increase, respectively, between the experimental phases compared.
FIG 5
FIG 5
VFA responses in SalmoSim pyloric cecum compartment after Bio-Mos introduction and subsequent wash out period. The figure above visually represents 11 volatile fatty acid production in three different experimental phases: (i) SalmoSim fed on Fish meal alone without prebiotic addition (Pre-Bio-Mos: green), (ii) SalmoSim fed on Fish meal with addition of Bio-Mos (Bio-Mos: red), (iii) wash out period during which SalmoSim was fed on Fish meal without Bio-Mos (Wash out: blue). x axis represents the concentration of specific volatile fatty acid (mM) while the y axis represents different sampling time points (days). The lines above bar plots represent statistically significant differences between different experimental phases. The asterisks show significance: *, 0.01 ≤ P < 0.05; **, 0.05 ≤ P < 0.001; ***, P ≤ 0.001.
FIG 6
FIG 6
Pearson correlation coefficients across VFAs and taxonomic variables Statistically significant (P < 0.05) and strongly correlated (r > 0.8) Pearson correlation coefficients across a set of VFAs (that showed statistically significant change between feeds: propanoic, formic and 3-methyl butanoic acids) and taxonomic variables (OTUs summarized at genus level apart from * to order level) are shown in various experimental phases (Pre-Bio-Mos, Bio-Mos and Wash out). Blue color represents negative correlation and red color represents positive correlations, respectively. The boxes indicate that these OTUs in differential abundance analysis showed statistically significant increase from Pre-Bio-Mos to Bio-Mos phase.
FIG 7
FIG 7
Artificial gut model system set-up and in vitro trial set up. The SalmoSim system designed to run in biological triplicate.
FIG 8
FIG 8
In vitro trial setup. (A) Stable community pregrowth run within the SalmoSim system; (B) main experimental run that involved four stages: (i) pregrowth (without feed transfer for 4 days), (ii) feeding system with Fish meal (Pre-Bio-Mos: 5 days), (iii) feeding system with Fish meal diet supplemented with Bio-Mos (Bio-Mos: 20 days), (iv) wash out period during which system was fed Fish meal without the addition of prebiotic (Wash out: 6 days); (C) SalmoSim sampling time points, which include definition of stable time points for Bio-Mos phase (days 22, 24, and 26 -once bacterial communities had time to adapt to Bio-Mos addition).
FIG 9
FIG 9
Ammonia (NH3) concentration in SalmoSim pyloric cecum compartment throughout experiment. Ammonia (NH3) production in three different experimental phases: (i) SalmoSim fed on Fish meal alone without prebiotic addition (Pre-Bio-Mos: green), (ii) SalmoSim fed on Fish meal with addition of Bio-Mos (Bio-Mos: red), (iii) wash out period during which SalmoSim was fed on Fish meal without Bio-Mos (Wash out: blue). x axis represents the concentration of ammonia (μg/mL) while the y axis represents different sampling time points (days). The lines above bar plots represent statistically significant differences between sequential time points. The asterisks show significance: (*, 0.01 ≤ P < 0.05; **, 0.05 ≤ P < 0.001; ***, P ≤ 0.001).

Similar articles

Cited by

References

    1. FAO. 2018. The State of Fisheries and Aquaculture in the world 2018Fao.
    1. Kennedy DA, Kurath G, Brito IL, Purcell MK, Read AF, Winton JR, Wargo AR. 2016. Potential drivers of virulence evolution in aquaculture. Evol Appl 9:344–354. doi:10.1111/eva.12342. - DOI - PMC - PubMed
    1. Adams CE, Turnbull JF, Bell A, Bron JE, Huntingford FA. 2007. Multiple determinants of welfare in farmed fish: stocking density, disturbance, and aggression in Atlantic salmon (Salmo salar). Can J Fish Aquat Sci. doi:10.1139/F07-018. - DOI
    1. Turnbull J, Bell A, Adams C, Bron J, Huntingford F. 2005. Stocking density and welfare of cage farmed Atlantic salmon: application of a multivariate analysis. Aquaculture 243:121–132. doi:10.1016/j.aquaculture.2004.09.022. - DOI
    1. Ringø E, Olsen RE, Gifstad T, Dalmo RA, Amlund H, Hemre GI, Bakke AM. 2010. Prebiotics in aquaculture: a review. Aquac Nutr.

Publication types

LinkOut - more resources