. 2022 Jun 29;10(3):e0061622.
doi: 10.1128/spectrum.00616-22. Epub 2022 May 9.

Dysbiosis in the Gut Microbiota in Patients with Inflammatory Bowel Disease during Remission

Affiliations

Dysbiosis in the Gut Microbiota in Patients with Inflammatory Bowel Disease during Remission

Anthea Pisani et al. Microbiol Spectr. .

Abstract

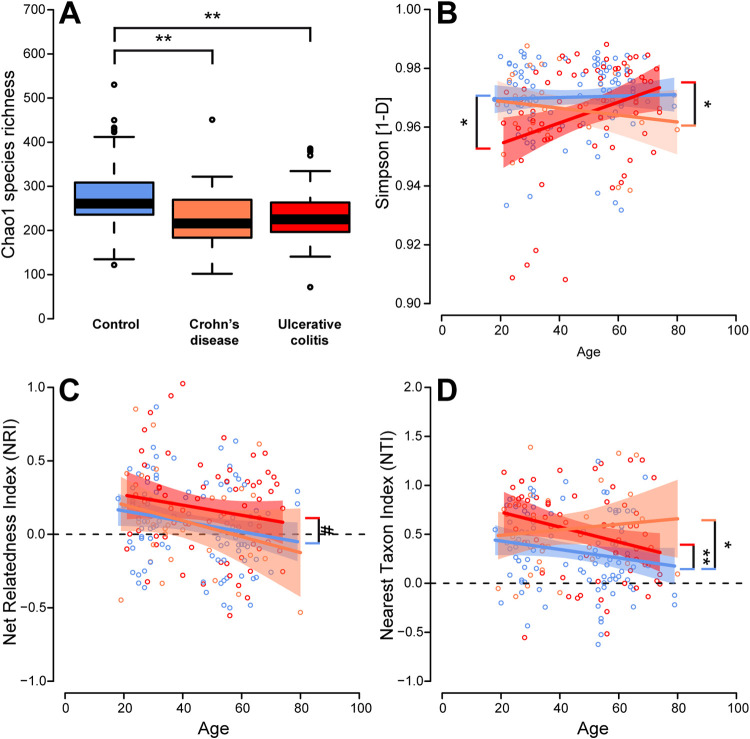
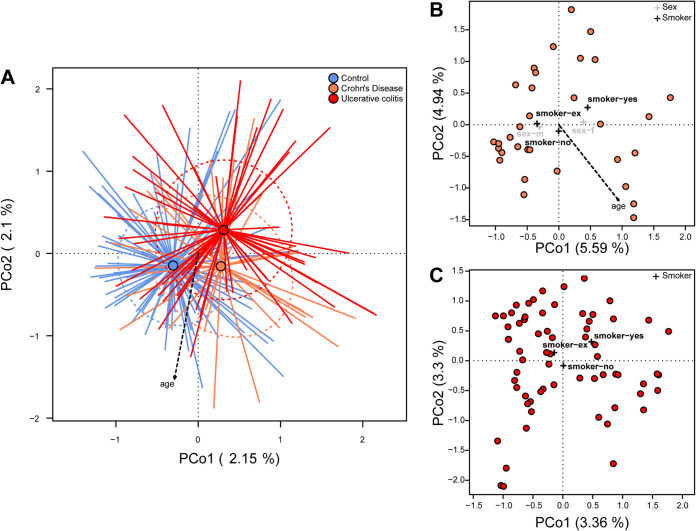
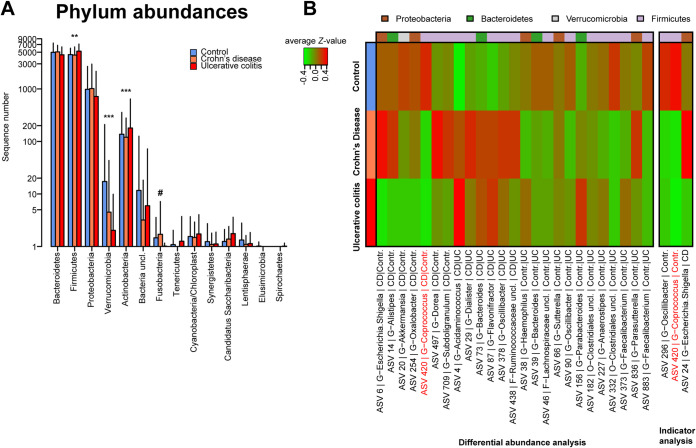
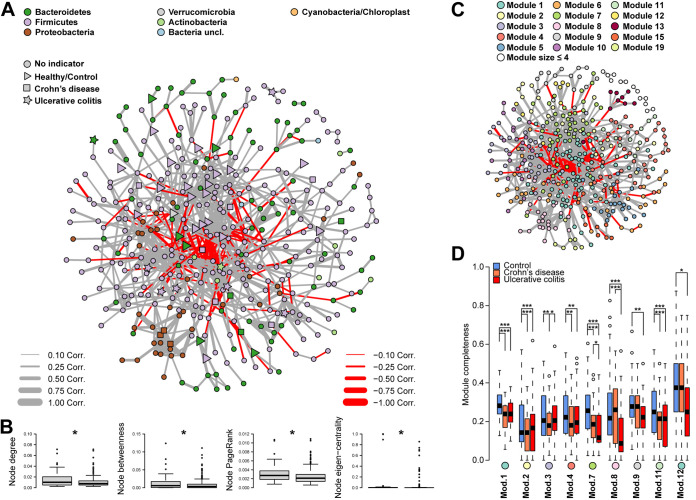
Inflammatory bowel disease (IBD) is a chronic, relapsing, inflammatory disorder which comprises two main conditions: Crohn's disease (CD) and ulcerative colitis (UC). Although the etiology of IBD has not been fully elucidated, the gut microbiota is hypothesized to play a vital role in its development. The aim of this cross-sectional study was to characterize the fecal microbiota in CD or UC patients in a state of remission to reveal potential factors sustaining residual levels of inflammation and triggering disease relapses. Ninety-eight IBD patients in a state of clinical remission (66 UC, 32 CD) and 97 controls were recruited, and stool samples, as well as detailed patient data, were collected. After DNA extraction, the variable regions V1 and V2 of the 16S rRNA gene were amplified and sequenced. Patients with IBD had a decrease in alpha diversity compared to that of healthy controls, and the beta diversity indices showed dissimilarity between the cohorts. Healthy controls were associated with the beneficial organisms unclassified Akkermansia species (Akkermansia uncl.), Oscillibacter uncl., and Coprococcus uncl., while flavonoid-degrading bacteria were associated with IBD. Network analysis identified highly central and influential disease markers and a strongly correlated network module of Enterobacteriaceae which was associated with IBD and could act as drivers for residual inflammatory processes sustaining and triggering IBD, even in a state of low disease activity. The microbiota in IBD patients is significantly different from that of healthy controls, even in a state of remission, which implicates the microbiota as an important driver of chronicity in IBD. IMPORTANCE Dysbiosis in inflammatory bowel disease (IBD) has been implicated as a causal or contributory factor to the pathogenesis of the disease. This study, done on patients in remission while accounting for various confounding factors, shows significant community differences and altered community dynamics, even after acute inflammation has subsided. A cluster of Enterobacteriaceae was linked with Crohn's disease, suggesting that this cluster, which contains members known to disrupt colonization resistance and form biofilms, persists during quiescence and can lead to chronic inflammation. Flavonoid-degrading bacteria were also associated with IBD, raising the possibility that modification of dietary flavonoids might induce and maintain remission in IBD.

Keywords: Enterobacteriaceae; dysbiosis; flavonoid-degrading bacteria; inflammatory bowel disease; microbiota; remission.


Conflict of interest statement

The authors declare no conflict of interest.

Figures

FIG 1
FIG 1
(A) Alpha diversity via the Chao1 species richness in the different cohorts showing a lower alpha diversity in patients with IBD than in controls. (B) Correlation of Simpson diversity with age for the different cohorts. (C and D) Correlation of the phylogenetic measures net relatedness index (NRI) and nearest taxon index (NTI) with age for the different disease cohorts. The dashed line marks the cutoff between phylogenetic overdispersion and phylogenetic clustering (*, P ≤ 0.050; **, P ≤ 0.010; ***, P ≤ 0.001; #, P ≤ 0.1000). Correlation of community diversity and age within the respective patient groups has been assessed for Simpson diversity (R2Con. = 0.00110, R2UC = 0.09695, R2CD = 0.0266), NRI (R2Con. = 0.04094, R2UC = 0.02767, R2CD = 0.07245), and NTI (R2Con. = 0.03094, R2UC = 0.07355, R2CD = 0.01193).
FIG 2
FIG 2
(A) Principal coordinate analysis (PCoA) of Bray-Curtis dissimilarity with respect to IBD status, including the significant correlation of community distance with age (Table 2). The tips of the colored lines each characterize a sample of a specific IBD status (blue, orange, and red representing controls, CD, and UC, respectively). The point where the lines converge, shown as a dot, depicts the center of weight of the respective cohort (centroid). The distance between the centers of weight visualizes the average dissimilarity between the IBD pathologies. Arrows point in the direction of increasing values for that variable, so the lower the PCo1, the greater the age. The amount of variation captured by the respective dimension/axis is shown for the first two axes. (B) PCoA to visualize community differences among only CD patients and (C) UC patients (Appendix Table A3). Crosses indicate the centroid for the nominal significant parameters as detected via permutative ANOVA (PERMANOVA). See Fig. A4 for PCoA of controls.
FIG 3
FIG 3
(A) Phylum abundances with respect to IBD status/health condition analyzed via DESeq2. Firmicutes (PFDR = 0.00264) and Actinobacteria (PFDR = 0.00005) are more abundant in UC patients, while Fusobacteria are increased in CD patients (PFDR = 0.05931) and Verrucomicrobia are more abundant in healthy controls (PFDR = 7.42962 × 10−11). (B) Heatmap showing significantly differentially abundant and indicative bacteria (Appendix Tables A5 and A6). *, P ≤ 0.050; **, P ≤ 0.010; ***, P ≤ 0.001; #, P ≤ 0.1000.
FIG 4
FIG 4
(A) Species level ASV correlation network based on SparCC. (B) Comparison of different average node centralities (degree, betweenness, PageRank, and eigenvector centrality) between IBD indicators and nonindicators tested via permutative Wilcoxon test (PFDR ≤ 0.05). (C) Community modules as detected via the fast-greedy algorithm and (D) the association of these community modules to disease are demonstrated by showing the average completeness of the respective module in the respective cohort (*, P ≤ 0.050; **, P ≤ 0.010; ***, P ≤ 0.001; #, P ≤ 0.1000; Appendix Tables A10 and A11).

Similar articles

Cited by

References

    1. Sender R, Fuchs S, Milo R. 2016. Are we really vastly outnumbered? Revisiting the ratio of bacterial to host cells in humans. Cell 164:337–340. doi:10.1016/j.cell.2016.01.013. - DOI - PubMed
    1. Flint HJ, Scott KP, Duncan SH, Louis P, Forano E. 2012. Microbial degradation of complex carbohydrates in the gut. Gut Microbes 3:289–306. doi:10.4161/gmic.19897. - DOI - PMC - PubMed
    1. Metges CC. 2000. Contribution of microbial amino acids to amino acid homeostasis of the host. J Nutr 130:1857S–1864S. doi:10.1093/jn/130.7.1857S. - DOI - PubMed
    1. Hooper LV, Midtvedt T, Gordon JI. 2002. How host-microbial interactions shape the nutrient environment of the mammalian intestine. Annu Rev Nutr 22:283–307. doi:10.1146/annurev.nutr.22.011602.092259. - DOI - PubMed
    1. Bouskra D, Brézillon C, Bérard M, Werts C, Varona R, Boneca IG, Eberl G. 2008. Lymphoid tissue genesis induced by commensals through NOD1 regulates intestinal homeostasis. Nature 456:507–510. doi:10.1038/nature07450. - DOI - PubMed

Publication types