. 2022 Jul 4;221(7):e202109013.
doi: 10.1083/jcb.202109013. Epub 2022 May 9.

Induced nanoscale membrane curvature bypasses the essential endocytic function of clathrin

Affiliations

Induced nanoscale membrane curvature bypasses the essential endocytic function of clathrin

Robert C Cail et al. J Cell Biol. .

Abstract

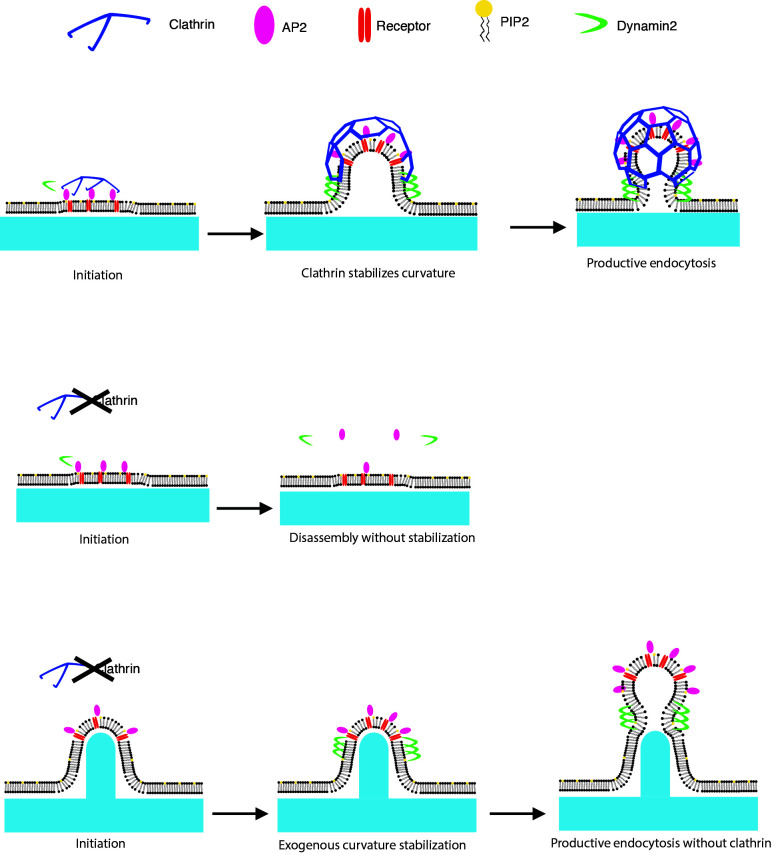
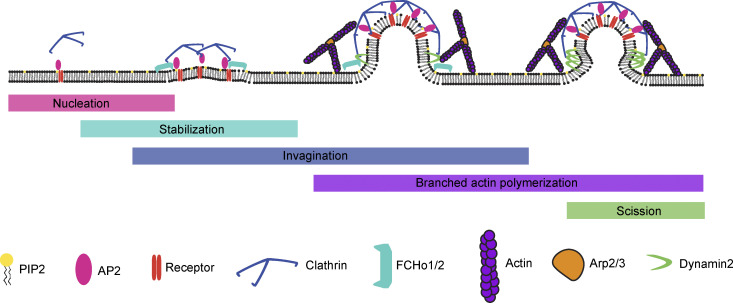
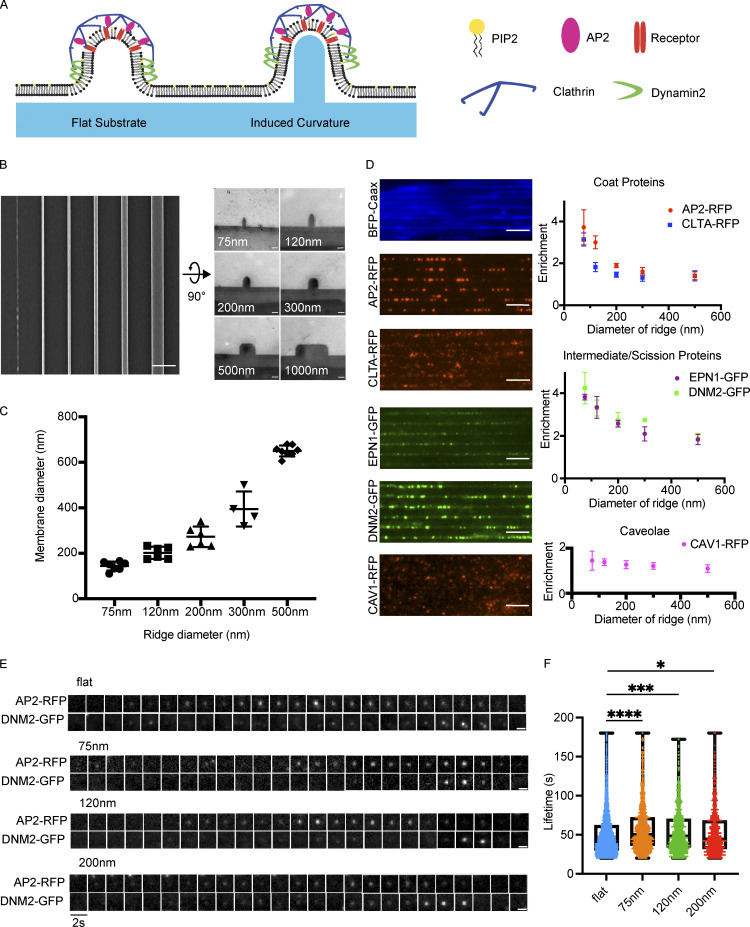
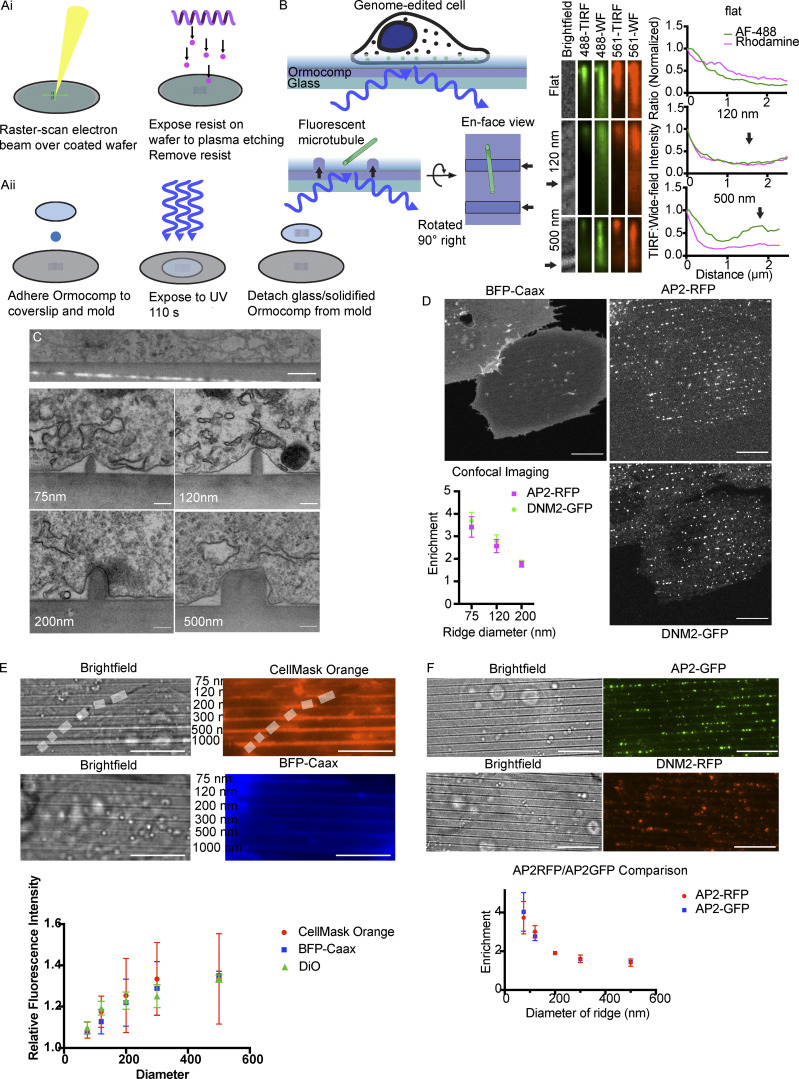
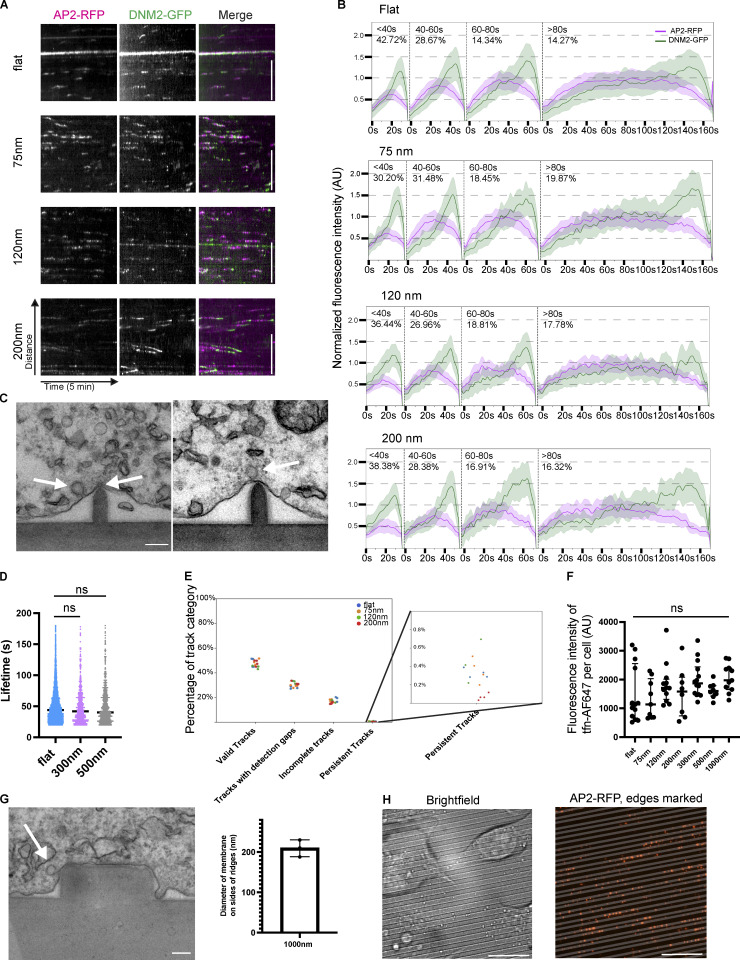
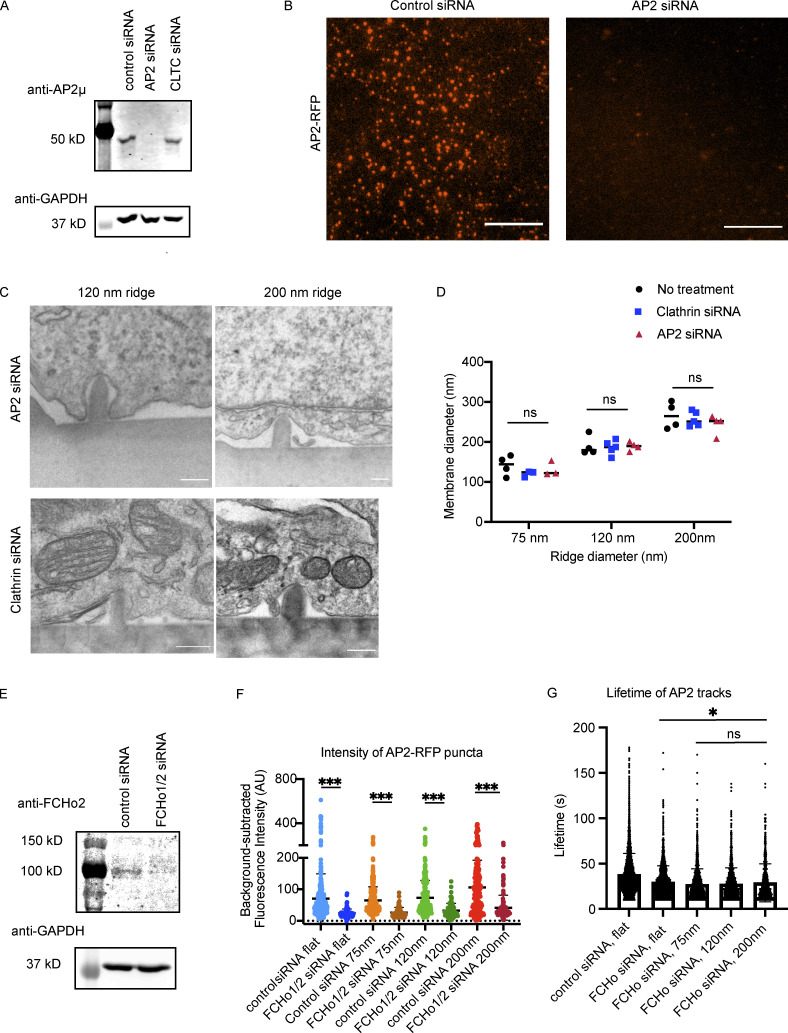
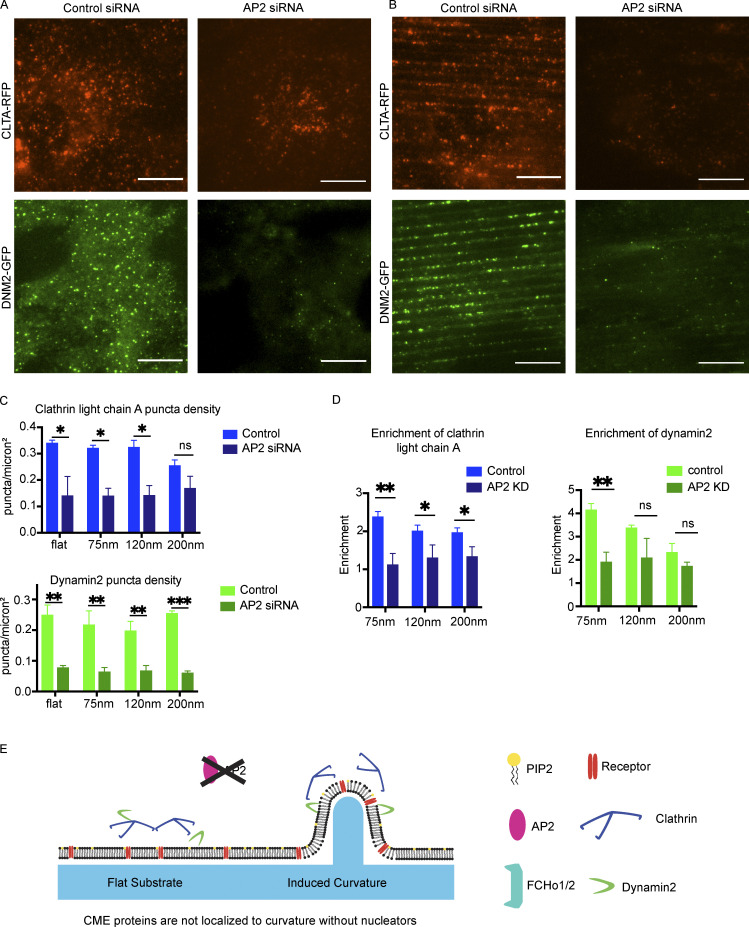
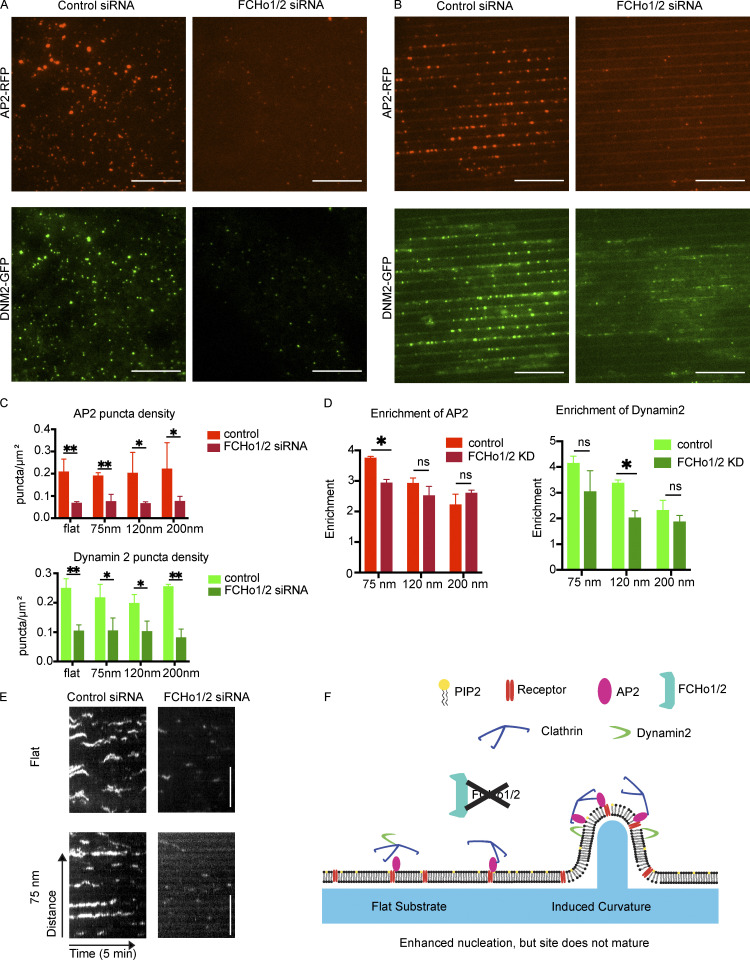
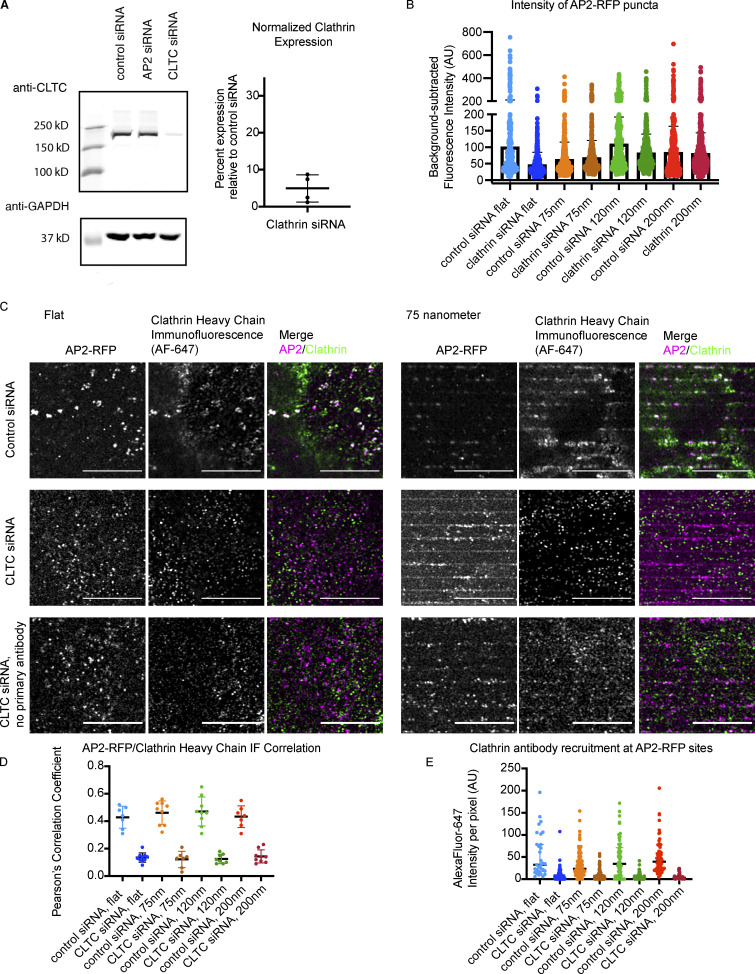
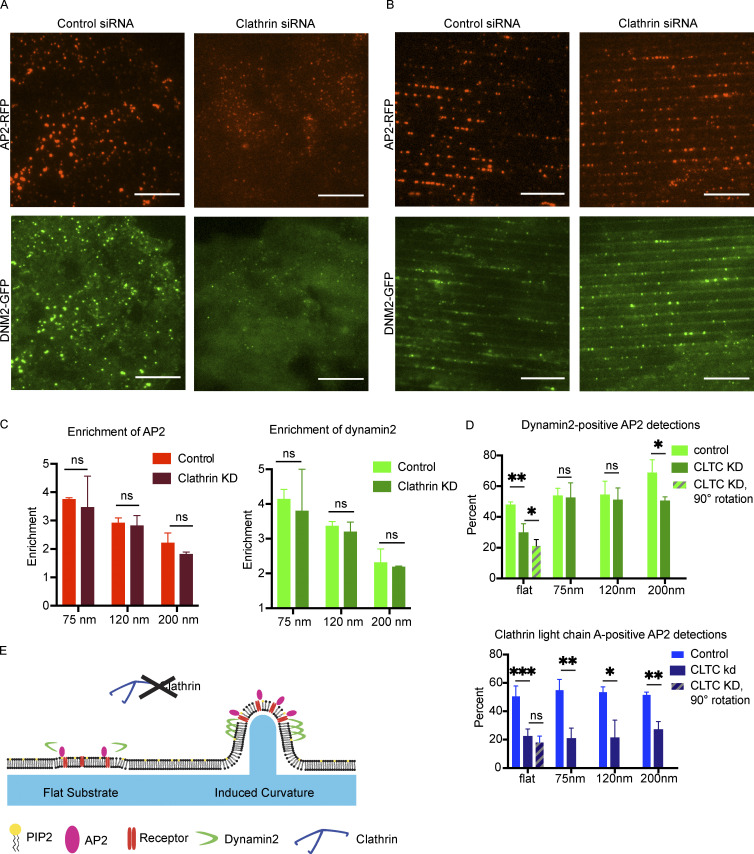
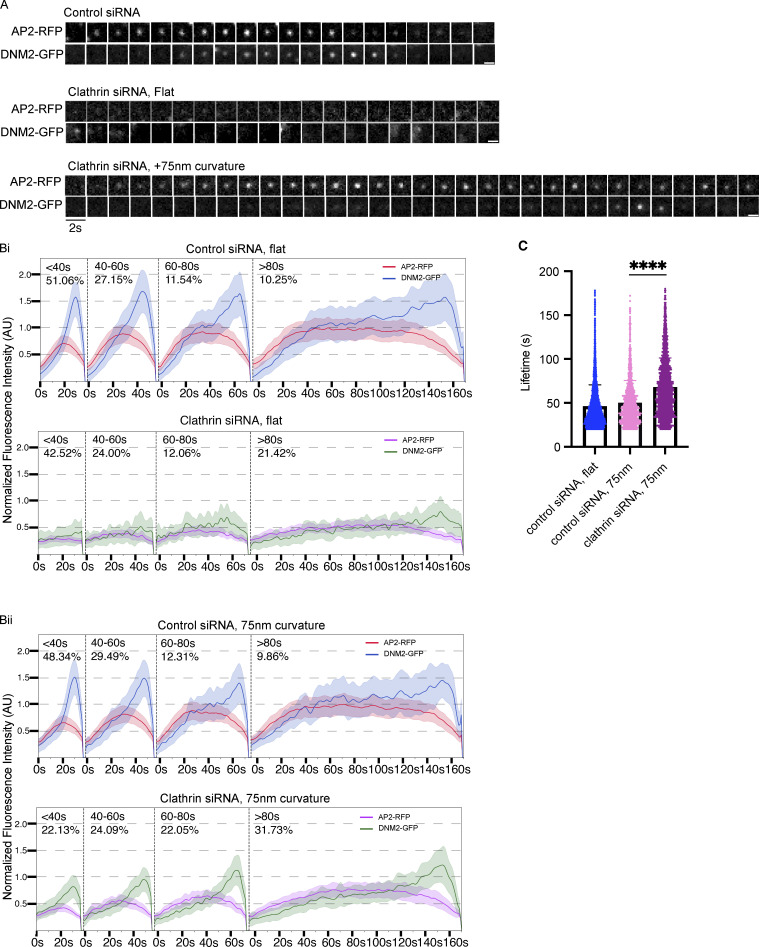
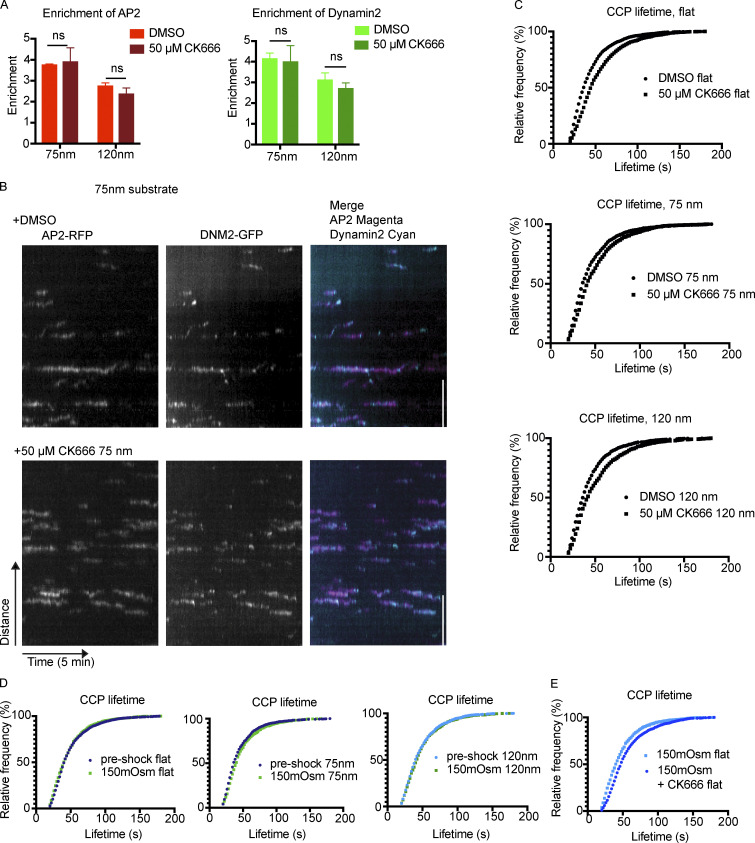
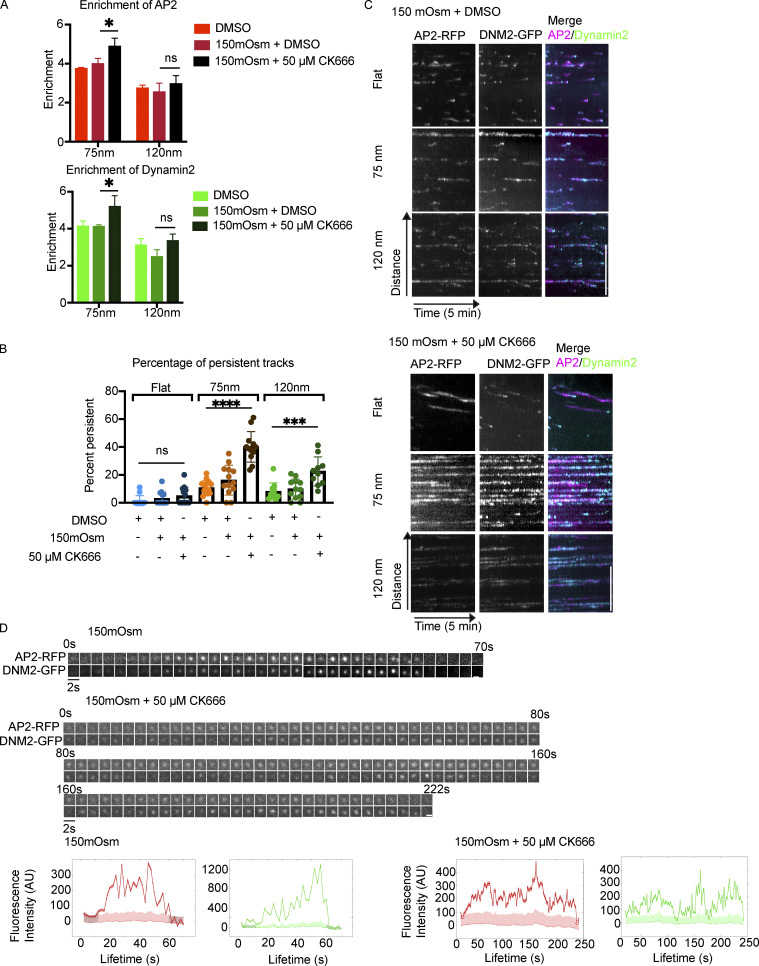
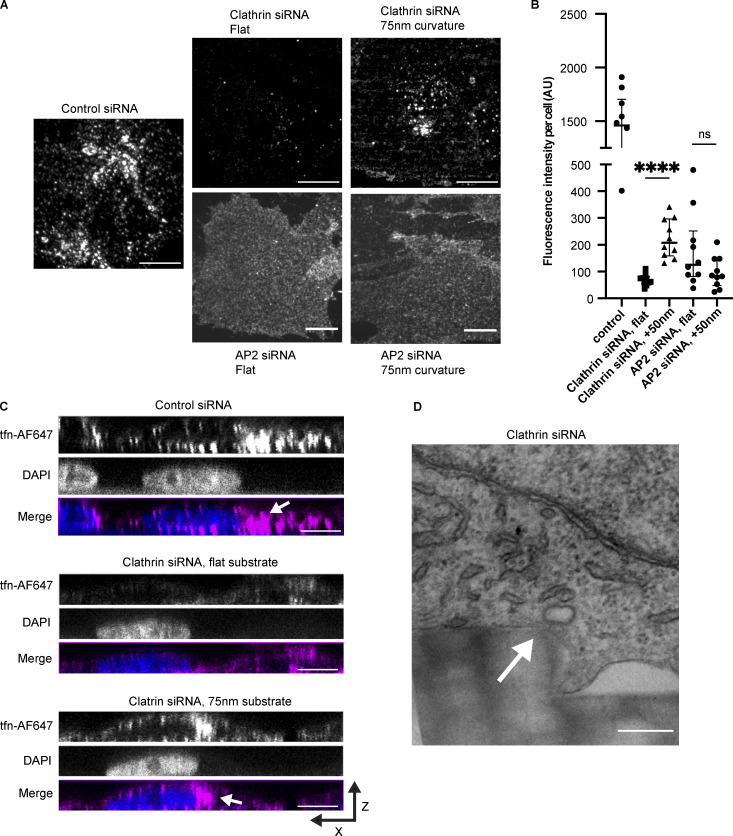
During clathrin-mediated endocytosis (CME), flat plasma membrane is remodeled to produce nanometer-scale vesicles. The mechanisms underlying this remodeling are not completely understood. The ability of clathrin to bind membranes of distinct geometries casts uncertainty on its specific role in curvature generation/stabilization. Here, we used nanopatterning to produce substrates for live-cell imaging, with U-shaped features that bend the ventral plasma membrane of a cell into shapes resembling energetically unfavorable CME intermediates. This induced membrane curvature recruits CME proteins, promoting endocytosis. Upon AP2, FCHo1/2, or clathrin knockdown, CME on flat substrates is severely diminished. However, induced membrane curvature recruits CME proteins in the absence of FCHo1/2 or clathrin and rescues CME dynamics/cargo uptake after clathrin (but not AP2 or FCHo1/2) knockdown. Induced membrane curvature enhances CME protein recruitment upon branched actin assembly inhibition under elevated membrane tension. These data establish that membrane curvature assists in CME nucleation and that the essential function of clathrin during CME is to facilitate curvature evolution, rather than scaffold protein recruitment.


Figures

None
Graphical abstract
Figure 1.
Figure 1.
CME is viewed as a modular process, beginning with nucleation by AP2 and early binding to clathrin. This is followed by stabilization through FCHo1/2, invagination, force production through the actomyosin network, and scission.
Figure 2.
Figure 2.
Ormocomp nanoridges induce curvature and localize the endocytic machinery. (A) Model of CCPs on flat Ormocomp or on the nanoridge substrate. (B) En face scanning EM (left, scale bar 2 μm) and thin-section TEM (right, scale bar 100 nm) of nanoridge substrates showing how the substrates would form invaginations in the ventral cell membrane. (C) Quantification of induced membrane diameter of MDA cells grown on nanoridge substrates. Mean ± SD, n ≥ 4 pillar-membrane contacts per condition. (D) Screen of genome-edited MDA cells expressing endocytic proteins on 75-nm nanoridges, showing increased localization to sites of high curvature. Quantification of enrichment as function of curvature to right. Mean ± SD, n ≥ 5 cells per condition. Scale bar, 5 μm. (E) Example montages of CCPs from the nanoridge substrates demonstrate the canonical fluorescence intensity profile of a CCP on flat or nanoridge substrates. Scale bar, 1 μm. (F) Quantification of average lifetime of CCPs from nanoridge substrates demonstrates slightly increased lifetime as function of induced curvature. ****, P < 0.0001; ***, P < 0.001; *, P < 0.05, Student’s t test. Mean with interquartile range, n ≥ 675 traces from three cells per condition.
Figure S1.
Figure S1.
Curvature alters CCP localization. (A, i and ii) Nanofabrication process, describing mold creation through electron-beam lithography and reactive ion etching, followed by UV-NIL to produce solidified Ormocomp substrates. (B) Refractive-index matching between Ormocomp and glass allows for TIRF microscopy of cells or microtubules. Comparison of fluorescence intensity between TIRF and WF imaging of tilted microtubules reveals the typical exponential decay of the TIRF field for flat substrate or smaller ridges, while larger ridges (≥500 nm) create a secondary TIRF field, especially for shorter (488-nm) wavelengths. Arrows indicate position of nanoridges beneath MTs. (C) Representative TEM images of cells grown on Ormocomp substrates demonstrating the membrane shape induced by the nanoridges. Scale bars: 2 μm in top image, 200 nm in bottom panels. (D) Maximum-intensity projections of BFP-Caax, AP2-RFP, and DNM2-GFP from confocal imaging of a cell on the 75-nm ridges, with quantification of enrichment of AP2-RFP and DNM2-GFP from confocal imaging. Mean ± SD, n = 3 cells per condition. Scale bar, 10 μm. (E) Representative images of membrane markers CellMask Orange and BFP-Caax showing that the entire ventral membrane is illuminated, as well as quantifying the increase in fluorescence intensity of CellMask Orange, BFP-Caax, and Vybrant DiO atop the nanoridge substrates as a function of substrate size. Scale bar, 10 μm; mean ± SD, n = 10 membrane–ridge contacts from three cells per condition. (F) RFP and GFP swaps on AP2 and DNM2 demonstrate that curvature enrichment is independent of the fluorophore chosen. Scale bar, 10 μm; mean ± SD, n = 3 cells per condition.
Figure S2.
Figure S2.
Characterization of CCPs on nanoridges. (A) Representative kymographs of CCPs on nanoridge substrates showing the canonical fluorescence profile with gradual AP2 buildup followed by a late burst of Dynamin2. Scale bar, 5 μm. (B) Averaged, binned CCPs from automated detections on flat and curved substrates demonstrating the same fluorescence profile for all detections, indicating no difference in CCP activity as a function of curvature. Mean ± 0.25SD, n ≥ 675 traces from three cells per condition. (C) Representative thin-section TEM images of CCPs budding from the side of nanoridge substrates, visible through the spiked coat that is typical of a clathrin-coated vesicle, on 120-nm ridges. Arrows indicate clathrin-coated vesicles or growing clathrin-coated pits. (D) Average lifetimes of CCPs on 300- and 500-nm ridges demonstrating that at ridge sizes >200 nm, there is no difference in endocytic lifetime relative to flat membrane. Mean with interquartile range, P value from Student’s t test; n ≥ 450 traces from three cells per condition. (E) Measurement of the percentage of valid, gapped, incomplete, or persistent tracks, demonstrating that substrate size does not affect this distribution; n = 4 cells per condition. (F) Quantification of mean pixel intensity for cells after transferrin endocytosis, demonstrating no detectable difference in fluorescence intensity as a function of ridge size. P value from ANOVA test. Mean ± SD, n = 10 cells per condition. (G) Thin-section TEM of 1,000-nm ridge showing the induced curvature of the ventral cell membrane on the side but not the top of the ridge, with quantification of membrane diameter from 1,000-nm ridge. Scale bar, 200 nm. Mean ± SD, n = 3 membrane–ridge contacts. Arrow indicates a clathrin-coated vesicle. (H) Representative bright-field and AP2-RFP image demonstrating preferential localization of AP2-RFP to the edge of the ridges, where induced curvature is present, rather than to the flat middles. Scale bar, 10 μm.
Figure S3.
Figure S3.
AP2 or FCHo1/2 siRNAs reduce expression. (A) Western blot demonstrating reduced AP2 mu subunit expression upon siRNA treatment. (B) Representative images of AP2-RFP from control or AP2 siRNA cells showing reduced AP2-RFP expression upon siRNA treatment. Scale bar, 10 μm. (C) Representative TEM images from AP2 and clathrin siRNA cells showing that membrane adhesion to nanoridges is not affected by siRNA treatment, with quantification in D. Mean, n ≥ 4 membrane–ridge contacts from three cells each; P values from ANOVA. (E) Western blot demonstrates reduced FCHo1/2 expression after exposure to siRNAs. (F) Brightness of automatically detected AP2-RFP puncta demonstrates a decrease upon FCHo1/2 siRNA treatment that is unchanged by curvature. Mean with interquartile range. ***, P < 0.001, from multiple t test. n ≥ 65 puncta from three different cells per condition. (G) Quantification of lifetimes of all AP2 tracks from control or siRNA-treated cells. There is a persistent reduction in lifetime after FCHo1/2 siRNA treatment, which is unchanged by induced membrane curvature, indicating that sites do not mature correctly to full CCPs but instead disassemble. Mean with interquartile range. *, P < 0.05; ns, P > 0.05, from ANOVA. n ≥ 780 traces from three different cells per condition.
Figure 3.
Figure 3.
Induced curvature does not rescue nucleation disruption. (A and B) Representative images of cells from flat substrate (A) or 75-nm ridges (B) expressing CLTA RFP or dynamin2 GFP with control or AP2 siRNA. Scale bar, 10 μm. (C) Quantification of CLTA or dynamin2 puncta density as a function of induced curvature; **, P < 0.01; *, P < 0.05; ns, P > 0.05 from multiple t test with Welch correction. Mean ± SD, n = 3 cells per condition. (D) Enrichment score for clathrin and dynamin is reduced after AP2 knockdown. **, P < 0.01; *, P < 0.05; ns, P > 0.05 from multiple t test. Mean ± SD, n = 3 cells per condition. (E) Model of endocytic protein localization after AP2 knockdown, showing no detectable difference without nucleating factor AP2.
Figure 4.
Figure 4.
Curvature enhances nucleation but does not bypass CCP stabilization. (A and B) Representative images of cells on flat substrate (left) or 75-nm ridges (right) demonstrating a reduction in AP2-RFP and DNM2-GFP number and intensity after FCHo1/2 knockdown, which is not rescued by induced curvature. (C) Quantification of puncta density after siRNA treatment showing reduction in number with siRNA treatment that is not rescued by induced curvature. **, P < 0.01; *, P < 0.05; ns, P > 0.05 from multiple t test. Mean ± SD, n = 3 cells per condition. (D) Enrichment score for AP2-RFP and DNM2-GFP demonstrates enrichment of both proteins on nanoridges after FCHo1/2 disruption, despite the decreased number and intensity. *, P < 0.05; ns, P > 0.05 from multiple t test. Mean ± SD, n = 3 cells per condition. (E) Kymographs of AP2-RFP demonstrate short, dim tracks, typical of abortive CCPs lacking FCHo1/2. Scale bar, 5 μm. Brightness of FCHo1/2 knockdown kymographs is increased 5× for visualization. (F) Model of CCP nucleation in response to induced curvature after FCHo1/2 knockdown, in which curvature enhances the nucleation of AP2 sites, but the sites are not stabilized and therefore disassemble rather than maturing.
Figure S4.
Figure S4.
Clathrin siRNA reduces expression and detection through IF. (A) Western blot demonstrating reduced clathrin heavy chain expression upon siRNA treatment, with quantification of average knockdown efficiency. Mean ± SD, n = 4. (B) Intensity of AP2-RFP puncta with control or clathrin siRNA. Mean with interquartile range, n ≥ 350 puncta from three cells per condition. (C) Representative images of IF to clathrin heavy chain from control and clathrin knockdown cells on flat substrates or 75-nm ridges, highlighting reduced clathrin heavy chain detection after knockdown regardless of curvature. (D) Pearson’s correlation coefficient of AP2-RFP and clathrin heavy chain IF with or without clathrin knockdown. Mean ± SD, n = 10 cells per condition. (E) Quantification of clathrin heavy chain fluorescence intensity per pixel at sites of AP2-RFP for flat or curved substrates with and without knockdown. Mean with interquartile range; n ≥ 200 puncta form three cells per condition.
Figure 5.
Figure 5.
Curvature rescues a defect in endocytic site formation resulting from clathrin knockdown. (A and B) Representative images of control or clathrin siRNA cells grown on flat (A) or 75-nm ridge (B) substrate showing a marked increase in endocytic site fluorescence intensity and overlap of AP2 with dynamin2 in clathrin knockdown cells grown on nanoridge substrates. Scale bar, 10 μm. (C) Enrichment of AP2-RFP and DNM2-GFP is unchanged after clathrin knockdown, indicating that localization of CCPs to regions of induced membrane curvature is independent of clathrin expression. P values from multiple t tests, Mean ± SD, n = 3 cells per condition. (D) Induced curvature rescues the AP2 overlap with DNM2-GFP for automated AP2 detections; however, it does not rescue the AP2 overlap with residual CLTA-RFP detection for automated AP2 detections. ***, P < 0.001; **, P < 0.01; *, P < 0.05; ns, P > 0.05 from multiple t test. Mean ± SD, n = 3 cells per condition. (E) Model of endocytic protein stabilization in the absence of clathrin coats at regions of induced membrane curvature.
Figure 6.
Figure 6.
Curvature rescues endocytic dynamics site after clathrin knockdown. (A) Representative montages of AP2-RFP/DNM2-GFP sites from control or clathrin knockdown cells, with or without induced membrane curvature, showing that with induced curvature there is enhanced AP2-RFP fluorescence and DNM2-GFP recruitment. Scale bar, 1 μm. (B) Averaged, binned tracks of AP2-RFP and DNM2-GFP from control (Bi) or clathrin knockdown (Bii) cells, demonstrating that induced membrane curvature restores track profiles to canonical form. Mean ± 0.25SD, n ≥ 1,200 tracks from three cells per condition. (C) Average lifetimes from B showing that with clathrin knockdown, CCPs on nanoridges have an increased lifetime of ∼70 s on average compared with 55 s for control events on nanoridges. ****, P < 0.0001, Student’s t test. Mean with interquartile range, n ≥ 1,200 tracks from three cells per condition.
Figure S5.
Figure S5.
CK666 or osmotic shock alone has little effect on CCPs on Ormocomp. (A) Enrichment of AP2/DNM2 is unchanged by CK666 treatment. P value from multiple t test, n = 3 cells per condition. Mean ± SD. (B) Example kymographs from 75-nm ridges demonstrate that CK666 treatment does not notably alter endocytic profiles compared to DMSO treatment. Scale bar, 5 μm. (C) Relative frequencies of CCPs from flat or nanoridge substrates with CK666 demonstrates ∼5–10% increase in lifetimes with CK666 treatment (compared with a 20–50% increase for cells grown on glass), evidence of low dependence on actin polymerization for most CCPs on Ormocomp. n ≥ 200 tracks from three cells per condition. (D) Average CCP lifetime is unchanged by shock with 150 mOsm media, across nanoridge sizes. n ≥ 200 tracks from three cells per condition. (E) Combination of 150 mOsm with CK666 leads to modest increase in endocytic lifetime on flat Ormocomp substrates. n ≥ 200 tracks from three cells per condition.
Figure 7.
Figure 7.
CK666 treatment under elevated tension increases enrichment and lifetime at sites of high curvature. (A) Combination of osmotic shock and CK666 enhances CCP localization to 75-nm nanoridges. Mean ± SD. *, P < 0.05; ns, P > 0.05 from multiple t test, n = 3 cells per condition. (B and C) Osmotic shock and CK666 together cause a marked increase in percentage of tracks identified as persistent (i.e., present throughout 5-min time-lapses), as quantified in B and demonstrated in kymographs in C. Scale bar, 5 μm. Mean ± SD. ****, P < 0.0001; ***, P < 0.001; ns, P > 0.05, ANOVA; n ≥ 16 kymographs from three cells per condition. (D) Representative montages of CCPs from osmotic shock alone (top) and osmotic shock with CK666 (bottom), showing persistence of AP2/DNM2 fluorescence with correlated bursts of fluorescence intensity across the two fluorophores, with fluorescence traces below. Scale bar, 1 μm.
Figure 8.
Figure 8.
Curvature rescues cargo uptake after clathrin knockdown. (A) Representative maximum-intensity projections of Alexa Fluor 647–labeled transferrin from control, clathrin siRNA, and AP2 siRNA cells with or without curvature, showing an increase in fluorescence intensity of clathrin knockdown cells with induced curvature that is absent from AP2 knockdown cells. Scale bar, 10 μm. (B) Quantification of mean pixel intensity from transferrin uptake assays. Mean ± SD. ****, P < 0.0001; ns, P > 0.05 from Student’s t test, n = 10 cells per condition. (C) X-Z projections of control or clathrin knockdown cells, showing that with induced curvature, the fluorescence of Alexa Fluor 647–transferrin is present near the DAPI stain, rather than membrane-associated cargoes. Scale bar, 10 μm. Arrows indicate perinuclear transferrin puncta. (D) Elliptical, electron-clear area visible from the side of a nanoridge substrate from a clathrin knockdown cell, which may be a clathrin-free vesicle caught near the moment of scission. Scale bar, 200 nm. Arrow indicates putative vesicle.

Comment in

  • Curvature-mediated endocytosis.
    Strzyz P. Strzyz P. Nat Rev Mol Cell Biol. 2022 Jul;23(7):447. doi: 10.1038/s41580-022-00497-4. Nat Rev Mol Cell Biol. 2022. PMID: 35577988 No abstract available.
  • Clathrin: Bender or bystander?
    Stachowiak JC. Stachowiak JC. J Cell Biol. 2022 Jul 4;221(7):e202206014. doi: 10.1083/jcb.202206014. Epub 2022 Jun 15. J Cell Biol. 2022. PMID: 35704021 Free PMC article.

Similar articles

Cited by

References

    1. Aghamohammadzadeh, S., and Ayscough K.R.. 2009. Differential requirements for actin during yeast and mammalian endocytosis. Nat. Cell Biol. 11:1039–1042. 10.1038/ncb1918 - DOI - PMC - PubMed
    1. Aguet, F., Antonescu C.N., Mettlen M., Schmid S.L., and Danuser G.. 2013. Advances in analysis of low signal-to-noise images link dynamin and AP2 to the functions of an endocytic checkpoint. Dev. Cell. 26:279–291. 10.1016/j.devcel.2013.06.019 - DOI - PMC - PubMed
    1. Avinoam, O., Schorb M., Beese C.J., Briggs J.A.G., and Kaksonen M.. 2015. ENDOCYTOSIS. Endocytic sites mature by continuous bending and remodeling of the clathrin coat. Science. 348:1369–1372. 10.1126/science.aaa9555 - DOI - PubMed
    1. Bender, M., Otto M., Hadam B., Spangenberg B., and Kurz H.. 2002. Multiple imprinting in UV-based nanoimprint lithography: Related material issues. Microelectron. Eng. 61–62:407–413. 10.1016/S0167-9317(02)00470-7 - DOI
    1. Boulant, S., Kural C., Zeeh J.C., Ubelmann F., and Kirchhausen T.. 2011. Actin dynamics counteract membrane tension during clathrin-mediated endocytosis. Nat. Cell Biol. 13:1124–1131. 10.1038/ncb2307 - DOI - PMC - PubMed

Publication types

MeSH terms